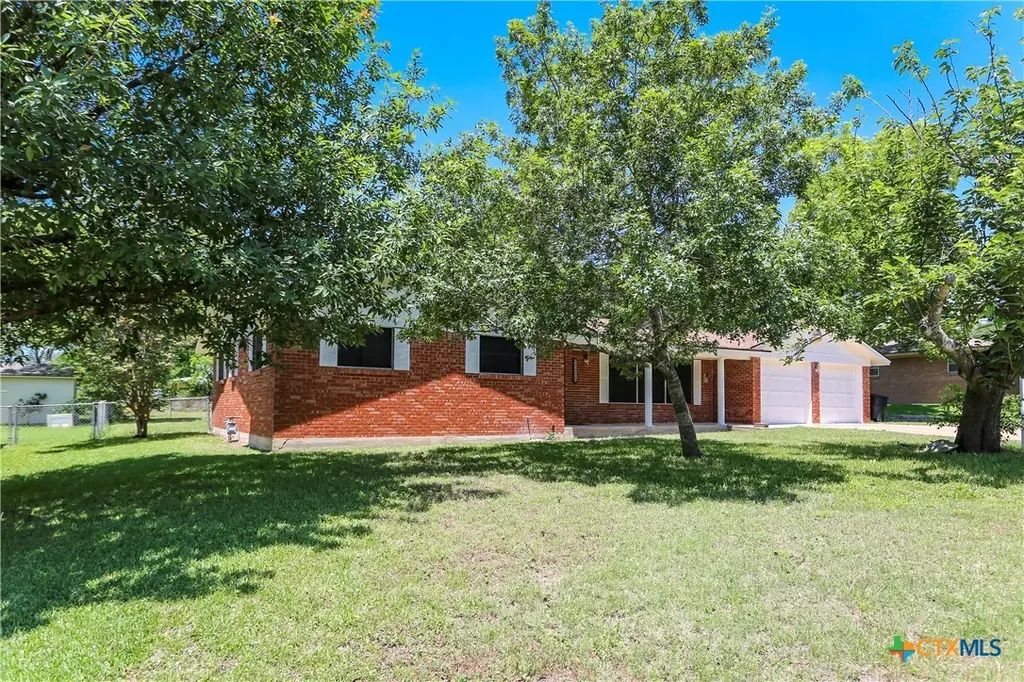
3006 Cordova Dr · Temple, TX
Flood risk 1/10 · Minimal
- FEMA flood zone
- X (unshaded)
- Chance of flooding over 30 yrs
- 0.0%
- Est. flood insurance / yr
- $507 – $1,088
Fire risk 3/10 · Minor
- Est. fire insurance / yr
- $1,222 – $2,270
Heat risk 8/10 · Major
- Hot days now (above 108°F)
- 7 days/yr
- Hot days in 30 yrs
- 22 days/yr
Wind risk 6/10 · Moderate
- Chance of severe wind over 30 yrs
- 71.0%
Air-quality risk 2/10 · Minimal
- Unhealthy air days now
- 0 days/yr
- Unhealthy air days in 30 yrs
- 1 days/yr
Risk factors via First Street. Map © Google.
Why this score? — see what drove the D grade
The composite is a weighted blend of 9 inputs, each scored 0–100. Each bar is that input's sub-score; the figure is the points it added to the 100-point composite (weight × sub-score).
- ARV discount +13.9/15.0
- Cash flow +9.5/30.0
- 1% rule +3.9/10.0
- Livability +3.8/5.0
- DSCR +2.7/10.0
- Schools +2.7/10.0
- Condition / age +2.5/5.0
- Rent growth +2.3/5.0
- Appreciation +0.0/10.0
$199,700
🖨 Deal sheet 📄 Offer letter ✓ Due diligence
Listing remarks
Lovely 4 bedroom, 2 Bath home situated in an established neighborhood within minutes from I-35, shopping, hospital and more. The front porch welcomes you into a foyer with vintage tile. A spacious living room with a bank of window offering natural light is perfect for gatherings or can serve as quiet retreat. Continue forward to find a hallway leading to the primary bedroom, two secondary bedrooms and a hall bath. The back of the house boasts a large family room open to the kitchen. Other interior features include the laundry room that leads to a fourth bedroom with a large closet. Enjoy the private setting the covered patio with privacy fence enclosure offers. Recent improvements include i
Key facts
- Large family room
- Covered patio
- Interior tile
Tags
Property features AI
Finance
- HOA & community: Curbs
Exterior
- Parking: 1-car garage with garage door opener
- Utilities: Public water; High-speed internet available
- Home design: Single-story home; Resale property
- Construction: Brick veneer and HardiPlank/masonry exterior; Composition/shingle roof; Slab foundation; Built in (year per assessor)
- Exterior features: Covered patio; Patio; Storage; Back yard fencing (chain link, privacy, wood)
Interior
- Kitchen: Dishwasher; Electric range; Oven; Built-in oven; Refrigerator; Range
- Flooring: Carpet; Ceramic tile
- Bathrooms: 2 full bathrooms
- Heating & cooling: Central heating (natural gas); Central air conditioning (electric, one unit)
- Interior features: Ceiling fans; Double vanity; Entrance foyer; Breakfast bar; Breakfast area / eat-in kitchen; Kitchen open to family room; Kitchen / dining combo; Storm door(s); See remarks
- Laundry & utility: Laundry room inside; Water heater; Some electric appliances
Neighborhood map
What this means for you Summary
Snapshot
- This is a 4-bed/2.0-bath single-family listed at $200k.
Deal economics
- At list price, monthly cash flow is $-140 ($-2k/yr) — negative.
- To cash-flow at today's rent, offer at most $175k (12.4% below list).
- To meet the 1% rule (rent ≥ 1% of price), the offer needs to be $177k (11.2% below list).
- Recommended offer: $175k (12.4% below list) — sets the bar for cash-flow.
- Cap rate 5.5% vs local median 3.6% in Temple — top-decile yield for the area; either an underpriced asset or a hidden risk that comps aren't pricing in. Stress-test before assuming the spread holds.
Location & tenants
- Location reads 75/100 on livability (#122 in TX, #3,814 nationally) — a middle-class / working-renter tenant base. Strengths: cost of living A+, housing A+, health & safety A+; Watch: schools C-, commute C-, crime D+.
- Temple ISD (urban): math 32% / reading 31% proficiency, ranked #590 of 826 in TX (top 71%) — families likely to look elsewhere, expect single-tenant / working-renter base with shorter leases; 66% free/reduced lunch — lower-income household profile, screen leases tightly.
- Market conditions: Rents soft (-0.8%/yr); 1114 active listings in the ZIP; 12 comparable units currently listed for rent nearby; rentals lingering (median 44d on market — plan ~5-8 weeks vacancy on turnover, expect pricing pressure); 67% of comp listings sitting > 30 days — soft ceiling on asking rent; solid renter incomes; 3,222 units permitted in Bell County in 2024 (246 in 5+ unit buildings).
Forward outlook
- Local home prices are declining (-3.0%/yr); year-one equity from $1k of loan paydown is wiped out by about $6k of value loss. Plan a longer hold.
- Bell County population projected at +21% by 2050 — long-run rental-demand tailwind backs the buy-and-hold thesis.
Negotiation context
- It's been on market 35 days — a 3% lower offer ($194k) is reasonable based on typical stale-listing flexibility.
- 2 sale attempts since 15y ago with the ask held roughly flat each time — persistent listings suggest the price (not the market) is what's stuck; bring a comps-based counter.
Risks & watch-outs
- Climate carrying-cost: major wind risk, 71% chance of damaging wind over 30y; extreme-heat days projected 7→22/yr by 2055 (HVAC capex compounding) — expect insurance premiums to compound above CPI over the hold.
Questions for the listing agent
- What do current leases actually rent for vs. the listed asking? Can we see a recent rent roll and the last 12 months of T-12 income?
- It's been on market 35 days. Have you received any prior offers? Is the seller open to a 12% concession, seller financing, or rate buy-down credit?
- Built in 1966 — when were the roof, HVAC, electrical panel, plumbing, and water heater last replaced?
- Is there a deadline driving the sale (1031 exchange, divorce, estate, relocation)? That informs how much negotiation room exists.
- Crime grade is D in this area — have there been break-ins, vandalism, or insurance claims at this property in the last 3 years? What carrier currently insures it and at what premium?
- The area grade is low — what's the realistic commute time and amenity access for the typical tenant pool here? Any planned neighborhood developments (good or bad) we should know about?
- What's the average days-on-market for RENTAL listings here right now (not sales)? A rising rental-DOM trend means longer vacancies and softer asking-rent achievability than the comps imply.
- What's the recent tenant-quality profile in this submarket — average credit score on applications, eviction rate, late-payment / NSF rate, and stable-employment percentage? A property-management company in the area should have these aggregated.
- How much new for-sale + rental construction is in the pipeline within 1–3 miles? Heavy new supply typically softens prices + rents 12–24 months out; constrained supply supports both.
Investment metrics
- 1% rule
- 0.89% ✗
- Cap rate
- 5.45%
- Cash-on-cash
- -3.01%
- DSCR
- 0.87
- GRM
- 9.4
CMA / ARV
- ARV (median comp)
- $232,971
- List price
- $199,700
- Delta
- -14.28%
- Verdict
- UNDERPRICED
- Comps
- 20 within 1.0 mi
Show comp detail 12 sales within ~0.75 mi
| Address | Dist | Beds/Ba | Sqft | Sold | Price | $/sf | Match |
|---|---|---|---|---|---|---|---|
| 3222 Rosewood Dr | 0.44mi | 3/2.0 (-1) | 1,344 (-6%) | 5mo | $174,000 | $129 | 61 |
| 4105 Wren Rd | 0.38mi | 3/2.0 (-1) | 1,541 (+8%) | 5mo | $221,000 | $143 | 60 |
| 4417 Briarwood Dr | 0.50mi | 3/2.0 (-1) | 1,362 (-5%) | 8mo | $144,000 | $106 | 57 |
| 4409 Briarwood Dr | 0.48mi | 4/2.0 | 1,317 (-8%) | 9mo | $200,000 | $152 | 57 |
| 3901 Lark Trl | 0.46mi | 3/2.0 (-1) | 1,558 (+9%) | 3mo | $125,000 | $80 | 56 |
| 3113 Lawnwood Dr | 0.49mi | 3/2.0 (-1) | 1,305 (-8%) | 3mo | $173,500 | $133 | 55 |
| 3910 Hickory Rd | 0.59mi | 3/2.0 (-1) | 1,521 (+7%) | 5mo | $193,500 | $127 | 52 |
| 4508 Briar Cliff Rd | 0.52mi | 3/2.0 (-1) | 1,549 (+8%) | 5mo | $210,000 | $136 | 52 |
| 4010 Valley View Dr | 0.69mi | 3/2.0 (-1) | 1,498 (+5%) | 4mo | $203,900 | $136 | 51 |
| 3925 Loop Dr | 0.70mi | 3/2.0 (-1) | 1,397 (-2%) | 14mo | $239,900 | $172 | 47 |
| 3106 Lawnwood Dr | 0.53mi | 3/2.0 (-1) | 1,240 (-13%) | 10mo | $155,000 | $125 | 40 |
| 3806 Brooklawn Dr | 0.60mi | 3/2.0 (-1) | 1,569 (+10%) | 13mo | $259,000 | $165 | 39 |
Match score weights: distance 35% · size 25% · config 20% · recency 20%. Top-matched comps best support the ARV.
Projected returns pro-forma
-3.0% appreciation · 0.0% rent growth · sell at horizon
- IRR
- -25.1%
- Equity multiple
- 0.17×
- Total profit
- $-46,354
- Equity at exit
- $29,776
- IRR
- -36.3%
- Equity multiple
- -0.28×
- Total profit
- $-71,427
- Equity at exit
- $17,266
Cash invested: $55,916 (down + closing). Projections, not guarantees.
Landlord ↔ Tenant lean methodology
- Overall (STATE)
- 87 Strongly Landlord-Friendly
- State Texas
- 87 Strongly Landlord-Friendly · R+5
- County
- — inherits STATE
- City
- — inherits STATE
ZIP-level market 76502
- Rents YoY
- -0.8%
- Active inventory
- 1114
- Price-to-rent
- 9.4×
Monthly cashflow live
- Estimated rent
- $1,773 high interval (Pro) →
- Mortgage (P&I)
- −$1,047
- Tax from tax record
- −$410 /mo · $4,925/yr
- Insurance
- −$83
- HOA
- −$0
- Vacancy / Maint / Mgmt
- −$372
- Net cashflow
- $-140
Break-even live
UW: 25.0% down · 7.5% · 30yr · 1.5% tax · 5.0% vac · 8.0% maint · 8.0% mgmt
Financing live
Cash to close
- Down payment
- $49,925
- Closing costs
- $5,991
- Reserves months
- —
- Total cash needed
- —
Loan-product check · same deal, 3 products live
Conventional
25% down · 7.5% · 30yr
- Down + closing
- —
- Monthly P&I
- —
- Monthly cashflow
- —
- DSCR
- —
- Eligible?
- —
Personal DTI + credit; lowest rate.
DSCR
20% down · 8.5% · 30yr
- Down + closing
- —
- Monthly P&I
- —
- Monthly cashflow
- —
- DSCR
- —
- Eligible?
- —
No personal income docs; deal must DSCR.
Hard money
10% down · 12.0% · 12mo
- Down + closing
- —
- Monthly P&I
- —
- Monthly cashflow
- —
- DSCR
- —
- Eligible?
- —
Short-term bridge; refi at stabilization.
Rent comps 12 comps
| Address | Beds | Baths | Sqft | Rent | $/sqft | DOM | Units | Dist |
|---|---|---|---|---|---|---|---|---|
| 2506 Blue Jay Dr Temple, TX | 4.0 | 2.0 | 1549 | $1,650 | $1.07 | 43d | 1 | 0.51mi |
| 2909 Oakdale Dr Temple, TX | 3.0 | 2.0 | 1732 | $1,600 | $0.92 | 43d | 1 | 0.53mi |
| 3301 East Dr Temple, TX | 3.0 | 2.0 | 1457 | $3,900 | $2.68 | 43d | 1 | 0.62mi |
| 1926 S 55th St Temple, TX | 3.0 | 1.0 | 1005 | $1,295 | $1.29 | 43d | 1 | 1.02mi |
| 2106 S 47th St Temple, TX | 3.0 | 2.0 | 1498 | $1,645 | $1.10 | 13d | 1 | 1.18mi |
| 1506 Live Oak Dr Temple, TX | 3.0 | 2.0 | 1571 | $1,475 | $0.94 | 43d | 1 | 1.29mi |
| 1817 S 45th St Temple, TX | 3.0 | 2.0 | 1288 | $1,495 | $1.16 | 23d | 1 | 1.34mi |
| 3809 Lancelot Ln Temple, TX | 3.0 | 2.0 | 1397 | $1,645 | $1.18 | 43d | 1 | 1.40mi |
| 2102 Scott Blvd Temple, TX | 1.0–3.0 | 1.0–2.0 | 924 | $2,165 | $2.34 | 13d | 22 | 1.42mi |
| 4713 Stagecoach Trl Temple, TX | 3.0 | 2.0 | 1808 | $1,650 | $0.91 | 43d | 1 | 1.45mi |
| 2510 S 31st St Temple, TX | 1.0–3.0 | 1.0–2.0 | 987 | $1,640 | $1.66 | 13d | 26 | 1.46mi |
| 1914 Buckskin Trl Temple, TX | 3.0 | 2.0 | 1406 | $1,675 | $1.19 | 43d | 1 | 1.49mi |
Listing history 18 events
-
2026-06-18days on market $199,700 Active 35 DOM
-
2026-06-17days on market $199,700 Active 34 DOM
-
2026-06-16days on market $199,700 Active 33 DOM
-
2026-06-15days on market $199,700 Active 32 DOM
-
2026-06-14pricedays on market $199,700 Active 30 DOM
-
2026-06-10days on market $204,000 Active 27 DOM
-
2026-06-09days on market $204,000 Active 26 DOM
-
2026-06-08days on market $204,000 Active 25 DOM
-
2026-06-07days on market $204,000 Active 24 DOM
-
2026-06-03days on market $204,000 Active 20 DOM
-
2026-06-02days on market $204,000 Active 19 DOM
-
2026-06-01days on market $204,000 Active 18 DOM
-
2026-05-31days on market $204,000 Active 17 DOM
-
2026-05-30days on market $204,000 Active 16 DOM
-
2026-05-14$204,000 Active 771-char remark
-
2013-08-30soldstatus
-
2011-10-01$105,000
-
2006-10-10soldstatus
ⓘ Source: listings_history table (triggers on properties + properties_extension) + one-shot
backfill from property_details.listing_events for pre-trigger history.
Tax reassessment forecast TX · Resets to sale price
- Current annual tax
- $4,925 · $410/mo
- Projected year-2 tax
- $4,925 · $410/mo
- Expected delta
- $0/yr ($0/mo · 0.0%)
ⓘ Screening estimate from a state-policy table — verify with the county assessor before closing.
Climate risk First Street
- Flood 1/10 Low FEMA zone X (unshaded) · 0% chance over 30 yrs
- Wildfire 3/10 Moderate
- Heat 8/10 Severe 7 d/yr ≥108°F today · 22 d/yr by 30 yrs out
- Wind 6/10 Major 71% chance of damaging wind over 30 yrs
- Air quality 2/10 Low 0 unhealthy d/yr today · 1 by 30 yrs out
Nearby sold comps map
Loading sold comps map…
Walkable amenities ~0.75 mi
Loading nearby amenities…
Taxation est. · year 1
- Rental income
- $21,277
- − Mortgage interest
- −$11,186
- − Property taxes
- −$4,925
- − Insurance
- −$998
- − Repairs & maintenance
- −$1,702
- − Management
- −$1,702
- − Depreciation
- −$5,809
- Taxable loss
- −$5,046
- Est. tax savings @ 24.0%
- +$1,211
- After-tax cash flow
- $-470/yr
For passive investors: Depreciation is non-cash, so a rental often shows a tax loss while cash-flowing — sheltering income. Rental losses are passive: they offset passive income freely, and up to $25,000/yr can offset ordinary (W-2) income if you actively participate and your MAGI is under $100k (phasing out to $0 by $150k); unused losses carry forward. On sale, claimed depreciation is recaptured at up to 25%, and gains may owe capital-gains tax (a 1031 exchange can defer both). Figures are a year-1 estimate at your 24.0% rate — not tax advice; consult a CPA.
Schools (NCES district)
- District
- Temple ISD
- NCES district ID
- 4842330
- Math proficiency
- 32% ▼ -8.00%
- Reading proficiency
- 31% ▼ -4.00%
- Median HH income
- $43,120
- Composite
- 26.8/100
- National rank
- #7123
- State rank
- #590 of 826 in TX
Livability — Temple
- Score
- 75/100
- State rank
- #122
- US rank
- #3814
Category grades
Schools grade is shown separately in the Schools card above.
Census & demographics
- Census place
- Temple, TX
- County
- Bell County · 345,090 people
- City population
- 96,587
- Metro
- Killeen-Temple, TX
- Population (ZIP)
- 52,669
- Household income
- $82,088
- Rent vs Own
- Severe rent burden
- 1890.0
Population outlook (Bell County) Hauer SSP2
- Today (2025)
- 371,114 people
- By 2030
- 389,104 · +4.8%
- By 2040
- 420,592 · +13.3%
- By 2050
- 447,779 · +20.7%
- By 2075
- 499,130 · +34.5%
- By 2100
- 505,680 · +36.3%
Race, ethnicity, and origin ACS 2023
- Neighborhood character
- Diverse neighborhood (Simpson 0.59)
- Race & ethnicity
- White 58% Hispanic / Latino 26% Two or more races 15% Black 9% Asian 3%
- Hispanic origin (detail)
- Mexican 21% Puerto Rican 2%
- Common ancestry
- Italian 2% Slovak 2% Serbian 1%
- Foreign-born
- 7% · Canada, South Korea, China
- Languages at home
- 86% English-only · Spanish 10% Other Indo-European 1% Korean 1%
Political lean MEDSL · Bell
- 2024 margin
- R (+16.2) · D 41.3% · R 57.6% · Other 1.1%
- 2008→2024 swing
- -6.5pp toward R · 2008: -9.8pp · 2024: -16.2pp
- All cycles
- 2024: R+16.2 2020: R+8.5 2016: R+15.1 2012: R+16.4 2008: R+9.8
Not yet ingested
- Civics
- —
Market trends
- HPI YoY
- ▼ -216.80%
- Current HPI
- 166.927
- Rent YoY
- ▼ -0.79%
- Metro
- Killeen-Temple, TX
- State GDP YoY
- ▲ 3.95%
- F500 in state
- 110
Industry mix (Fortune 500 HQ in TX)
| Industry | F500 HQs | Revenue |
|---|---|---|
| Energy | 16 | $1,198B |
|
||
| Technology | 5 | $198B |
|
||
| Engineering / Construction | 4 | $72B |
|
||
| Energy Services | 3 | $60B |
|
||
| Utilities | 3 | $41B |
|
||
| Healthcare | 2 | $330B |
|
||
Price history
+90.2% since first listed5 events — show timeline
- 2026-06-11 Price Changed $199,700 CTXMLS
- 2026-05-14 Listed $204,000 CTXMLS
- 2013-08-30 Sold (Public Records) — Public Records
- 2011-10-01 Listed $105,000 CTXMLS
- 2006-10-10 Sold (Public Records) — Public Records
Property tax history
+5.7%/yrLatest (2026): $4,925 · +10.0% YoY. Source: county tax records.
Cash-flow waterfall
monthlySold comps — $/sqft
last 12 mo · ≤1 miLoading sold comps…