 Triplex
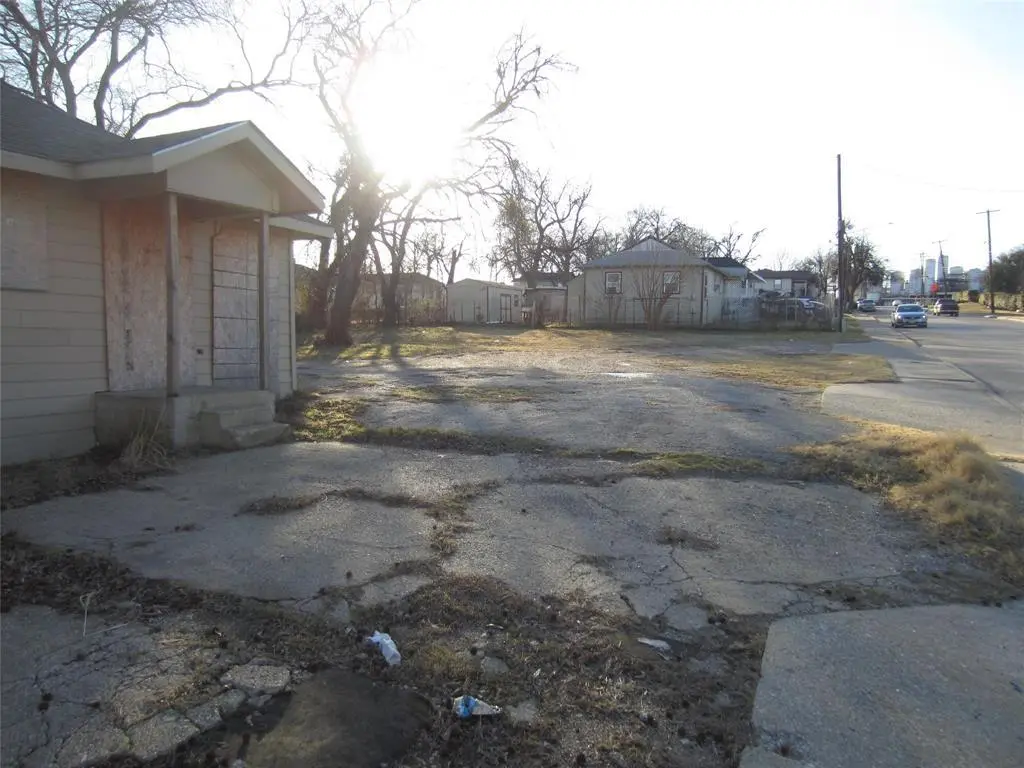
3517 Forney Rd · Dallas, TX
Flood risk 1/10 · Minimal
- FEMA flood zone
- X (unshaded)
- Chance of flooding over 30 yrs
- 0.0%
- Est. flood insurance / yr
- $507 – $1,088
Fire risk 1/10 · Minimal
- Est. fire insurance / yr
- $1,222 – $2,270
Heat risk 8/10 · Major
- Hot days now (above 109°F)
- 7 days/yr
- Hot days in 30 yrs
- 26 days/yr
Wind risk 6/10 · Moderate
- Chance of severe wind over 30 yrs
- 27.0%
Air-quality risk 2/10 · Minimal
- Unhealthy air days now
- 2 days/yr
- Unhealthy air days in 30 yrs
- 2 days/yr
Risk factors via First Street. Map © Google.
Why this score? — see what drove the C+ grade
The composite is a weighted blend of 9 inputs, each scored 0–100. Each bar is that input's sub-score; the figure is the points it added to the 100-point composite (weight × sub-score).
- Cash flow +26.5/30.0
- DSCR +9.0/10.0
- ARV discount +7.9/15.0
- 1% rule +6.1/10.0
- Livability +4.0/5.0
- Schools +2.8/10.0
- Rent growth +2.5/5.0
- Condition / age +2.5/5.0
- Appreciation +0.0/10.0
$275,000
🖨 Deal sheet 📄 Offer letter ✓ Due diligence
Multi-family units
County records classify this as Multi-Family (5+ Unit). Listing-text estimate: 3 units. estimate disagrees with records
5+ unit building — per-unit beds/baths from public records are typically unavailable; the breakdown below (if shown) is an estimate from the listing text.
Listing remarks MLS
Priced to sell, this triplex offers a strong value-add opportunity in Dallas. Zoned commercial under Senate Bill 840, allowing multifamily development without rezoning, this property is ideal for investors or developers. Three 1-bedroom units in a single building with city water and sewer, offering flexibility for renovation, redevelopment, or long-term investment potential.
Key facts
- City water and sewer
- Triplex
- Zoned commercial
Tags
Neighborhood map
What this means for you Summary
Snapshot
- This is a 3 × 1-bed/1-bath units multifamily listed at $275k.
Deal economics
- At list price, monthly cash flow is $727 ($9k/yr) — positive. Per door: $242/mo.
- The deal already cash-flows at list — no discount required.
- Meets the 1% rule at list price ($3k rent vs $275k).
- Recommended offer: $242k (12.0% below list) — sets the bar for market timing.
- Cap rate 9.5% vs local median 2.3% in Dallas — top-decile yield for the area; either an underpriced asset or a hidden risk that comps aren't pricing in. Stress-test before assuming the spread holds.
Location & tenants
- Location reads 81/100 on livability (#24 in TX, #1,380 nationally) — a professional / high-income tenant draw. Strengths: amenities A+, commute A+, housing A+; Watch: schools C-, crime F.
- Dallas ISD (urban): math 31% / reading 36% proficiency, ranked #559 of 826 in TX (top 68%) — families likely to look elsewhere, expect single-tenant / working-renter base with shorter leases; 83% free/reduced lunch — lower-income household profile, screen leases tightly.
- Market conditions: 88 active listings in the ZIP; 40 comparable units currently listed for rent nearby; rentals at typical pace (median 20d on market — plan ~3-4 weeks tenant-placement turnaround); 12,577 units permitted in Dallas County in 2024 (6,829 in 5+ unit buildings).
- At $3,065/mo this rent would consume 50% of the median local household income ($73k/yr) (locally 526% of renters already pay >50% of income on rent) — very limited rent-growth headroom before tenants either downsize or default.
Forward outlook
- Local home prices are declining (-3.0%/yr); year-one equity from $2k of loan paydown is wiped out by about $8k of value loss. Plan a longer hold.
- Dallas County population projected at +35% by 2050 — long-run rental-demand tailwind backs the buy-and-hold thesis.
- At projected returns (-3.0% appreciation + 3.0% rent growth), your $77k cash investment doubles in ~10 years — after that, you're playing with house money.
Negotiation context
- It's been on market 133 days — a 12% lower offer ($242k) is reasonable based on typical stale-listing flexibility.
- 5 sale attempts; this cycle's ask has dropped $20k (7%) from the opening price — seller is motivated, your offer sets the floor, not the list.
- Current owner paid $798; list at $275k implies a 34361% gain — meaningful room to come down on a strong offer.
Risks & watch-outs
- Watch-outs: built in 1955 — expect roof / HVAC / electrical / plumbing capex.
- Climate carrying-cost: major wind risk, 27% chance of damaging wind over 30y; extreme-heat days projected 7→26/yr by 2055 (HVAC capex compounding) — expect insurance premiums to compound above CPI over the hold.
Questions for the listing agent
- It's been on market 133 days. Have you received any prior offers? Is the seller open to a 12% concession, seller financing, or rate buy-down credit?
- Can we see the unit-by-unit rent roll, current vacancy, and any below-market leases? What's the average tenancy length?
- What capital expenditures (roof, boiler, parking lot, exteriors) have been made in the last 5 years, and what's planned in the next 2?
- Built in 1955 — when were the roof, HVAC, electrical panel, plumbing, and water heater last replaced?
- Why hasn't it sold? Are there any deal-killer items the seller is aware of (foundation, flood, title, zoning, code violations)?
- Is there a deadline driving the sale (1031 exchange, divorce, estate, relocation)? That informs how much negotiation room exists.
- Crime grade is F in this area — have there been break-ins, vandalism, or insurance claims at this property in the last 3 years? What carrier currently insures it and at what premium?
- What's the average days-on-market for RENTAL listings here right now (not sales)? A rising rental-DOM trend means longer vacancies and softer asking-rent achievability than the comps imply.
- What's the recent tenant-quality profile in this submarket — average credit score on applications, eviction rate, late-payment / NSF rate, and stable-employment percentage? A property-management company in the area should have these aggregated.
- How much new apartment / multifamily construction is in the pipeline within 1–3 miles? Heavy new supply (>2% of stock underway) typically softens rents 12–24 months out; light construction supports rent growth.
Investment metrics
- 1% rule
- 1.11% ✓
- Cap rate
- 9.46%
- Cash-on-cash
- 11.33%
- DSCR
- 1.50
- GRM
- 7.5
CMA / ARV
- ARV (median comp)
- $277,569
- List price
- $275,000
- Delta
- -0.93%
- Verdict
- FAIR
- Comps
- 6 within 1.0 mi
Show comp detail 1 sale within ~0.75 mi
| Address | Dist | Beds/Ba | Sqft | Sold | Price | $/sf | Match |
|---|---|---|---|---|---|---|---|
| 2903 Jerome St | 0.58mi | 2/2.0 (-1) | 1,196 (-8%) | 16mo | $136,900 | $114 | 41 |
Match score weights: distance 35% · size 25% · config 20% · recency 20%. Top-matched comps best support the ARV.
Projected returns pro-forma
-3.0% appreciation · 3.0% rent growth · sell at horizon
- IRR
- 0.6%
- Equity multiple
- 1.02×
- Total profit
- $1,651
- Equity at exit
- $41,003
- IRR
- 10.2%
- Equity multiple
- 1.79×
- Total profit
- $60,721
- Equity at exit
- $23,777
Cash invested: $77,000 (down + closing). Projections, not guarantees.
Landlord ↔ Tenant lean methodology
- Overall (STATE)
- 87 Strongly Landlord-Friendly
- State Texas
- 87 Strongly Landlord-Friendly · R+5
- County
- — inherits STATE
- City
- — inherits STATE
ZIP-level market 75223
- Home prices YoY
- -24.6%
- Active inventory
- 88
- Price-to-rent
- 22.4×
Monthly cashflow live
- Estimated rent
- $3,065 medium interval (Pro) →
- Mortgage (P&I)
- −$1,442
- Tax from tax record
- −$138 /mo · $1,654/yr
- Insurance
- −$115
- HOA
- −$0
- Vacancy / Maint / Mgmt
- −$644
- Net cashflow
- $727
Break-even live
3-unit breakdown (identical units grouped — click to expand)
| Units | Beds | Baths | Est. rent |
|---|---|---|---|
| 3× units | 1 | 1 | $3,066 |
| #1 | 1 | 1 | $1,022 |
| #2 | 1 | 1 | $1,022 |
| #3 | 1 | 1 | $1,022 |
| Total (3 units) | $3,065 | ||
UW: 25.0% down · 7.5% · 30yr · 1.5% tax · 5.0% vac · 8.0% maint · 8.0% mgmt
Financing live
Cash to close
- Down payment
- $68,750
- Closing costs
- $8,250
- Reserves months
- —
- Total cash needed
- —
Loan-product check · same deal, 3 products live
Conventional
25% down · 7.5% · 30yr
- Down + closing
- —
- Monthly P&I
- —
- Monthly cashflow
- —
- DSCR
- —
- Eligible?
- —
Personal DTI + credit; lowest rate.
DSCR
20% down · 8.5% · 30yr
- Down + closing
- —
- Monthly P&I
- —
- Monthly cashflow
- —
- DSCR
- —
- Eligible?
- —
No personal income docs; deal must DSCR.
Hard money
10% down · 12.0% · 12mo
- Down + closing
- —
- Monthly P&I
- —
- Monthly cashflow
- —
- DSCR
- —
- Eligible?
- —
Short-term bridge; refi at stabilization.
Rent comps 40 comps
| Address | Beds | Baths | Sqft | Rent | $/sqft | DOM | Units | Dist |
|---|---|---|---|---|---|---|---|---|
| 4717 Owenwood Ave Dallas, TX | 3.0 | 2.0 | 1090 | $1,490 | $1.37 | 13d | 1 | 0.43mi |
| 4621 Collins Ave Dallas, TX | 4.0 | 2.5 | 1700 | $2,350 | $1.38 | 43d | 1 | 0.67mi |
| 4706 Spring Ave Dallas, TX | 3.0 | 2.0 | 1287 | $3,900 | $3.03 | 43d | 1 | 0.69mi |
| 4525 Metropolitan Ave Dallas, TX | 3.0 | 2.0 | 1090 | $1,490 | $1.37 | 13d | 1 | 0.73mi |
| 2720 Morning Ave Dallas, TX | 3.0 | 2.0 | 1332 | $2,350 | $1.76 | 43d | 1 | 0.96mi |
| 4303 Jamaica St Dallas, TX | 3.0 | 2.0 | 1027 | $1,375 | $1.34 | 6d | 1 | 0.97mi |
| 2724 Swanson St Dallas, TX | 4.0 | 2.0 | 1368 | $2,350 | $1.72 | 43d | 1 | 1.01mi |
| 2811 Morning Ave Dallas, TX | 3.0 | 2.0 | 1634 | $2,200 | $1.35 | 14d | 1 | 1.01mi |
| 4220 Hamilton Ave Dallas, TX | 4.0 | 2.0 | 1692 | $2,350 | $1.39 | 43d | 1 | 1.03mi |
| 1333 S Fitzhugh Ave Dallas, TX | 4.0 | 2.0 | 1670 | $1,895 | $1.13 | 7d | 1 | 1.04mi |
| 1514 Washington St Unit 105 Dallas, TX | 2.0 | 2.5 | 1404 | $2,950 | $2.10 | 7d | 1 | 1.12mi |
| 1006 Grandview Ave Dallas, TX | 3.0 | 1.0 | 1345 | $1,500 | $1.12 | 43d | 1 | 1.13mi |
| 4014 Marshall Dr Dallas, TX | 4.0 | 2.0 | 1600 | $1,850 | $1.16 | 24d | 1 | 1.17mi |
| 2670 Copper Breaks St Dallas, TX | 3.0 | 3.0 | 1816 | $2,990 | $1.65 | 43d | 1 | 1.22mi |
| 3311 Tooms St Dallas, TX | 3.0 | 1.5 | 1749 | $1,800 | $1.03 | 43d | 1 | 1.22mi |
| 5724 Rich St Dallas, TX | 3.0 | 1.0 | 1608 | $1,760 | $1.09 | 2d | 1 | 1.24mi |
| 4704 Craymore Rd Dallas, TX | 3.0 | 2.5 | 1670 | $2,649 | $1.59 | 4d | 1 | 1.26mi |
| 3801 Carpenter Ave Dallas, TX | 4.0 | 2.0 | 1454 | $2,400 | $1.65 | 43d | 1 | 1.27mi |
| 2354 Little Pocket Rd Unit B Dallas, TX | 2.0 | 2.5 | 1384 | $1,275 | $0.92 | 4d | 1 | 1.28mi |
| 7506 Edgeware Rd Dallas, TX | 3.0 | 2.5 | 1620 | $2,419 | $1.49 | 16d | 1 | 1.30mi |
| 3726 Copeland St Dallas, TX | 3.0 | 2.0 | 1298 | $1,690 | $1.30 | 6d | 1 | 1.31mi |
| 7513 Laburnam Rd Dallas, TX | 3.0 | 2.5 | 1617 | $2,700 | $1.67 | 43d | 1 | 1.32mi |
| 7513 Laburnam Rd Dallas, TX | 3.0 | 2.5 | 1617 | $2,700 | $1.67 | 7d | 1 | 1.32mi |
| 5110 Lindsley Ave Dallas, TX | 2.0 | 2.0 | 1340 | $2,400 | $1.79 | 43d | 1 | 1.32mi |
| 3402 Lawnview Ave Dallas, TX | 3.0 | 2.0 | 1550 | $1,795 | $1.16 | 43d | 1 | 1.35mi |
| 3402 Lawnview Ave Dallas, TX | 3.0 | 2.0 | 1500 | $1,700 | $1.13 | 24d | 1 | 1.35mi |
| 7503 Millingston Rd Dallas, TX | 3.0 | 2.5 | 1650 | $2,900 | $1.76 | 3d | 1 | 1.35mi |
| 616 Wayne St Dallas, TX | 3.0 | 2.0 | 1224 | $2,395 | $1.96 | 43d | 1 | 1.35mi |
| 6028 Fairway Ave Dallas, TX | 2.0 | 2.0 | 1459 | $1,870 | $1.28 | 5d | 1 | 1.36mi |
| 2714 Hector St Dallas, TX | 3.0 | 2.0 | 1233 | $2,100 | $1.70 | 24d | 1 | 1.36mi |
| 3639 Pine St Dallas, TX | 3.0 | 2.0 | 1090 | $1,490 | $1.37 | 13d | 1 | 1.37mi |
| 7150 E Grand Ave Dallas, TX | 1.0–3.0 | 1.0–2.0 | 774 | $1,983 | $2.56 | 20d | 14 | 1.40mi |
| 709 S Munger Blvd Dallas, TX | 4.0 | 1.0 | 1610 | $2,100 | $1.30 | 7d | 1 | 1.41mi |
| 4942 Garland Ave Dallas, TX | 3.0 | 1.0 | 1058 | $1,600 | $1.51 | 24d | 1 | 1.42mi |
| 5214 Ash Ln Dallas, TX | 3.0 | 2.0 | 1207 | $2,200 | $1.82 | 43d | 1 | 1.43mi |
| 3523 Herrling St Dallas, TX | 3.0 | 2.0 | 1525 | $1,800 | $1.18 | 16d | 1 | 1.45mi |
| 4918 Garland Ave Dallas, TX | 3.0 | 2.5 | 1725 | $2,500 | $1.45 | 24d | 1 | 1.45mi |
| 7526 Hunnicut Rd Dallas, TX | 1.0–2.0 | 1.0–2.0 | 865 | $1,400 | $1.62 | 7d | 4 | 1.47mi |
| 3619 York St Dallas, TX | 3.0 | 2.0 | 1298 | $1,740 | $1.34 | 7d | 1 | 1.47mi |
| 6205 Lovett Ave Dallas, TX | 3.0 | 2.0 | 1000 | $1,699 | $1.70 | 14d | 1 | 1.49mi |
Listing history 28 events
-
2026-06-18days on market $275,000 Active 133 DOM
-
2026-06-17days on market $275,000 Active 132 DOM
-
2026-06-16days on market $275,000 Active 131 DOM
-
2026-06-15days on market $275,000 Active 130 DOM
-
2026-06-13days on market $275,000 Active 128 DOM
-
2026-06-09days on market $275,000 Active 124 DOM
-
2026-06-08days on market $275,000 Active 123 DOM
-
2026-06-07days on market $275,000 Active 122 DOM
-
2026-06-04days on market $275,000 Active 119 DOM
-
2026-06-03days on market $275,000 Active 118 DOM
-
2026-06-02days on market $275,000 Active 117 DOM
-
2026-06-02days on market $275,000 Active 116 DOM
-
2026-05-31days on market $275,000 Active 115 DOM
-
2026-02-20price $275,000 377-char remark
Show marketing remark (377 chars)
Priced to sell, this triplex offers a strong value-add opportunity in Dallas. Zoned commercial under Senate Bill 840, allowing multifamily development without rezoning, this property is ideal for investors or developers. Three 1-bedroom units in a single building with city water and sewer, offering flexibility for renovation, redevelopment, or long-term investment potential.
-
2026-02-05$295,000 Active 377-char remark
Show marketing remark (377 chars)
Priced to sell, this triplex offers a strong value-add opportunity in Dallas. Zoned commercial under Senate Bill 840, allowing multifamily development without rezoning, this property is ideal for investors or developers. Three 1-bedroom units in a single building with city water and sewer, offering flexibility for renovation, redevelopment, or long-term investment potential.
-
2025-09-05historical
-
2025-06-30status Active
-
2025-06-14status Pending
-
2025-06-05$225,000 Active
-
2025-04-18historical
-
2025-03-06price $265,000
-
2025-03-05status Active
-
2025-03-03status Pending
-
2025-02-18$395,000 Active
-
2024-02-21soldstatus
-
2004-09-28soldstatus
-
2004-07-22soldstatus
-
1997-08-12soldstatus $798
ⓘ Source: listings_history table (triggers on properties + properties_extension) + one-shot
backfill from property_details.listing_events for pre-trigger history.
Tax reassessment forecast TX · Resets to sale price
- Current annual tax
- $1,654 · $138/mo
- Projected year-2 tax
- $5,032 · $419/mo
- Expected delta
- +$3,379/yr (+$282/mo · 204.3%)
ⓘ Screening estimate from a state-policy table — verify with the county assessor before closing.
Climate risk First Street
- Flood 1/10 Low FEMA zone X (unshaded) · 0% chance over 30 yrs
- Wildfire 1/10 Low
- Heat 8/10 Severe 7 d/yr ≥109°F today · 26 d/yr by 30 yrs out
- Wind 6/10 Major 27% chance of damaging wind over 30 yrs
- Air quality 2/10 Low 2 unhealthy d/yr today · 2 by 30 yrs out
Nearby sold comps map
Loading sold comps map…
Walkable amenities ~0.75 mi
Loading nearby amenities…
Taxation est. · year 1
- Rental income
- $36,780
- − Mortgage interest
- −$15,404
- − Property taxes
- −$1,654
- − Insurance
- −$1,375
- − Repairs & maintenance
- −$2,942
- − Management
- −$2,942
- − Depreciation
- −$8,000
- Taxable income
- $4,462
- Est. tax owed @ 24.0%
- −$1,071
- After-tax cash flow
- $7,651/yr
For passive investors: Depreciation is non-cash, so a rental often shows a tax loss while cash-flowing — sheltering income. Rental losses are passive: they offset passive income freely, and up to $25,000/yr can offset ordinary (W-2) income if you actively participate and your MAGI is under $100k (phasing out to $0 by $150k); unused losses carry forward. On sale, claimed depreciation is recaptured at up to 25%, and gains may owe capital-gains tax (a 1031 exchange can defer both). Figures are a year-1 estimate at your 24.0% rate — not tax advice; consult a CPA.
Schools (NCES district)
- District
- Dallas ISD
- NCES district ID
- 4816230
- Math proficiency
- 31% ▼ -16.00%
- Reading proficiency
- 36% ▼ -4.00%
- Median HH income
- $42,881
- Composite
- 28.41/100
- National rank
- #6763
- State rank
- #559 of 826 in TX
Livability — Dallas
- Score
- 81/100
- State rank
- #24
- US rank
- #1380
Category grades
Schools grade is shown separately in the Schools card above.
Census & demographics
- Census place
- Dallas, TX
- County
- Dallas County · 2,612,404 people
- City population
- 1,168,437
- Metro
- Dallas-Fort Worth-Arlington, TX
- Population (ZIP)
- 11,994
- Household income
- $73,318
- Rent vs Own
- Severe rent burden
- 526.0
Population outlook (Dallas County) Hauer SSP2
- Today (2025)
- 2,979,839 people
- By 2030
- 3,191,823 · +7.1%
- By 2040
- 3,619,611 · +21.5%
- By 2050
- 4,026,915 · +35.1%
- By 2075
- 4,957,073 · +66.4%
- By 2100
- 5,508,725 · +84.9%
Race, ethnicity, and origin ACS 2023
- Neighborhood character
- Predominantly Hispanic (66%)
- Race & ethnicity
- Hispanic / Latino 66% Two or more races 19% White 18% Black 12% Asian 2%
- Hispanic origin (detail)
- Mexican 63% Dominican 1%
- Common ancestry
- Lithuanian 1% Portuguese 1% Slovak 1%
- Foreign-born
- 30% · Canada
- Languages at home
- 40% English-only · Spanish 59% Other Indo-European 1%
Political lean MEDSL · Dallas
- 2024 margin
- Strong D (+22.2) · D 60.2% · R 38.0% · Other 1.8%
- 2008→2024 swing
- +6.9pp toward D · 2008: 15.3pp · 2024: 22.2pp
- All cycles
- 2024: D+22.2 2020: D+31.6 2016: D+26.2 2012: D+15.4 2008: D+15.3
Not yet ingested
- Civics
- —
Market trends
- HPI YoY
- ▼ -121.38%
- Current HPI
- 372.672
- Rent YoY
- —
- Metro
- Dallas-Fort Worth-Arlington, TX
- State GDP YoY
- ▲ 3.95%
- F500 in state
- 110
Industry mix (Fortune 500 HQ in TX)
| Industry | F500 HQs | Revenue |
|---|---|---|
| Energy | 16 | $1,198B |
|
||
| Technology | 5 | $198B |
|
||
| Engineering / Construction | 4 | $72B |
|
||
| Energy Services | 3 | $60B |
|
||
| Utilities | 3 | $41B |
|
||
| Healthcare | 2 | $330B |
|
||
Price history
-30.4% since first listed15 events — show timeline
- 2026-02-20 Price Changed $275,000 NTREIS
- 2026-02-05 Listed $295,000 NTREIS
- 2025-09-05 Listing Removed — NTREIS
- 2025-06-30 Relisted — NTREIS
- 2025-06-14 Pending — NTREIS
- 2025-06-05 Listed $225,000 NTREIS
- 2025-04-18 Listing Removed — NTREIS
- 2025-03-06 Price Changed $265,000 NTREIS
- 2025-03-05 Relisted — NTREIS
- 2025-03-03 Pending — NTREIS
- 2025-02-18 Listed $395,000 NTREIS
- 2024-02-21 Sold (Public Records) — Public Records
- 2004-09-28 Sold (Public Records) — Public Records
- 2004-07-22 Sold (Public Records) — Public Records
- 1997-08-12 Sold (Public Records) $798 Public Records
Property tax history
+4.3%/yrLatest (2025): $1,654 · -53.9% YoY. Source: county tax records.
Cash-flow waterfall
monthlySold comps — $/sqft
last 12 mo · ≤1 miLoading sold comps…