 🏷️ Likely Rental
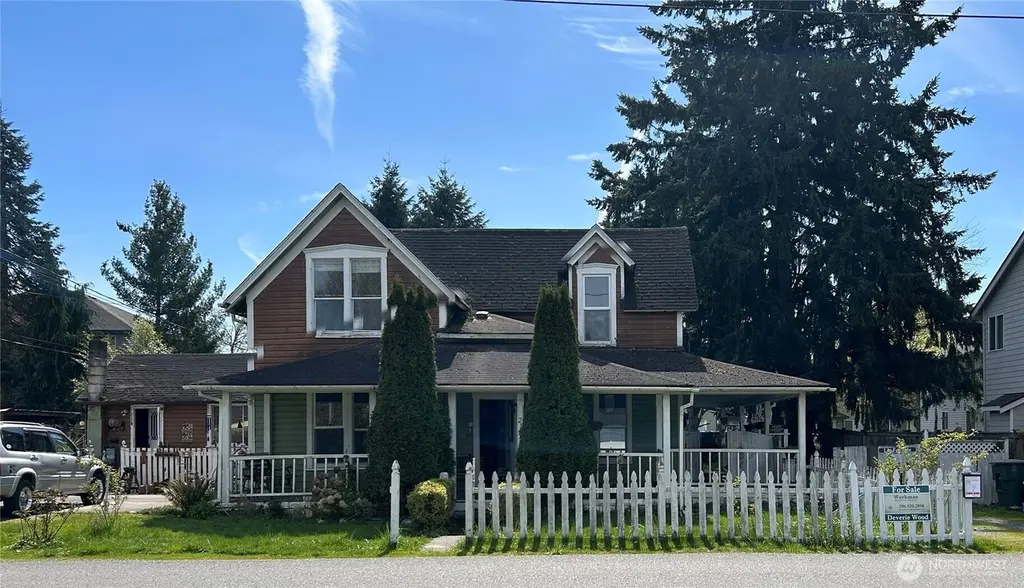
211 Seventh St · Snohomish, WA
Flood risk 1/10 · Minimal
- FEMA flood zone
- X (unshaded)
- Chance of flooding over 30 yrs
- 0.0%
- Est. flood insurance / yr
- $507 – $1,088
Fire risk 3/10 · Minor
- Est. fire insurance / yr
- $604 – $1,122
Heat risk 3/10 · Minor
- Hot days now (above 87°F)
- 7 days/yr
- Hot days in 30 yrs
- 15 days/yr
Wind risk 1/10 · Minimal
- Chance of severe wind over 30 yrs
- —
Air-quality risk 7/10 · Major
- Unhealthy air days now
- 9 days/yr
- Unhealthy air days in 30 yrs
- 11 days/yr
Risk factors via First Street. Map © Google.
Why this score? — see what drove the C- grade
The composite is a weighted blend of 9 inputs, each scored 0–100. Each bar is that input's sub-score; the figure is the points it added to the 100-point composite (weight × sub-score).
- ARV discount +15.0/15.0
- Cash flow +13.2/30.0
- Schools +5.9/10.0
- Rent growth +4.7/5.0
- DSCR +4.0/10.0
- Livability +3.9/5.0
- Condition / age +2.5/5.0
- 1% rule +2.4/10.0
- Appreciation +0.0/10.0
$500,000
🖨 Deal sheet 📄 Offer letter ✓ Due diligence
Listing remarks
NEW LOWERED PRICE! C1901 Farmhouse Centrally Located near the Master Planned Pilchuck District. Property is Zoned Low Density Multi-Family Residential. One block away from the Centennial Trail, near the Aquatic Center, Second Street. Four Bedrooms, 2.5 Bathrooms, and generous size Family room (Theater Room). Residential is 2497 SF. This Sale is AS IS, price lower already for needed repairs. Unit on the side has Kitchen, Family Room, Bath and one Bedroom for a tenant. The Vacant Lot in the back is a separate Listing, not part of this Listing for Sale. It is Lot 2 and has a separate Tax Number and listing number. (NWMLS# 2465264)
Key facts
- 8,276 sq ft lot
- Built 1901
- Listed 45 days
Tags
Neighborhood map
What this means for you Summary
Snapshot
- This is a 4-bed/2.5-bath single-family listed at $500k.
Deal economics
- At list price, monthly cash flow is $-11 ($-134/yr) — negative.
- To cash-flow at today's rent, offer at most $498k (0.4% below list).
- To meet the 1% rule (rent ≥ 1% of price), the offer needs to be $370k (26.0% below list).
- Recommended offer: $370k (26.0% below list) — sets the bar for 1% rule.
- Cap rate 6.3% vs local median 2.3% in Snohomish — top-decile yield for the area; either an underpriced asset or a hidden risk that comps aren't pricing in. Stress-test before assuming the spread holds.
Location & tenants
- Location reads 78/100 on livability (#120 in WA, #2,426 nationally) — a middle-class / working-renter tenant base. Strengths: health & safety A+, housing A, schools A-; Watch: amenities F, cost of living F.
- Snohomish School District (suburban): math 58% / reading 69% proficiency, ranked #25 of 291 in WA (top 9%) — acceptable for families but not a draw, mixed tenant base, ~2y average lease; only 18% free/reduced lunch — higher-income household profile.
- Market conditions: Rents rising fast (+8.8%/yr); 236 active listings in the ZIP; 3 comparable units currently listed for rent nearby; rentals at typical pace (median 24d on market — plan ~3-4 weeks tenant-placement turnaround); high-income renter base; 3,982 units permitted in Snohomish County in 2024 (1,492 in 5+ unit buildings).
- This rent runs 33% of the median local income ($133k/yr) — at the standard rent-burdened threshold; future hikes will face affordability resistance.
Forward outlook
- Local home prices are declining (-3.0%/yr); year-one equity from $3k of loan paydown is wiped out by about $15k of value loss. Plan a longer hold.
- Snohomish County population projected at +30% by 2050 — long-run rental-demand tailwind backs the buy-and-hold thesis.
Negotiation context
- It's been on market 45 days — a 3% lower offer ($485k) is reasonable based on typical stale-listing flexibility.
- 5 sale attempts since 22y ago; this cycle's ask has dropped $100k (17%) from the opening price — seller is motivated, your offer sets the floor, not the list.
Risks & watch-outs
- Watch-outs: built in 1901 — expect roof / HVAC / electrical / plumbing capex.
Questions for the listing agent
- What do current leases actually rent for vs. the listed asking? Can we see a recent rent roll and the last 12 months of T-12 income?
- It's been on market 45 days. Have you received any prior offers? Is the seller open to a 26% concession, seller financing, or rate buy-down credit?
- Built in 1901 — when were the roof, HVAC, electrical panel, plumbing, and water heater last replaced?
- Is there a deadline driving the sale (1031 exchange, divorce, estate, relocation)? That informs how much negotiation room exists.
- Schools are A-rated — typically a magnet for longer-tenancy family renters. What's the average tenant stay here, and is there a school-zone premium baked into asking?
- What's the average days-on-market for RENTAL listings here right now (not sales)? A rising rental-DOM trend means longer vacancies and softer asking-rent achievability than the comps imply.
- What's the recent tenant-quality profile in this submarket — average credit score on applications, eviction rate, late-payment / NSF rate, and stable-employment percentage? A property-management company in the area should have these aggregated.
- How much new for-sale + rental construction is in the pipeline within 1–3 miles? Heavy new supply typically softens prices + rents 12–24 months out; constrained supply supports both.
Investment metrics
- 1% rule
- 0.74% ✗
- Cap rate
- 6.27%
- Cash-on-cash
- -0.10%
- DSCR
- 1.00
- GRM
- 11.3
CMA / ARV
- ARV (median comp)
- $785,059
- List price
- $500,000
- Delta
- -36.31%
- Verdict
- UNDERPRICED
- Comps
- 20 within 1.0 mi
Show comp detail 12 sales within ~0.75 mi
| Address | Dist | Beds/Ba | Sqft | Sold | Price | $/sf | Match |
|---|---|---|---|---|---|---|---|
| 217 6TH St | 0.09mi | 4/1.5 | 2,346 (-6%) | 4mo | $840,000 | $358 | 79 |
| 8923 113th Dr SE | 0.40mi | 3/2.0 (-1) | 2,450 (-2%) | 6mo | $728,301 | $297 | 66 |
| 830 Mill Ave | 0.22mi | 4/2.5 | 2,138 (-14%) | 7mo | $842,500 | $394 | 60 |
| 817 Ford Ave | 0.22mi | 4/3.0 | 2,174 (-13%) | 9mo | $715,000 | $329 | 59 |
| 1310 Maple Ave | 0.60mi | 4/2.0 | 2,414 (-3%) | 8mo | $885,000 | $367 | 58 |
| 1302 Park Ave | 0.60mi | 5/2.0 (+1) | 2,457 (-2%) | 9mo | $712,000 | $290 | 55 |
| 502 Avenue C | 0.63mi | 4/3.0 | 2,244 (-10%) | 3mo | $1,025,000 | $457 | 49 |
| 1305 Lake view Ave | 0.61mi | 4/2.5 | 2,256 (-10%) | 8mo | $770,000 | $341 | 49 |
| 307 AVENUE C | 0.68mi | 4/2.0 | 2,772 (+11%) | 4mo | $1,095,000 | $395 | 45 |
| 303 AVENUE A | 0.58mi | 3/3.0 (-1) | 2,776 (+11%) | 3mo | $1,225,000 | $441 | 45 |
| 168 Pine Ave | 0.55mi | 3/1.5 (-1) | 2,208 (-12%) | 11mo | $850,000 | $385 | 37 |
| 322 AVENUE D | 0.75mi | 5/4.5 (+1) | 2,830 (+13%) | 6mo | $1,275,000 | $451 | 25 |
Match score weights: distance 35% · size 25% · config 20% · recency 20%. Top-matched comps best support the ARV.
Projected returns pro-forma
-3.0% appreciation · 8.0% rent growth · sell at horizon
- IRR
- -11.8%
- Equity multiple
- 0.55×
- Total profit
- $-62,432
- Equity at exit
- $74,552
- IRR
- 2.7%
- Equity multiple
- 1.23×
- Total profit
- $32,690
- Equity at exit
- $43,231
Cash invested: $140,000 (down + closing). Projections, not guarantees.
Landlord ↔ Tenant lean methodology
- Overall (STATE)
- 28 Tenant-Leaning
- State Washington
- 28 Tenant-Leaning · D+8
- County
- — inherits STATE
- City
- — inherits STATE
ZIP-level market 98290
- Rents YoY
- 8.8%
- Active inventory
- 236
- Price-to-rent
- 11.3×
Monthly cashflow live
- Estimated rent
- $3,702 medium interval (Pro) →
- Mortgage (P&I)
- −$2,622
- Tax from tax record
- −$105 /mo · $1,262/yr
- Insurance
- −$208
- HOA
- −$0
- Vacancy / Maint / Mgmt
- −$777
- Net cashflow
- $-11
Break-even live
UW: 25.0% down · 7.5% · 30yr · 1.5% tax · 5.0% vac · 8.0% maint · 8.0% mgmt
Financing live
Cash to close
- Down payment
- $125,000
- Closing costs
- $15,000
- Reserves months
- —
- Total cash needed
- —
Loan-product check · same deal, 3 products live
Conventional
25% down · 7.5% · 30yr
- Down + closing
- —
- Monthly P&I
- —
- Monthly cashflow
- —
- DSCR
- —
- Eligible?
- —
Personal DTI + credit; lowest rate.
DSCR
20% down · 8.5% · 30yr
- Down + closing
- —
- Monthly P&I
- —
- Monthly cashflow
- —
- DSCR
- —
- Eligible?
- —
No personal income docs; deal must DSCR.
Hard money
10% down · 12.0% · 12mo
- Down + closing
- —
- Monthly P&I
- —
- Monthly cashflow
- —
- DSCR
- —
- Eligible?
- —
Short-term bridge; refi at stabilization.
Rent comps 3 comps
| Address | Beds | Baths | Sqft | Rent | $/sqft | DOM | Units | Dist |
|---|---|---|---|---|---|---|---|---|
| 950 Maple Ave Unit A Snohomish, WA | 3.0 | 3.5 | 1940 | $3,400 | $1.75 | 24d | 1 | 0.27mi |
| Hwy 2 & hwy 9 Snohomish, WA | 4.0 | 2.0 | 2600 | $5,500 | $2.12 | 43d | 1 | 0.82mi |
| 1701 Moran Ave Snohomish, WA | 4.0 | 2.5 | 1878 | $3,550 | $1.89 | 18d | 1 | 0.94mi |
Listing history 18 events
-
2026-05-19status Pending
-
2026-05-01price $500,000
-
2026-04-14price $225,000
-
2026-04-03$600,000 Active
-
2026-03-25price $230,000
-
2026-01-05$250,000 Active
-
2020-02-05soldstatus $458,000 Sold
-
2020-02-05soldstatus $458,000
-
2019-01-12status Pending
-
2018-10-01price $458,000
-
2018-07-12$465,000 Active
-
2004-09-28soldstatus $239,950
-
2004-08-26soldstatus $247,950
-
2004-08-26soldstatus $247,950
-
2004-06-02$239,950
-
2004-06-02$239,950
-
1999-12-16soldstatus $179,950
-
1995-11-17soldstatus $177,000
ⓘ Source: listings_history table (triggers on properties + properties_extension) + one-shot
backfill from property_details.listing_events for pre-trigger history.
Tax reassessment forecast WA · Resets to sale price
- Current annual tax
- $1,262 · $105/mo
- Projected year-2 tax
- $4,900 · $408/mo
- Expected delta
- +$3,638/yr (+$303/mo · 288.4%)
ⓘ Screening estimate from a state-policy table — verify with the county assessor before closing.
Climate risk First Street
- Flood 1/10 Low FEMA zone X (unshaded) · 0% chance over 30 yrs
- Wildfire 3/10 Moderate
- Heat 3/10 Moderate 7 d/yr ≥87°F today · 15 d/yr by 30 yrs out
- Wind 1/10 Low
- Air quality 7/10 Severe 9 unhealthy d/yr today · 11 by 30 yrs out
Nearby sold comps map
Loading sold comps map…
Walkable amenities ~0.75 mi
Loading nearby amenities…
Taxation est. · year 1
- Rental income
- $44,421
- − Mortgage interest
- −$28,008
- − Property taxes
- −$1,262
- − Insurance
- −$2,500
- − Repairs & maintenance
- −$3,554
- − Management
- −$3,554
- − Depreciation
- −$14,545
- Taxable loss
- −$9,001
- Est. tax savings @ 24.0%
- +$2,160
- After-tax cash flow
- $2,027/yr
For passive investors: Depreciation is non-cash, so a rental often shows a tax loss while cash-flowing — sheltering income. Rental losses are passive: they offset passive income freely, and up to $25,000/yr can offset ordinary (W-2) income if you actively participate and your MAGI is under $100k (phasing out to $0 by $150k); unused losses carry forward. On sale, claimed depreciation is recaptured at up to 25%, and gains may owe capital-gains tax (a 1031 exchange can defer both). Figures are a year-1 estimate at your 24.0% rate — not tax advice; consult a CPA.
Schools (NCES district)
- District
- Snohomish School District
- NCES district ID
- 5308020
- Math proficiency
- 58% ▬ 0.00%
- Reading proficiency
- 69% ▲ 1.00%
- Median HH income
- $89,715
- Composite
- 59.21/100
- National rank
- #1934
- State rank
- #25 of 291 in WA
Livability — Snohomish
- Score
- 78/100
- State rank
- #120
- US rank
- #2426
Category grades
Schools grade is shown separately in the Schools card above.
Census & demographics
- Census place
- Snohomish, WA
- County
- Snohomish County · 786,756 people
- City population
- 39,826
- Metro
- Seattle-Tacoma-Bellevue, WA
- Population (ZIP)
- 39,826
- Household income
- $132,973
- Rent vs Own
- Severe rent burden
- 522.0
Population outlook (Snohomish County) Hauer SSP2
- Today (2025)
- 899,800 people
- By 2030
- 960,975 · +6.8%
- By 2040
- 1,074,447 · +19.4%
- By 2050
- 1,171,954 · +30.2%
- By 2075
- 1,384,849 · +53.9%
- By 2100
- 1,497,296 · +66.4%
Race, ethnicity, and origin ACS 2023
- Neighborhood character
- Predominantly White (82%)
- Race & ethnicity
- White 82% Two or more races 9% Hispanic / Latino 7% Asian 3%
- Hispanic origin (detail)
- Mexican 5%
- Common ancestry
- Portuguese 7% Lithuanian 5% Italian 3%
- Foreign-born
- 7% · Canada, China
- Languages at home
- 91% English-only · Spanish 5% Other Asian/Pacific 1% Russian/Polish/Slavic 1%
Political lean MEDSL · Snohomish
- 2024 margin
- D (+19.0) · D 57.8% · R 38.9% · Other 3.3%
- 2008→2024 swing
- +0.1pp no change · 2008: 18.9pp · 2024: 19.0pp
- All cycles
- 2024: D+19.0 2020: D+20.6 2016: D+16.6 2012: D+16.2 2008: D+18.9
Not yet ingested
- Civics
- —
Market trends
- HPI YoY
- ▼ -751.01%
- Current HPI
- 338.6319
- Rent YoY
- ▲ 8.82%
- Metro
- Seattle-Tacoma-Bellevue, WA
- State GDP YoY
- ▲ 4.65%
- F500 in state
- 22
Industry mix (Fortune 500 HQ in WA)
| Industry | F500 HQs | Revenue |
|---|---|---|
| Retail | 2 | $269B |
|
||
| Technology / Retail | 1 | $638B |
|
||
| Technology | 1 | $245B |
|
||
| Telecommunications | 1 | $38B |
|
||
| Food / Beverage | 1 | $36B |
|
||
| Automotive / Trucks | 1 | $34B |
|
||
Price history
+182.5% since first listed18 events — show timeline
- 2026-05-19 Pending — NWMLS as Distributed by MLS Grid
- 2026-05-01 Price Changed $500,000 NWMLS as Distributed by MLS Grid
- 2026-04-14 Price Changed $225,000 NWMLS as Distributed by MLS Grid
- 2026-04-03 Listed $600,000 NWMLS as Distributed by MLS Grid
- 2026-03-25 Price Changed $230,000 NWMLS as Distributed by MLS Grid
- 2026-01-05 Listed $250,000 NWMLS as Distributed by MLS Grid
- 2020-02-05 Sold (Public Records) $458,000 Public Records
- 2020-02-05 Sold (MLS) $458,000 NWMLS as Distributed by MLS Grid
- 2019-01-12 Pending — NWMLS as Distributed by MLS Grid
- 2018-10-01 Price Changed $458,000 NWMLS as Distributed by MLS Grid
- 2018-07-12 Listed $465,000 NWMLS as Distributed by MLS Grid
- 2004-09-28 Sold (MLS) $239,950 NWMLS as Distributed by MLS Grid
- 2004-08-26 Sold (Public Records) $247,950 Public Records
- 2004-08-26 Sold (MLS) $247,950 NWMLS as Distributed by MLS Grid
- 2004-06-02 Listed $239,950 NWMLS as Distributed by MLS Grid
- 2004-06-02 Listed $239,950 NWMLS as Distributed by MLS Grid
- 1999-12-16 Sold (Public Records) $179,950 Public Records
- 1995-11-17 Sold (Public Records) $177,000 Public Records
Property tax history
-5.6%/yrLatest (2026): $1,262 · -79.9% YoY. Source: county tax records.
Cash-flow waterfall
monthlySold comps — $/sqft
last 12 mo · ≤1 miLoading sold comps…