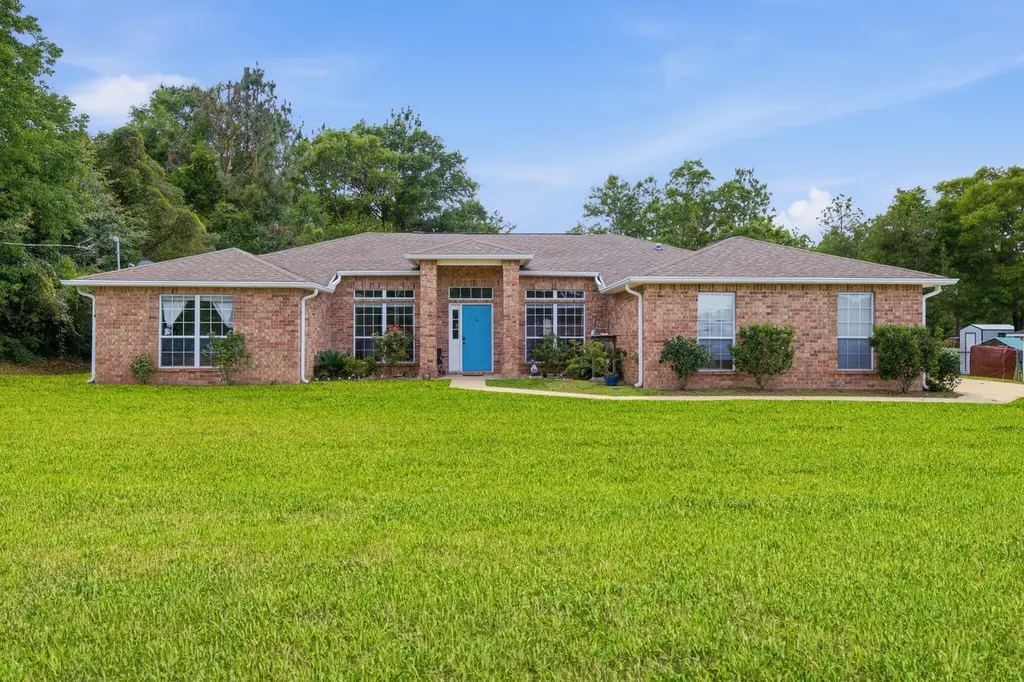
6204 Flash Ln · Crestview, FL
Flood risk 1/10 · Minimal
- FEMA flood zone
- X (unshaded)
- Chance of flooding over 30 yrs
- 0.0%
- Est. flood insurance / yr
- $507 – $1,088
Fire risk 5/10 · Moderate
- Est. fire insurance / yr
- $947 – $1,759
Heat risk 9/10 · Severe
- Hot days now (above 107°F)
- 7 days/yr
- Hot days in 30 yrs
- 20 days/yr
Wind risk 9/10 · Severe
- Chance of severe wind over 30 yrs
- 99.0%
Air-quality risk 2/10 · Minimal
- Unhealthy air days now
- 1 days/yr
- Unhealthy air days in 30 yrs
- 1 days/yr
Risk factors via First Street. Map © Google.
Why this score? — see what drove the D+ grade
The composite is a weighted blend of 9 inputs, each scored 0–100. Each bar is that input's sub-score; the figure is the points it added to the 100-point composite (weight × sub-score).
- ARV discount +14.5/15.0
- Cash flow +11.4/30.0
- Schools +5.2/10.0
- Livability +3.8/5.0
- DSCR +3.3/10.0
- Rent growth +2.8/5.0
- 1% rule +2.5/10.0
- Condition / age +2.5/5.0
- Appreciation +0.0/10.0
$299,900
🖨 Deal sheet 📄 Offer letter ✓ Due diligence
Listing remarks MLS
*Multiple offers, highest and best due by 5/7 at 2pm* This beautiful 4 bedroom home features a formal dining AND office! Tons of space and a football field of a backyard. This one is ready to call HOME! Wood look flooring and tile in main areas! The kitchen has granite countertops, including a prep island. Stainless steel appliances and a large, corner pantry. The master bedroom is private and features an updated master bathroom. Large walk in tile shower with glass enclosure. Two walk in closets and plenty of extra storage. The backyard extends approx. 150 feet from back patio. Enjoy the fire pit area with plenty of trees and privacy. Vivant system will be removed prior to closing, water softener system is leased and negotiable.
Key facts
- Formal dining room
- Center prep island
- 0.64-acre lot
Tags
Property features AI
Finance
- HOA & community: Located in the Silver Springs Estates subdivision
Exterior
- Parking: Attached garage with 2 garage spaces; One additional driveway space; Garage door opener; Oversized garage
- Security: Smoke detectors
- Utilities: Electric service; Public water; Septic tank
- Home design: Traditional single-story home; Built in 2007
- Construction: Frame and brick construction with vinyl siding and trim; Shingle roof; Slab foundation
- Exterior features: Open patio; Front porch; Cleared, level, interior lot; County road frontage on a paved road
Interior
- Kitchen: Kitchen with island
- Bedrooms: 4 bedrooms; Primary bedroom on the first floor with walk-in closet, tile shower, and double vanity
- Flooring: Laminate flooring; Tile flooring; Vinyl flooring
- Bathrooms: 2 full bathrooms
- Heating & cooling: Central heating; Central air conditioning; Ceiling fans
- Interior features: Vaulted ceilings; Kitchen island; Pantry; Built-in shelving; Split bedroom layout; Washer/dryer hookup; Window treatments
- Laundry & utility: Washer and dryer included; Washer/dryer hookup; Electric water heater
Neighborhood map
What this means for you Summary
Snapshot
- This is a 4-bed/2.0-bath single-family listed at $300k.
Deal economics
- At list price, monthly cash flow is $-104 ($-1k/yr) — negative.
- To cash-flow at today's rent, offer at most $282k (6.1% below list).
- To meet the 1% rule (rent ≥ 1% of price), the offer needs to be $224k (25.4% below list).
- Recommended offer: $224k (25.4% below list) — sets the bar for 1% rule.
- Cap rate 5.9% vs local median 4.4% in Crestview — top-decile yield for the area; either an underpriced asset or a hidden risk that comps aren't pricing in. Stress-test before assuming the spread holds.
Location & tenants
- Location reads 75/100 on livability (#252 in FL, #3,858 nationally) — a middle-class / working-renter tenant base. Strengths: cost of living A+, housing A+, health & safety A+; Watch: employment D, amenities F, commute F.
- Okaloosa (other): math 60% / reading 60% proficiency, ranked #12 of 73 in FL (top 16%) — acceptable for families but not a draw, mixed tenant base, ~2y average lease.
- Zoned schools: Bob Sikes Elementary School (math 53% / reading 60%, grade C+, #816 of 2,144 statewide, top 39%, 829 students, 52% FRL); Crestview High School (math 49% / reading 54%, grade D+, #167 of 667 statewide, top 25%, 2,315 students, 42% FRL).
- Market conditions: Rents rising (+1.2%/yr); 349 active listings in the ZIP; 8 comparable units currently listed for rent nearby; rentals lingering (median 44d on market — plan ~5-8 weeks vacancy on turnover, expect pricing pressure); 75% of comp listings sitting > 30 days — soft ceiling on asking rent; solid renter incomes; 1,268 units permitted in Okaloosa County in 2024 (175 in 5+ unit buildings).
- This rent runs 34% of the median local income ($78k/yr) — at the standard rent-burdened threshold; future hikes will face affordability resistance.
Forward outlook
- Local home prices are declining (-3.0%/yr); year-one equity from $2k of loan paydown is wiped out by about $9k of value loss. Plan a longer hold.
- Okaloosa County population projected at +37% by 2050 — long-run rental-demand tailwind backs the buy-and-hold thesis.
Negotiation context
- Only 8 days on market — expect competitive offers; lowballing is unlikely to land.
- 8 sale attempts since 19y ago with the ask held roughly flat each time — persistent listings suggest the price (not the market) is what's stuck; bring a comps-based counter.
Risks & watch-outs
- Climate carrying-cost: severe wind risk, 99% chance of damaging wind over 30y; moderate wildfire risk; extreme-heat days projected 7→20/yr by 2055 (HVAC capex compounding) — expect insurance premiums to compound above CPI over the hold.
Questions for the listing agent
- What do current leases actually rent for vs. the listed asking? Can we see a recent rent roll and the last 12 months of T-12 income?
- Is there a deadline driving the sale (1031 exchange, divorce, estate, relocation)? That informs how much negotiation room exists.
- Schools are B-rated — typically a magnet for longer-tenancy family renters. What's the average tenant stay here, and is there a school-zone premium baked into asking?
- The area grade is low — what's the realistic commute time and amenity access for the typical tenant pool here? Any planned neighborhood developments (good or bad) we should know about?
- What's the average days-on-market for RENTAL listings here right now (not sales)? A rising rental-DOM trend means longer vacancies and softer asking-rent achievability than the comps imply.
- What's the recent tenant-quality profile in this submarket — average credit score on applications, eviction rate, late-payment / NSF rate, and stable-employment percentage? A property-management company in the area should have these aggregated.
- How much new for-sale + rental construction is in the pipeline within 1–3 miles? Heavy new supply typically softens prices + rents 12–24 months out; constrained supply supports both.
Investment metrics
- 1% rule
- 0.75% ✗
- Cap rate
- 5.88%
- Cash-on-cash
- -1.48%
- DSCR
- 0.93
- GRM
- 11.2
CMA / ARV
- ARV (on-the-fly)
- $354,996
- Comps found
- 12
Show comp detail 12 sales within ~0.75 mi
| Address | Dist | Beds/Ba | Sqft | Sold | Price | $/sf | Match |
|---|---|---|---|---|---|---|---|
| 6404 Welannee Blvd | 0.55mi | 4/2.0 | 2,042 (-2%) | 8mo | $369,500 | $181 | 65 |
| 2509 S Lakeview Dr | 0.57mi | 3/2.0 (-1) | 2,098 (+1%) | 3mo | $300,000 | $143 | 64 |
| 2540 Taylor Rd | 0.66mi | 3/2.0 (-1) | 2,202 (+6%) | 6mo | $635,000 | $288 | 49 |
| 2450 Belmont Dr | 0.64mi | 4/2.0 | 1,856 (-11%) | 4mo | $329,900 | $178 | 49 |
| 2412 Cumberland Way | 0.68mi | 4/3.0 | 1,896 (-9%) | 2mo | $271,500 | $143 | 49 |
| 2460 Belmont Dr | 0.62mi | 5/3.0 (+1) | 2,107 (+2%) | 14mo | $359,900 | $171 | 48 |
| 2580 Taylor Road Rd | 0.55mi | 4/2.5 | 2,317 (+12%) | 11mo | $599,900 | $259 | 44 |
| 2458 Belmont Dr | 0.60mi | 4/2.0 | 1,856 (-11%) | 13mo | $331,900 | $179 | 44 |
| 2462 Belmont Dr | 0.61mi | 4/2.0 | 1,856 (-11%) | 14mo | $309,900 | $167 | 42 |
| 2410 Halfmoon Ln | 0.74mi | 4/2.0 | 2,235 (+8%) | 13mo | $350,000 | $157 | 42 |
| 2406 Cumberland Way | 0.75mi | 3/2.0 (-1) | 1,872 (-10%) | 3mo | $304,900 | $163 | 42 |
| 2480 S Lakeview Dr | 0.68mi | 3/2.0 (-1) | 1,834 (-12%) | 13mo | $275,000 | $150 | 33 |
Match score weights: distance 35% · size 25% · config 20% · recency 20%. Top-matched comps best support the ARV.
Projected returns pro-forma
-3.0% appreciation · 1.17% rent growth · sell at horizon
- IRR
- -20.6%
- Equity multiple
- 0.29×
- Total profit
- $-59,333
- Equity at exit
- $44,716
- IRR
- -18.1%
- Equity multiple
- 0.09×
- Total profit
- $-76,534
- Equity at exit
- $25,930
Cash invested: $83,972 (down + closing). Projections, not guarantees.
Landlord ↔ Tenant lean methodology
- Overall (STATE)
- 87 Strongly Landlord-Friendly
- State Florida
- 87 Strongly Landlord-Friendly · R+3
- County
- — inherits STATE
- City
- — inherits STATE
ZIP-level market 32536
- Home prices YoY
- -16.2%
- Rents YoY
- 1.2%
- Active inventory
- 349
- Price-to-rent
- 11.2×
Monthly cashflow live
- Estimated rent
- $2,237 high interval (Pro) →
- Mortgage (P&I)
- −$1,573
- Tax from tax record
- −$173 /mo · $2,080/yr
- Insurance
- −$125
- HOA
- −$0
- Vacancy / Maint / Mgmt
- −$470
- Net cashflow
- $-104
Break-even live
UW: 25.0% down · 7.5% · 30yr · 1.5% tax · 5.0% vac · 8.0% maint · 8.0% mgmt
Financing live
Cash to close
- Down payment
- $74,975
- Closing costs
- $8,997
- Reserves months
- —
- Total cash needed
- —
Loan-product check · same deal, 3 products live
Conventional
25% down · 7.5% · 30yr
- Down + closing
- —
- Monthly P&I
- —
- Monthly cashflow
- —
- DSCR
- —
- Eligible?
- —
Personal DTI + credit; lowest rate.
DSCR
20% down · 8.5% · 30yr
- Down + closing
- —
- Monthly P&I
- —
- Monthly cashflow
- —
- DSCR
- —
- Eligible?
- —
No personal income docs; deal must DSCR.
Hard money
10% down · 12.0% · 12mo
- Down + closing
- —
- Monthly P&I
- —
- Monthly cashflow
- —
- DSCR
- —
- Eligible?
- —
Short-term bridge; refi at stabilization.
Rent comps 8 comps
| Address | Beds | Baths | Sqft | Rent | $/sqft | DOM | Units | Dist |
|---|---|---|---|---|---|---|---|---|
| 2609 Corner Creek Rd Crestview, FL | 4.0 | 2.0 | 2098 | $2,100 | $1.00 | 43d | 1 | 0.11mi |
| 6231 Flash Ln Crestview, FL | 3.0 | 2.0 | 1673 | $1,900 | $1.14 | 13d | 1 | 0.27mi |
| 2624 Saltgrass Way Crestview, FL | 4.0 | 2.0 | 1747 | $1,895 | $1.08 | 43d | 1 | 1.02mi |
| 2631 Saltgrass Way Crestview, FL | 5.0 | 3.0 | 2012 | $2,195 | $1.09 | 43d | 1 | 1.03mi |
| 6381 Havenmist Ln Crestview, FL | 4.0 | 2.0 | 1844 | $1,900 | $1.03 | 43d | 1 | 1.28mi |
| 6008 Trestle St Crestview, FL | 4.0 | 2.5 | 2713 | $2,395 | $0.88 | 13d | 1 | 1.34mi |
| 6040 Trestle St Crestview, FL | 4.0 | 3.0 | 2395 | $2,300 | $0.96 | 43d | 1 | 1.35mi |
| 5810 Crestlake Dr Crestview, FL | 4.0 | 3.0 | 2313 | $2,350 | $1.02 | 43d | 1 | 1.48mi |
Listing history 7 events
-
2026-06-18days on market $299,900 Active 8 DOM
-
2026-06-17days on market $299,900 Active 7 DOM
-
2026-06-16days on market $299,900 Active 6 DOM
-
2026-06-15days on market $299,900 Active 5 DOM
-
2026-06-14days on market $299,900 Active 3 DOM
-
2026-06-13remarks 699-char remark
-
2026-06-13$299,900 Active 2 DOM
ⓘ Source: listings_history table (triggers on properties + properties_extension) + one-shot
backfill from property_details.listing_events for pre-trigger history.
Tax reassessment forecast FL · Resets to sale price
- Current annual tax
- $2,080 · $173/mo
- Projected year-2 tax
- $2,489 · $207/mo
- Expected delta
- +$409/yr (+$34/mo · 19.7%)
ⓘ Screening estimate from a state-policy table — verify with the county assessor before closing.
Climate risk First Street
- Flood 1/10 Low FEMA zone X (unshaded) · 0% chance over 30 yrs
- Wildfire 5/10 Major
- Heat 9/10 Extreme 7 d/yr ≥107°F today · 20 d/yr by 30 yrs out
- Wind 9/10 Extreme 99% chance of damaging wind over 30 yrs
- Air quality 2/10 Low 1 unhealthy d/yr today · 1 by 30 yrs out
Nearby sold comps map
Loading sold comps map…
Walkable amenities ~0.75 mi
Loading nearby amenities…
Taxation est. · year 1
- Rental income
- $26,846
- − Mortgage interest
- −$16,799
- − Property taxes
- −$2,080
- − Insurance
- −$1,500
- − Repairs & maintenance
- −$2,148
- − Management
- −$2,148
- − Depreciation
- −$8,724
- Taxable loss
- −$6,552
- Est. tax savings @ 24.0%
- +$1,573
- After-tax cash flow
- $329/yr
For passive investors: Depreciation is non-cash, so a rental often shows a tax loss while cash-flowing — sheltering income. Rental losses are passive: they offset passive income freely, and up to $25,000/yr can offset ordinary (W-2) income if you actively participate and your MAGI is under $100k (phasing out to $0 by $150k); unused losses carry forward. On sale, claimed depreciation is recaptured at up to 25%, and gains may owe capital-gains tax (a 1031 exchange can defer both). Figures are a year-1 estimate at your 24.0% rate — not tax advice; consult a CPA.
Schools (NCES district)
- District
- Okaloosa
- NCES district ID
- 1201380
- Math proficiency
- 60% ▼ -12.00%
- Reading proficiency
- 60% ▼ -4.00%
- Median HH income
- $55,601
- Composite
- 51.62/100
- National rank
- #1705
- State rank
- #12 of 73 in FL
Livability — Crestview
- Score
- 75/100
- State rank
- #252
- US rank
- #3858
Category grades
Schools grade is shown separately in the Schools card above.
Census & demographics
- County
- Okaloosa County · 194,352 people
- City population
- 58,889
- Metro
- Crestview-Fort Walton Beach-Destin, FL
- Population (ZIP)
- 25,599
- Household income
- $78,119
- Rent vs Own
- Severe rent burden
- 634.0
Population outlook (Okaloosa County) Hauer SSP2
- Today (2025)
- 235,133 people
- By 2030
- 253,483 · +7.8%
- By 2040
- 289,537 · +23.1%
- By 2050
- 322,954 · +37.3%
- By 2075
- 399,624 · +70.0%
- By 2100
- 425,311 · +80.9%
Race, ethnicity, and origin ACS 2023
- Neighborhood character
- Diverse neighborhood (Simpson 0.56)
- Race & ethnicity
- White 64% Black 16% Hispanic / Latino 12% Two or more races 9% Asian 3%
- Hispanic origin (detail)
- Mexican 4% Puerto Rican 2% Dominican 1%
- Common ancestry
- Lithuanian 2% Slovak 2% Italian 2%
- Foreign-born
- 6% · Canada, South Korea
- Languages at home
- 91% English-only · Spanish 7% Tagalog/Filipino 1%
Political lean MEDSL · Okaloosa
- 2024 margin
- Solid R (+42.4) · D 28.2% · R 70.7% · Other 1.1%
- 2008→2024 swing
- +2.5pp toward D · 2008: -44.9pp · 2024: -42.4pp
- All cycles
- 2024: R+42.4 2020: R+39.1 2016: R+47.8 2012: R+49.4 2008: R+44.9
Not yet ingested
- Civics
- —
Market trends
- HPI YoY
- ▼ -51.48%
- Current HPI
- 265.9926
- Rent YoY
- ▲ 1.17%
- Metro
- Crestview-Fort Walton Beach-Destin, FL
- State GDP YoY
- ▲ 3.28%
- F500 in state
- 36
Industry mix (Fortune 500 HQ in FL)
| Industry | F500 HQs | Revenue |
|---|---|---|
| Industrial Technology | 2 | $29B |
|
||
| Insurance | 2 | $17B |
|
||
| Retail | 1 | $60B |
|
||
| Technology Distribution | 1 | $58B |
|
||
| Homebuilding | 1 | $35B |
|
||
| Technology Manufacturing | 1 | $35B |
|
||
Price history
+59.5% since first listed19 events — show timeline
- 2026-06-10 Listed $299,900 ECAR
- 2022-06-14 Sold (Public Records) $320,000 Public Records
- 2022-06-14 Sold (MLS) $320,000 ECAR
- 2022-06-14 Sold (MLS) $320,000 NAMLS
- 2022-05-09 Pending — NAMLS
- 2022-05-09 Pending — ECAR
- 2022-05-05 Listed $299,000 NAMLS
- 2022-05-05 Listed $299,000 ECAR
- 2022-05-03 Coming Soon $299,000 NAMLS
- 2017-06-29 Sold (Public Records) $199,900 Public Records
- 2017-06-28 Sold (MLS) $199,900 NAMLS
- 2017-06-28 Sold (MLS) $199,900 ECAR
- 2017-03-17 Listed $199,900 NAMLS
- 2010-02-10 Listing Removed — NAMLS
- 2008-12-17 Listing Removed — NAMLS
- 2007-12-17 Listed $188,000 NAMLS
- 2007-12-17 Listed $188,000 NAMLS
- 2007-12-17 Listed $188,000 ECAR
- 2007-12-17 Listed $188,000 ECAR
Property tax history
+3.4%/yrLatest (2025): $2,080 · -9.9% YoY. Source: county tax records.
Cash-flow waterfall
monthlySold comps — $/sqft
last 12 mo · ≤1 miLoading sold comps…