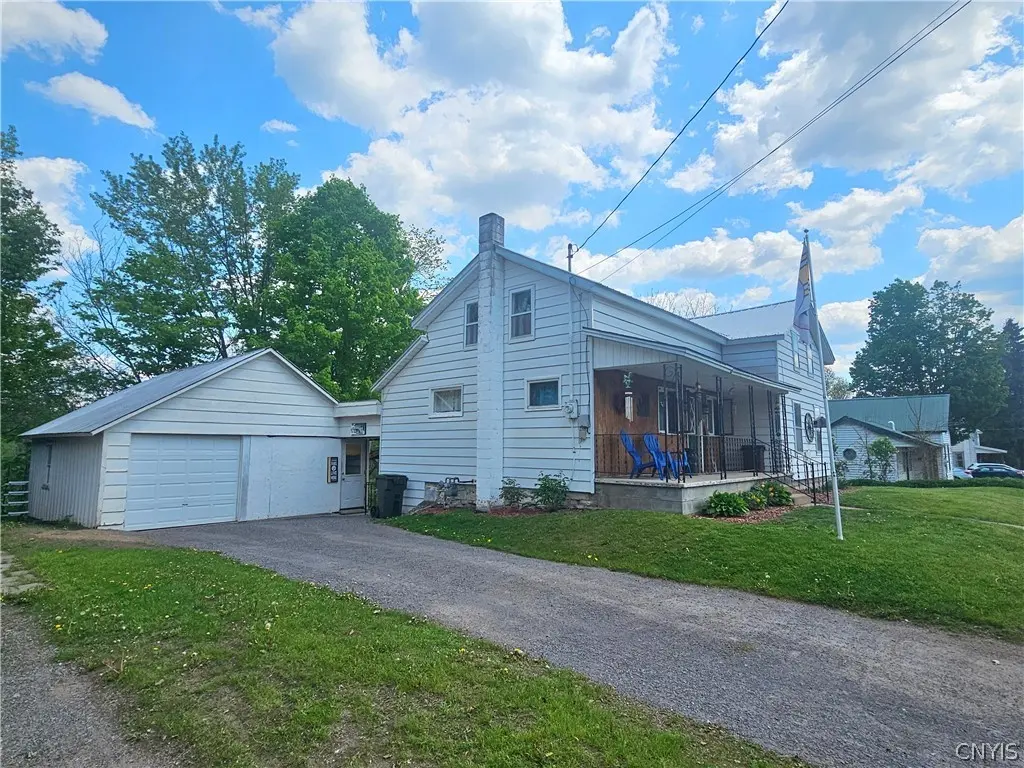
5505 River St · Lowville, NY
Flood risk 10/10 · Severe
- FEMA flood zone
- X
- Chance of flooding over 30 yrs
- 0.99%
- Est. flood insurance / yr
- $473 – $860
Fire risk 1/10 · Minimal
- Est. fire insurance / yr
- $691 – $1,283
Heat risk 1/10 · Minimal
- Hot days now (above 91°F)
- 7 days/yr
- Hot days in 30 yrs
- 17 days/yr
Wind risk 1/10 · Minimal
- Chance of severe wind over 30 yrs
- —
Air-quality risk 2/10 · Minimal
- Unhealthy air days now
- 0 days/yr
- Unhealthy air days in 30 yrs
- 1 days/yr
Risk factors via First Street. Map © Google.
Why this score? — see what drove the D+ grade
The composite is a weighted blend of 9 inputs, each scored 0–100. Each bar is that input's sub-score; the figure is the points it added to the 100-point composite (weight × sub-score).
- ARV discount +15.0/15.0
- Appreciation +10.0/10.0
- Cash flow +6.7/30.0
- Schools +4.5/10.0
- Livability +3.5/5.0
- Rent growth +2.5/5.0
- Condition / age +2.5/5.0
- 1% rule +1.8/10.0
- DSCR +0.9/10.0
$139,900
🖨 Deal sheet 📄 Offer letter ✓ Due diligence
Listing remarks
It has been wonderful to see this home transform from a property that stayed stagnant for many, many decades and now almost every detail has been addressed for you. The home has great curb appeal with fresh landscaping and the newly installed fence to keep animals and children secure as well as provide privacy. Lets talk about the generous space of this back yard!. .. and a see through fence to view the wildflowers. Upon entering from the covered front porch you will notice new laminate and carpeting as well as the freshly painted kitchen with enough room for the stackable washer/dryer around the corner and slightly out of sight. The living room is long and offers room to stretch with a bed
Key facts
- Covered front porch
- New laminate
- Curb appeal
Tags
Property features AI
Exterior
- Parking: Detached garage (1 car); Detached parking
- Utilities: Public water (connected); Sewer connected
- Home design: Single-story home; Resale property
- Construction: Aluminum siding; Stone foundation; Existing structure
- Exterior features: Fully fenced private yard; Covered patio/porch; Patio; Porch; Gravel driveway; See remarks
Interior
- Kitchen: Electric cooktop; Refrigerator
- Bedrooms: One bedroom on the main level
- Flooring: Carpet; Laminate; Varies
- Bathrooms: One full bathroom (main level)
- Heating & cooling: Gas forced-air heating
- Interior features: Eat-in kitchen; See remarks; Other
- Laundry & utility: Main-level laundry; Washer; Dryer; Gas water heater
Neighborhood map
What this means for you Summary
Snapshot
- This is a 2-bed/1.0-bath single-family listed at $140k.
Deal economics
- At list price, monthly cash flow is $-281 ($-3k/yr) — negative.
- To cash-flow at today's rent, offer at most $90k (35.4% below list).
- To meet the 1% rule (rent ≥ 1% of price), the offer needs to be $96k (31.5% below list).
- Recommended offer: $90k (35.4% below list) — sets the bar for cash-flow.
- Cap rate 4.4% vs local median 3.5% in Lowville — meaningfully above typical; check what's discounted (condition, days-on-market, listing class) to confirm the premium yield is real.
Location & tenants
- Location reads 69/100 on livability (#490 in NY) — a middle-class / working-renter tenant base. Strengths: cost of living A, schools A-, housing A-; Watch: health & safety D, amenities F, commute F.
- Lowville Academy & Central School District (town): math 51% / reading 54% proficiency, ranked #345 of 590 in NY (top 58%) — acceptable for families but not a draw, mixed tenant base, ~2y average lease.
- Market conditions: 45 active listings in the ZIP; 110 units permitted in Lewis County in 2024 (0 in 5+ unit buildings).
Forward outlook
- In year one you build about $15k of equity ($967 loan paydown + $14k appreciation (10.0% local appreciation)).
- Lewis County population projected at -20% by 2050 — secular population decline; favor cash flow + early exit over multi-decade hold.
- By year 3, paydown + projected appreciation supports a ~$38k cash-out refi (75% LTV) — recoverable capital for the next deal without selling this one.
Negotiation context
- It's been on market 32 days — a 3% lower offer ($136k) is reasonable based on typical stale-listing flexibility.
- 3 sale attempts since 3y ago; this cycle's ask has dropped $10k (7%) from the opening price — seller is motivated, your offer sets the floor, not the list.
- Current owner paid $85k; list at $140k implies a 65% gain — meaningful room to come down on a strong offer.
Risks & watch-outs
- Watch-outs: flood insurance adds $56/mo; built in 1890 — expect roof / HVAC / electrical / plumbing capex.
- Climate carrying-cost: severe flood risk — expect insurance premiums to compound above CPI over the hold.
Questions for the listing agent
- What do current leases actually rent for vs. the listed asking? Can we see a recent rent roll and the last 12 months of T-12 income?
- It's been on market 32 days. Have you received any prior offers? Is the seller open to a 35% concession, seller financing, or rate buy-down credit?
- Built in 1890 — when were the roof, HVAC, electrical panel, plumbing, and water heater last replaced?
- What's the actual annual flood-insurance premium (NFIP or private), and is the property in a SFHA with mandatory coverage?
- Is there a deadline driving the sale (1031 exchange, divorce, estate, relocation)? That informs how much negotiation room exists.
- Schools are A-rated — typically a magnet for longer-tenancy family renters. What's the average tenant stay here, and is there a school-zone premium baked into asking?
- The area grade is low — what's the realistic commute time and amenity access for the typical tenant pool here? Any planned neighborhood developments (good or bad) we should know about?
- What's the average days-on-market for RENTAL listings here right now (not sales)? A rising rental-DOM trend means longer vacancies and softer asking-rent achievability than the comps imply.
- What's the recent tenant-quality profile in this submarket — average credit score on applications, eviction rate, late-payment / NSF rate, and stable-employment percentage? A property-management company in the area should have these aggregated.
- How much new for-sale + rental construction is in the pipeline within 1–3 miles? Heavy new supply typically softens prices + rents 12–24 months out; constrained supply supports both.
Investment metrics
- 1% rule
- 0.68% ✗
- Cap rate
- 4.36%
- Cash-on-cash
- -6.90%
- DSCR
- 0.69
- GRM
- 12.2
CMA / ARV
- ARV (on-the-fly)
- $238,360
- Comps found
- 1
Show comp detail 1 sale within ~0.75 mi
| Address | Dist | Beds/Ba | Sqft | Sold | Price | $/sf | Match |
|---|---|---|---|---|---|---|---|
| 5621 Division St | 0.62mi | 3/1.0 (+1) | 1,040 (+3%) | 19mo | $245,000 | $236 | 46 |
Match score weights: distance 35% · size 25% · config 20% · recency 20%. Top-matched comps best support the ARV.
Projected returns pro-forma
10.0% appreciation · 3.0% rent growth · sell at horizon
- IRR
- 18.2%
- Equity multiple
- 2.49×
- Total profit
- $58,377
- Equity at exit
- $126,033
- IRR
- 17.0%
- Equity multiple
- 5.75×
- Total profit
- $186,081
- Equity at exit
- $271,795
Cash invested: $39,172 (down + closing). Projections, not guarantees.
Landlord ↔ Tenant lean methodology
- Overall (STATE)
- 15 Strongly Tenant-Friendly
- State New York
- 15 Strongly Tenant-Friendly · D+10
- County
- — inherits STATE
- City
- — inherits STATE
ZIP-level market 13367
- Home prices YoY
- 20.2%
- Active inventory
- 45
- Price-to-rent
- 12.2×
Monthly cashflow live
- Estimated rent
- $958 medium interval (Pro) →
- Mortgage (P&I)
- −$734
- Tax from tax record
- −$190 /mo · $2,278/yr
- Insurance
- −$58
- Flood insurance flood zone
- −$56 /mo · $666/yr
- HOA
- −$0
- Vacancy / Maint / Mgmt
- −$201
- Net cashflow
- $-281
Break-even live
UW: 25.0% down · 7.5% · 30yr · 1.5% tax · 5.0% vac · 8.0% maint · 8.0% mgmt
Financing live
Cash to close
- Down payment
- $34,975
- Closing costs
- $4,197
- Reserves months
- —
- Total cash needed
- —
Loan-product check · same deal, 3 products live
Conventional
25% down · 7.5% · 30yr
- Down + closing
- —
- Monthly P&I
- —
- Monthly cashflow
- —
- DSCR
- —
- Eligible?
- —
Personal DTI + credit; lowest rate.
DSCR
20% down · 8.5% · 30yr
- Down + closing
- —
- Monthly P&I
- —
- Monthly cashflow
- —
- DSCR
- —
- Eligible?
- —
No personal income docs; deal must DSCR.
Hard money
10% down · 12.0% · 12mo
- Down + closing
- —
- Monthly P&I
- —
- Monthly cashflow
- —
- DSCR
- —
- Eligible?
- —
Short-term bridge; refi at stabilization.
Listing history 22 events
-
2026-06-19days on market $139,900 Active 32 DOM
-
2026-06-18days on market $139,900 Active 31 DOM
-
2026-06-17days on market $139,900 Active 30 DOM
-
2026-06-16days on market $139,900 Active 29 DOM
-
2026-06-15days on market $139,900 Active 28 DOM
-
2026-06-14days on market $139,900 Active 26 DOM
-
2026-06-12pricedays on market $139,900 Active 25 DOM
-
2026-06-09days on market $145,000 Active 22 DOM
-
2026-06-08days on market $145,000 Active 21 DOM
-
2026-06-07pricedays on market $145,000 Active 20 DOM
-
2026-06-05days on market $150,000 Active 17 DOM
-
2026-06-03days on market $150,000 Active 16 DOM
-
2026-06-02days on market $150,000 Active 15 DOM
-
2026-06-01days on market $150,000 Active 14 DOM
-
2026-05-31days on market $150,000 Active 13 DOM
-
2026-05-30days on market $150,000 Active 12 DOM
-
2026-05-18$150,000 Active
-
2023-05-19$80,000 Active
-
2023-05-19soldstatus $85,000 Closed Sale or Rented
-
2023-05-19$80,000 Active
-
2023-05-19soldstatus $85,000
-
2023-05-12soldstatus $85,000 Closed Sale or Rented
ⓘ Source: listings_history table (triggers on properties + properties_extension) + one-shot
backfill from property_details.listing_events for pre-trigger history.
Tax reassessment forecast NY · Partial reset (capped growth)
- Current annual tax
- $2,278 · $190/mo
- Projected year-2 tax
- $2,321 · $193/mo
- Expected delta
- +$43/yr (+$4/mo · 1.9%)
ⓘ Screening estimate from a state-policy table — verify with the county assessor before closing.
Climate risk First Street
- Flood 10/10 Extreme FEMA zone X · 99% chance over 30 yrs
- Wildfire 1/10 Low
- Heat 1/10 Low 7 d/yr ≥91°F today · 17 d/yr by 30 yrs out
- Wind 1/10 Low
- Air quality 2/10 Low 0 unhealthy d/yr today · 1 by 30 yrs out
Nearby sold comps map
Loading sold comps map…
Walkable amenities ~0.75 mi
Loading nearby amenities…
Taxation est. · year 1
- Rental income
- $11,494
- − Mortgage interest
- −$7,837
- − Property taxes
- −$2,278
- − Insurance
- −$1,366
- − Repairs & maintenance
- −$920
- − Management
- −$920
- − Depreciation
- −$4,070
- Taxable loss
- −$5,896
- Est. tax savings @ 24.0%
- +$1,415
- After-tax cash flow
- $-1,953/yr
For passive investors: Depreciation is non-cash, so a rental often shows a tax loss while cash-flowing — sheltering income. Rental losses are passive: they offset passive income freely, and up to $25,000/yr can offset ordinary (W-2) income if you actively participate and your MAGI is under $100k (phasing out to $0 by $150k); unused losses carry forward. On sale, claimed depreciation is recaptured at up to 25%, and gains may owe capital-gains tax (a 1031 exchange can defer both). Figures are a year-1 estimate at your 24.0% rate — not tax advice; consult a CPA.
Schools (NCES district)
- District
- Lowville Academy & Central School District
- NCES district ID
- 3617820
- Math proficiency
- 51% ▼ -9.00%
- Reading proficiency
- 54% ▼ -7.00%
- Median HH income
- $47,554
- Composite
- 44.62/100
- National rank
- #2773
- State rank
- #345 of 590 in NY
Livability — Lowville
- Score
- 69/100
- State rank
- #490
- US rank
- #8619
Category grades
Schools grade is shown separately in the Schools card above.
Census & demographics
- Census place
- Lowville, NY
- Population (ZIP)
- 8,786
Population outlook (Lewis County) Hauer SSP2
- Today (2025)
- 26,126 people
- By 2030
- 25,354 · -3.0%
- By 2040
- 23,359 · -10.6%
- By 2050
- 20,927 · -19.9%
- By 2075
- 15,533 · -40.5%
- By 2100
- 10,215 · -60.9%
Race, ethnicity, and origin ACS 2023
- Neighborhood character
- Predominantly White (91%)
- Race & ethnicity
- White 91% Two or more races 5% Hispanic / Latino 4% Black 1%
- Common ancestry
- Lithuanian 9% Romanian 5% Iranian 2%
- Foreign-born
- 2% · Canada
- Languages at home
- 96% English-only · Spanish 3%
Political lean MEDSL · Lewis
- 2024 margin
- Solid R (+44.4) · D 27.8% · R 72.2%
- 2008→2024 swing
- -35.6pp toward R · 2008: -8.8pp · 2024: -44.4pp
- All cycles
- 2024: R+44.4 2020: R+39.2 2016: R+39.6 2012: R+8.7 2008: R+8.8
Not yet ingested
- Civics
- —
Market trends
- HPI YoY
- ▲ 49.81%
- Current HPI
- 296.4815
- Rent YoY
- —
- Metro
- —
- State GDP YoY
- ▲ 2.60%
- F500 in state
- 92
Industry mix (Fortune 500 HQ in NY)
| Industry | F500 HQs | Revenue |
|---|---|---|
| Financial Services | 10 | $950B |
|
||
| Consumer Goods | 9 | $162B |
|
||
| Insurance | 4 | $225B |
|
||
| Telecommunications | 2 | $144B |
|
||
| Pharmaceuticals | 2 | $112B |
|
||
| Media / Entertainment | 2 | $69B |
|
||
Price history
+76.5% since first listed6 events — show timeline
- 2026-05-18 Listed $150,000 CNYIS
- 2023-05-19 Listed $80,000 CNYIS
- 2023-05-19 Sold (Public Records) $85,000 Public Records
- 2023-05-19 Listed $80,000 CNYIS
- 2023-05-19 Sold (MLS) $85,000 CNYIS
- 2023-05-12 Sold (MLS) $85,000 CNYIS
Property tax history
+9.7%/yrLatest (2025): $2,278 · +5.8% YoY. Source: county tax records.
Cash-flow waterfall
monthlySold comps — $/sqft
last 12 mo · ≤1 miLoading sold comps…