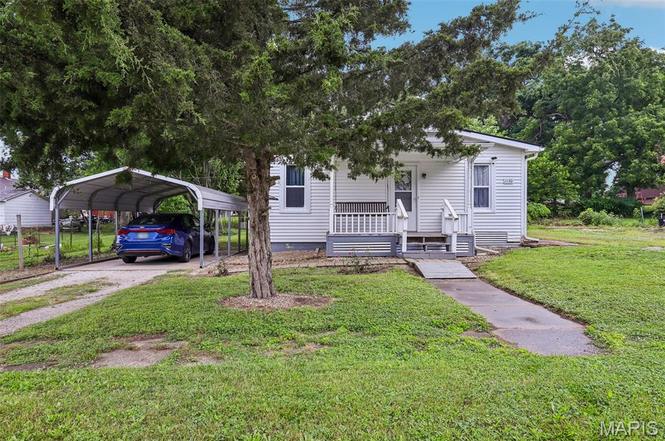
1130 Marshall St · Hillsboro, IL
Flood risk 1/10 · Minimal
- FEMA flood zone
- X
- Chance of flooding over 30 yrs
- 0.0%
- Est. flood insurance / yr
- $473 – $860
Fire risk 1/10 · Minimal
- Est. fire insurance / yr
- $804 – $1,492
Heat risk 4/10 · Minor
- Hot days now (above 107°F)
- 7 days/yr
- Hot days in 30 yrs
- 20 days/yr
Wind risk 2/10 · Minimal
- Chance of severe wind over 30 yrs
- 2.0%
Air-quality risk 3/10 · Minor
- Unhealthy air days now
- 2 days/yr
- Unhealthy air days in 30 yrs
- 3 days/yr
Risk factors via First Street. Map © Google.
Why this score? — see what drove the B- grade
The composite is a weighted blend of 9 inputs, each scored 0–100. Each bar is that input's sub-score; the figure is the points it added to the 100-point composite (weight × sub-score).
- Cash flow +27.8/30.0
- ARV discount +13.1/15.0
- DSCR +9.8/10.0
- 1% rule +7.0/10.0
- Livability +3.2/5.0
- Rent growth +2.5/5.0
- Condition / age +2.5/5.0
- Schools +2.4/10.0
- Appreciation +0.0/10.0
$79,900
🖨 Deal sheet 📄 Offer letter ✓ Due diligence
Listing remarks MLS
Cute bungalow home that is move in ready! Nice, open spaces lead into large kitchen with plenty of storage. Laundry area is located in the large bathroom. Rubber roof was replaced 15 years ago and front porch roof 7 years ago. Backyard is adjacent to Beckemeyer Elementary School walking track.
Key facts
- Spacious yard
- Covered carport
- Large kitchen
Tags
Property features AI
Finance
- Financial info: Lease not considered; Seller may consider concessions
Exterior
- Parking: Carport with space for 1 vehicle
- Utilities: Public water; Public sewer; Electric service by Ameren; Cable connected
- Home design: Single-family residence; One story
- Construction: Vinyl siding; Architectural shingle and flat roof
- Exterior features: Back yard; Porch; Shed(s)
Interior
- Kitchen: Kitchen on the main level (approximate dimension: 13 in width)
- Bedrooms: Two bedrooms on the main level (one approximately 13 x 11, the other approximately 12 x 10)
- Bathrooms: One full bathroom on the main level (approximately 10 x 6)
- Heating & cooling: Forced air heating; Central air conditioning
- Interior features: Living room (main) approximately 16 x 15; Dining room (main) approximately 14 x 10; Additional main-level room approximately 12 x 10; Porch
- Laundry & utility: Main-level laundry room (approximately 10 x 6)
Neighborhood map
What this means for you Summary
Snapshot
- This is a 2-bed/1.0-bath single-family listed at $80k.
Deal economics
- At list price, monthly cash flow is $244 ($3k/yr) — positive.
- The deal already cash-flows at list — no discount required.
- Meets the 1% rule at list price ($957 rent vs $80k).
Location & tenants
- Location reads 63/100 on livability (#768 in IL) — a middle-class / working-renter tenant base. Strengths: cost of living A+, housing A+, crime A; Watch: amenities F, commute F, health & safety F.
- Hillsboro CUSD 3 (town): math 20% / reading 36% proficiency, ranked #282 of 620 in IL (top 46%) — low school quality limits family demand, transient renter base, plan for 1-2y turnover.
- Zoned schools: Hillsboro High School (math 12% / reading 17%, grade F, #479 of 693 statewide, top 71%, 468 students, 0% FRL) — zoned schools average 0% FRL vs 44% district-wide (44 pts lower); this property's tenant base skews higher-income than the district average.
- Zoned-school proficiency averages 14% at this address vs 28% district-wide (-14 pts) — the specific schools serving this property underperform the Hillsboro CUSD 3 average; the district grade overstates school quality for this exact location.
- Market conditions: 16 active listings in the ZIP; 12 units permitted in Montgomery County in 2024 (0 in 5+ unit buildings).
Forward outlook
- Local home prices are declining (-3.0%/yr); year-one equity from $552 of loan paydown is wiped out by about $2k of value loss. Plan a longer hold.
- Montgomery County population projected at -20% by 2050 — secular population decline; favor cash flow + early exit over multi-decade hold.
- At projected returns (-3.0% appreciation + 3.0% rent growth), your $22k cash investment doubles in ~9 years — after that, you're playing with house money.
Negotiation context
- Only 1 days on market — expect competitive offers; lowballing is unlikely to land.
- 3 sale attempts since 5y ago with the ask held roughly flat each time — persistent listings suggest the price (not the market) is what's stuck; bring a comps-based counter.
- Current owner paid $17k; list at $80k implies a 370% gain — meaningful room to come down on a strong offer.
Risks & watch-outs
- Watch-outs: built in 1920 — expect roof / HVAC / electrical / plumbing capex.
Questions for the listing agent
- Built in 1920 — when were the roof, HVAC, electrical panel, plumbing, and water heater last replaced?
- Is there a deadline driving the sale (1031 exchange, divorce, estate, relocation)? That informs how much negotiation room exists.
- Schools are F-rated, which usually means shorter tenancies and higher turnover. Who's the typical renter profile here, and what's been the actual vacancy rate?
- What's the average days-on-market for RENTAL listings here right now (not sales)? A rising rental-DOM trend means longer vacancies and softer asking-rent achievability than the comps imply.
- What's the recent tenant-quality profile in this submarket — average credit score on applications, eviction rate, late-payment / NSF rate, and stable-employment percentage? A property-management company in the area should have these aggregated.
- How much new for-sale + rental construction is in the pipeline within 1–3 miles? Heavy new supply typically softens prices + rents 12–24 months out; constrained supply supports both.
Investment metrics
- 1% rule
- 1.20% ✓
- Cap rate
- 9.96%
- Cash-on-cash
- 13.10%
- DSCR
- 1.58
- GRM
- 7.0
CMA / ARV
- ARV (on-the-fly)
- $91,168
- Comps found
- 12
Show comp detail 12 sales within ~0.75 mi
| Address | Dist | Beds/Ba | Sqft | Sold | Price | $/sf | Match |
|---|---|---|---|---|---|---|---|
| 808 Smith Ln | 0.23mi | 2/1.0 | 1,000 (-4%) | 4mo | $110,000 | $110 | 80 |
| 217 W Fairground Ave | 0.23mi | 3/1.0 (+1) | 938 (-10%) | 0mo | $34,900 | $37 | 68 |
| 807 Kimball St | 0.25mi | 2/1.0 | 1,008 (-3%) | 18mo | $88,500 | $88 | 68 |
| 417 Hillside Ave | 0.17mi | 1/1.0 (-1) | 912 (-12%) | 1mo | $68,000 | $75 | 66 |
| 1324 Center St | 0.23mi | 2/1.0 | 1,103 (+6%) | 17mo | $87,000 | $79 | 64 |
| 803 Smith Ln | 0.20mi | 3/2.0 (+1) | 976 (-6%) | 9mo | $119,000 | $122 | 64 |
| 211 W Fairground Ave | 0.24mi | 3/1.0 (+1) | 976 (-6%) | 14mo | $73,500 | $75 | 63 |
| 1446 Vandalia Rd | 0.49mi | 2/1.0 | 988 (-5%) | 14mo | $63,000 | $64 | 58 |
| 631 Chase St | 0.59mi | 2/1.0 | 944 (-9%) | 5mo | $90,000 | $95 | 53 |
| 722 Yale Ave | 0.25mi | 3/1.5 (+1) | 1,189 (+15%) | 17mo | $159,000 | $134 | 42 |
| 631 Lakeview Dr | 0.64mi | 1/1.0 (-1) | 900 (-13%) | 7mo | $48,000 | $53 | 37 |
| 200 W Kinkead Rd | 0.46mi | 1/1.0 (-1) | 886 (-14%) | 19mo | $149,900 | $169 | 34 |
Match score weights: distance 35% · size 25% · config 20% · recency 20%. Top-matched comps best support the ARV.
Projected returns pro-forma
-3.0% appreciation · 3.0% rent growth · sell at horizon
- IRR
- 3.0%
- Equity multiple
- 1.12×
- Total profit
- $2,594
- Equity at exit
- $11,913
- IRR
- 12.6%
- Equity multiple
- 1.99×
- Total profit
- $22,242
- Equity at exit
- $6,908
Cash invested: $22,372 (down + closing). Projections, not guarantees.
Landlord ↔ Tenant lean methodology
- Overall (STATE)
- 43 Moderately Tenant-Leaning
- State Illinois
- 43 Moderately Tenant-Leaning · D+7
- County
- — inherits STATE
- City
- — inherits STATE
ZIP-level market 62049
- Home prices YoY
- -20.9%
- Active inventory
- 16
- Price-to-rent
- 7.0×
Monthly cashflow live
- Estimated rent
- $957 medium interval (Pro) →
- Mortgage (P&I)
- −$419
- Tax from tax record
- −$59 /mo · $713/yr
- Insurance
- −$33
- HOA
- −$0
- Vacancy / Maint / Mgmt
- −$201
- Net cashflow
- $244
Break-even live
UW: 25.0% down · 7.5% · 30yr · 1.5% tax · 5.0% vac · 8.0% maint · 8.0% mgmt
Financing live
Cash to close
- Down payment
- $19,975
- Closing costs
- $2,397
- Reserves months
- —
- Total cash needed
- —
Loan-product check · same deal, 3 products live
Conventional
25% down · 7.5% · 30yr
- Down + closing
- —
- Monthly P&I
- —
- Monthly cashflow
- —
- DSCR
- —
- Eligible?
- —
Personal DTI + credit; lowest rate.
DSCR
20% down · 8.5% · 30yr
- Down + closing
- —
- Monthly P&I
- —
- Monthly cashflow
- —
- DSCR
- —
- Eligible?
- —
No personal income docs; deal must DSCR.
Hard money
10% down · 12.0% · 12mo
- Down + closing
- —
- Monthly P&I
- —
- Monthly cashflow
- —
- DSCR
- —
- Eligible?
- —
Short-term bridge; refi at stabilization.
Listing history 2 events
-
2026-06-17remarks 699-char remark
-
2026-06-17$79,900 Active 1 DOM
ⓘ Source: listings_history table (triggers on properties + properties_extension) + one-shot
backfill from property_details.listing_events for pre-trigger history.
Tax reassessment forecast IL · Partial reset (capped growth)
- Current annual tax
- $713 · $59/mo
- Projected year-2 tax
- $1,263 · $105/mo
- Expected delta
- +$550/yr (+$46/mo · 77.2%)
ⓘ Screening estimate from a state-policy table — verify with the county assessor before closing.
Climate risk First Street
- Flood 1/10 Low FEMA zone X · 0% chance over 30 yrs
- Wildfire 1/10 Low
- Heat 4/10 Moderate 7 d/yr ≥107°F today · 20 d/yr by 30 yrs out
- Wind 2/10 Low 2% chance of damaging wind over 30 yrs
- Air quality 3/10 Moderate 2 unhealthy d/yr today · 3 by 30 yrs out
Nearby sold comps map
Loading sold comps map…
Walkable amenities ~0.75 mi
Loading nearby amenities…
Taxation est. · year 1
- Rental income
- $11,482
- − Mortgage interest
- −$4,476
- − Property taxes
- −$713
- − Insurance
- −$400
- − Repairs & maintenance
- −$919
- − Management
- −$919
- − Depreciation
- −$2,324
- Taxable income
- $1,732
- Est. tax owed @ 24.0%
- −$416
- After-tax cash flow
- $2,514/yr
For passive investors: Depreciation is non-cash, so a rental often shows a tax loss while cash-flowing — sheltering income. Rental losses are passive: they offset passive income freely, and up to $25,000/yr can offset ordinary (W-2) income if you actively participate and your MAGI is under $100k (phasing out to $0 by $150k); unused losses carry forward. On sale, claimed depreciation is recaptured at up to 25%, and gains may owe capital-gains tax (a 1031 exchange can defer both). Figures are a year-1 estimate at your 24.0% rate — not tax advice; consult a CPA.
Schools (NCES district)
- District
- Hillsboro CUSD 3
- NCES district ID
- 1719200
- Math proficiency
- 20% ▼ -4.00%
- Reading proficiency
- 36% ▼ -7.00%
- Median HH income
- $43,744
- Composite
- 23.89/100
- National rank
- #7794
- State rank
- #282 of 620 in IL
Livability — Hillsboro
- Score
- 63/100
- State rank
- #768
- US rank
- #15417
Category grades
Schools grade is shown separately in the Schools card above.
Census & demographics
- Census place
- Hillsboro, IL
- Population (ZIP)
- 8,078
Population outlook (Montgomery County) Hauer SSP2
- Today (2025)
- 27,471 people
- By 2030
- 26,410 · -3.9%
- By 2040
- 24,233 · -11.8%
- By 2050
- 21,948 · -20.1%
- By 2075
- 16,686 · -39.3%
- By 2100
- 11,369 · -58.6%
Race, ethnicity, and origin ACS 2023
- Neighborhood character
- Predominantly White (85%)
- Race & ethnicity
- White 85% Black 8% Hispanic / Latino 4% Two or more races 4%
- Common ancestry
- Slovak 4% Iranian 2% Italian 1%
- Foreign-born
- 1% · Canada
- Languages at home
- 96% English-only · Spanish 3%
Political lean MEDSL · Montgomery
- 2024 margin
- Solid R (+44.0) · D 27.1% · R 71.1% · Other 1.8%
- 2008→2024 swing
- -46.7pp toward R · 2008: 2.6pp · 2024: -44.0pp
- All cycles
- 2024: R+44.0 2020: R+41.0 2016: R+40.0 2012: R+14.2 2008: D+2.6
Not yet ingested
- Civics
- —
Market trends
- HPI YoY
- ▼ -51.47%
- Current HPI
- 195.1023
- Rent YoY
- —
- Metro
- —
- State GDP YoY
- ▲ 1.59%
- F500 in state
- 60
Industry mix (Fortune 500 HQ in IL)
| Industry | F500 HQs | Revenue |
|---|---|---|
| Insurance | 4 | $201B |
|
||
| Consumer Goods | 4 | $87B |
|
||
| Industrial Machinery | 3 | $64B |
|
||
| Healthcare | 2 | $55B |
|
||
| Retail / Pharmacy | 1 | $148B |
|
||
| Agriculture / Food | 1 | $86B |
|
||
Price history
+370.0% since first listed10 events — show timeline
- 2026-06-17 Listed $79,900 MARIS as Distributed by MLS Grid
- 2021-05-07 Sold (MLS) — MRED as Distributed by MLS Grid
- 2021-05-07 Sold (MLS) — MARIS as Distributed by MLS Grid
- 2021-05-06 Pending — MARIS as Distributed by MLS Grid
- 2021-05-06 Pending — MRED as Distributed by MLS Grid
- 2021-04-23 Pending — MRED as Distributed by MLS Grid
- 2021-03-30 Contingent — MARIS as Distributed by MLS Grid
- 2021-03-19 Listed $62,000 MARIS as Distributed by MLS Grid
- 2021-03-19 Listed $62,000 MRED as Distributed by MLS Grid
- 1998-05-01 Sold (Public Records) $17,000 Public Records
Property tax history
+11.2%/yrLatest (2024): $713 · +10.7% YoY. Source: county tax records.
Cash-flow waterfall
monthlySold comps — $/sqft
last 12 mo · ≤1 miLoading sold comps…