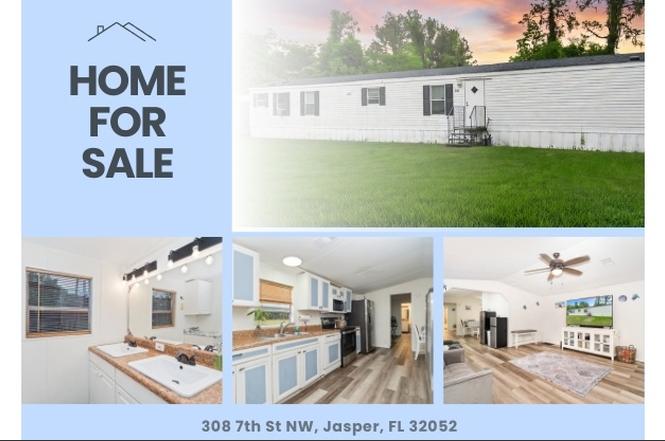
308 NW 7th St · Jasper, FL
Flood risk 1/10 · Minimal
- FEMA flood zone
- X (unshaded)
- Chance of flooding over 30 yrs
- 0.0%
- Est. flood insurance / yr
- $507 – $1,088
Fire risk 4/10 · Minor
- Est. fire insurance / yr
- $947 – $1,759
Heat risk 8/10 · Major
- Hot days now (above 107°F)
- 7 days/yr
- Hot days in 30 yrs
- 19 days/yr
Wind risk 9/10 · Severe
- Chance of severe wind over 30 yrs
- 99.0%
Air-quality risk 7/10 · Major
- Unhealthy air days now
- 14 days/yr
- Unhealthy air days in 30 yrs
- 16 days/yr
Risk factors via First Street. Map © Google.
Why this score? — see what drove the D grade
The composite is a weighted blend of 9 inputs, each scored 0–100. Each bar is that input's sub-score; the figure is the points it added to the 100-point composite (weight × sub-score).
- Cash flow +15.6/30.0
- Appreciation +8.3/10.0
- DSCR +4.8/10.0
- 1% rule +4.1/10.0
- Livability +3.2/5.0
- Schools +2.6/10.0
- Rent growth +2.5/5.0
- Condition / age +2.5/5.0
- ARV discount +0.0/15.0
$124,999
🖨 Deal sheet 📄 Offer letter ✓ Due diligence
Listing remarks MLS
This charming manufactured home offers a unique opportunity for affordable living in Jasper, FL and would make a great home for first time homebuyers. Situated on a spacious half-acre lot, this property provides ample space for gardening, outdoor activities, or potential expansion. Its convenient location near I-75 makes for easy travel to Georgia or south towards Lake City. Enjoy the benefits of living within the city limits of Jasper while experiencing the peace and quiet of a spacious lot. Roof 2024 and hot water heater 2024
Key facts
- Half-acre lot
- Split-floor-plan
- Updated water heater
Tags
Property features AI
Exterior
- Parking: 3-car garage
- Home design: Manufactured home; Residential property
- Construction: Frame construction; Shingle roof
- Exterior features: Deck; Shed(s)
Interior
- Kitchen: Dishwasher; Electric cooktop; Refrigerator; Microwave
- Flooring: Vinyl flooring
- Bathrooms: 2 full bathrooms
- Heating & cooling: Central heating (electric); Central air; Ceiling fans
- Interior features: Dishwasher; Electric cooktop; Refrigerator; Microwave
Neighborhood map
What this means for you Summary
Snapshot
- This is a 3-bed/2.0-bath manufactured listed at $125k.
Deal economics
- At list price, monthly cash flow is $53 ($642/yr) — positive.
- The deal already cash-flows at list — no discount required.
- To meet the 1% rule (rent ≥ 1% of price), the offer needs to be $114k (9.1% below list).
- Recommended offer: $114k (9.1% below list) — sets the bar for 1% rule.
- Cap rate 6.8% vs local median 3.4% in Jasper — top-decile yield for the area; either an underpriced asset or a hidden risk that comps aren't pricing in. Stress-test before assuming the spread holds.
Location & tenants
- Location reads 63/100 on livability (#731 in FL) — a middle-class / working-renter tenant base. Strengths: cost of living A+, housing B+; Watch: health & safety D, schools F, amenities F.
- Hamilton (rural): math 34% / reading 29% proficiency, ranked #68 of 73 in FL (top 93%) — families likely to look elsewhere, expect single-tenant / working-renter base with shorter leases; 72% free/reduced lunch — lower-income household profile, screen leases tightly.
- Market conditions: 85 active listings in the ZIP; 26 units permitted in Hamilton County in 2024 (0 in 5+ unit buildings).
Forward outlook
- In year one you build about $9k of equity ($864 loan paydown + $8k appreciation (6.7% local appreciation)).
- Hamilton County population projected at -12% by 2050 — secular population decline; favor cash flow + early exit over multi-decade hold.
- At projected returns (6.7% appreciation + 3.0% rent growth), your $35k cash investment doubles in ~4 years — after that, you're playing with house money.
- By year 4, paydown + projected appreciation supports a ~$32k cash-out refi (75% LTV) — recoverable capital for the next deal without selling this one.
Negotiation context
- Only 8 days on market — expect competitive offers; lowballing is unlikely to land.
- 9 sale attempts since 8y ago with the ask held roughly flat each time — persistent listings suggest the price (not the market) is what's stuck; bring a comps-based counter.
- Current owner paid $97k; 29% above their basis — modest negotiation headroom, anchor on the comps not their cost.
Risks & watch-outs
- Climate carrying-cost: severe wind risk, 99% chance of damaging wind over 30y; extreme-heat days projected 7→19/yr by 2055 (HVAC capex compounding) — expect insurance premiums to compound above CPI over the hold.
Questions for the listing agent
- Is there a deadline driving the sale (1031 exchange, divorce, estate, relocation)? That informs how much negotiation room exists.
- Schools are F-rated, which usually means shorter tenancies and higher turnover. Who's the typical renter profile here, and what's been the actual vacancy rate?
- The area grade is low — what's the realistic commute time and amenity access for the typical tenant pool here? Any planned neighborhood developments (good or bad) we should know about?
- What's the average days-on-market for RENTAL listings here right now (not sales)? A rising rental-DOM trend means longer vacancies and softer asking-rent achievability than the comps imply.
- What's the recent tenant-quality profile in this submarket — average credit score on applications, eviction rate, late-payment / NSF rate, and stable-employment percentage? A property-management company in the area should have these aggregated.
- How much new for-sale + rental construction is in the pipeline within 1–3 miles? Heavy new supply typically softens prices + rents 12–24 months out; constrained supply supports both.
Investment metrics
- 1% rule
- 0.91% ✗
- Cap rate
- 6.81%
- Cash-on-cash
- 1.83%
- DSCR
- 1.08
- GRM
- 9.2
CMA / ARV
- ARV (on-the-fly)
- $97,328
- Comps found
- 1
Show comp detail 1 sale within ~0.75 mi
| Address | Dist | Beds/Ba | Sqft | Sold | Price | $/sf | Match |
|---|---|---|---|---|---|---|---|
| 308 NW 7th St | 0.00mi | 3/2.0 | 1,232 (0%) | 14mo | $97,000 | $79 | 88 |
Match score weights: distance 35% · size 25% · config 20% · recency 20%. Top-matched comps best support the ARV.
Projected returns pro-forma
6.69% appreciation · 3.0% rent growth · sell at horizon
- IRR
- 18.5%
- Equity multiple
- 2.28×
- Total profit
- $44,666
- Equity at exit
- $84,075
- IRR
- 17.8%
- Equity multiple
- 4.65×
- Total profit
- $127,581
- Equity at exit
- $157,450
Cash invested: $35,000 (down + closing). Projections, not guarantees.
Landlord ↔ Tenant lean methodology
- Overall (STATE)
- 87 Strongly Landlord-Friendly
- State Florida
- 87 Strongly Landlord-Friendly · R+3
- County
- — inherits STATE
- City
- — inherits STATE
ZIP-level market 32052
- Home prices YoY
- 2.2%
- Active inventory
- 85
- Price-to-rent
- 9.2×
Monthly cashflow live
- Estimated rent
- $1,136 medium interval (Pro) →
- Mortgage (P&I)
- −$656
- Tax from tax record
- −$136 /mo · $1,633/yr
- Insurance
- −$52
- HOA
- −$0
- Vacancy / Maint / Mgmt
- −$238
- Net cashflow
- $53
Break-even live
UW: 25.0% down · 7.5% · 30yr · 1.5% tax · 5.0% vac · 8.0% maint · 8.0% mgmt
Financing live
Cash to close
- Down payment
- $31,250
- Closing costs
- $3,750
- Reserves months
- —
- Total cash needed
- —
Loan-product check · same deal, 3 products live
Conventional
25% down · 7.5% · 30yr
- Down + closing
- —
- Monthly P&I
- —
- Monthly cashflow
- —
- DSCR
- —
- Eligible?
- —
Personal DTI + credit; lowest rate.
DSCR
20% down · 8.5% · 30yr
- Down + closing
- —
- Monthly P&I
- —
- Monthly cashflow
- —
- DSCR
- —
- Eligible?
- —
No personal income docs; deal must DSCR.
Hard money
10% down · 12.0% · 12mo
- Down + closing
- —
- Monthly P&I
- —
- Monthly cashflow
- —
- DSCR
- —
- Eligible?
- —
Short-term bridge; refi at stabilization.
Listing history 8 events
-
2026-06-19days on market $124,999 Active 8 DOM
-
2026-06-18days on market $124,999 Active 7 DOM
-
2026-06-17days on market $124,999 Active 6 DOM
-
2026-06-16days on market $124,999 Active 5 DOM
-
2026-06-15days on market $124,999 Active 4 DOM
-
2026-06-14days on market $124,999 Active 2 DOM
-
2026-06-13remarks 699-char remark
-
2026-06-13$124,999 Active 1 DOM
ⓘ Source: listings_history table (triggers on properties + properties_extension) + one-shot
backfill from property_details.listing_events for pre-trigger history.
Tax reassessment forecast FL · Resets to sale price
- Current annual tax
- $1,633 · $136/mo
- Projected year-2 tax
- $1,633 · $136/mo
- Expected delta
- $0/yr ($0/mo · 0.0%)
ⓘ Screening estimate from a state-policy table — verify with the county assessor before closing.
Climate risk First Street
- Flood 1/10 Low FEMA zone X (unshaded) · 0% chance over 30 yrs
- Wildfire 4/10 Moderate
- Heat 8/10 Severe 7 d/yr ≥107°F today · 19 d/yr by 30 yrs out
- Wind 9/10 Extreme 99% chance of damaging wind over 30 yrs
- Air quality 7/10 Severe 14 unhealthy d/yr today · 16 by 30 yrs out
Nearby sold comps map
Loading sold comps map…
Walkable amenities ~0.75 mi
Loading nearby amenities…
Taxation est. · year 1
- Rental income
- $13,628
- − Mortgage interest
- −$7,002
- − Property taxes
- −$1,633
- − Insurance
- −$625
- − Repairs & maintenance
- −$1,090
- − Management
- −$1,090
- − Depreciation
- −$3,636
- Taxable loss
- −$1,449
- Est. tax savings @ 24.0%
- +$348
- After-tax cash flow
- $989/yr
For passive investors: Depreciation is non-cash, so a rental often shows a tax loss while cash-flowing — sheltering income. Rental losses are passive: they offset passive income freely, and up to $25,000/yr can offset ordinary (W-2) income if you actively participate and your MAGI is under $100k (phasing out to $0 by $150k); unused losses carry forward. On sale, claimed depreciation is recaptured at up to 25%, and gains may owe capital-gains tax (a 1031 exchange can defer both). Figures are a year-1 estimate at your 24.0% rate — not tax advice; consult a CPA.
Schools (NCES district)
- District
- Hamilton
- NCES district ID
- 1200720
- Math proficiency
- 34% ▼ -8.00%
- Reading proficiency
- 29% ▼ -6.00%
- Median HH income
- $36,461
- Composite
- 26.18/100
- National rank
- #7267
- State rank
- #68 of 73 in FL
Livability — Jasper
- Score
- 63/100
- State rank
- #731
- US rank
- #15678
Category grades
Schools grade is shown separately in the Schools card above.
Census & demographics
- Census place
- Jasper, FL
- Population (ZIP)
- 8,073
Population outlook (Hamilton County) Hauer SSP2
- Today (2025)
- 13,405 people
- By 2030
- 13,031 · -2.8%
- By 2040
- 12,385 · -7.6%
- By 2050
- 11,740 · -12.4%
- By 2075
- 9,347 · -30.3%
- By 2100
- 6,344 · -52.7%
Race, ethnicity, and origin ACS 2023
- Neighborhood character
- Diverse neighborhood (Simpson 0.58)
- Race & ethnicity
- White 55% Black 33% Hispanic / Latino 8% Two or more races 4%
- Hispanic origin (detail)
- Puerto Rican 2% Cuban 4%
- Common ancestry
- Romanian 2% Italian 1% Serbian 1%
- Foreign-born
- 5% · Canada
- Languages at home
- 88% English-only · Spanish 8% Russian/Polish/Slavic 2%
Political lean MEDSL · Hamilton
- 2024 margin
- Solid R (+39.0) · D 30.1% · R 69.1%
- 2008→2024 swing
- -24.4pp toward R · 2008: -14.6pp · 2024: -39.0pp
- All cycles
- 2024: R+39.0 2020: R+31.8 2016: R+28.2 2012: R+16.9 2008: R+14.6
Not yet ingested
- Civics
- —
Market trends
- HPI YoY
- ▲ 6.69%
- Current HPI
- 316.4797
- Rent YoY
- —
- Metro
- —
- State GDP YoY
- ▲ 3.28%
- F500 in state
- 36
Industry mix (Fortune 500 HQ in FL)
| Industry | F500 HQs | Revenue |
|---|---|---|
| Industrial Technology | 2 | $29B |
|
||
| Insurance | 2 | $17B |
|
||
| Retail | 1 | $60B |
|
||
| Technology Distribution | 1 | $58B |
|
||
| Homebuilding | 1 | $35B |
|
||
| Technology Manufacturing | 1 | $35B |
|
||
Price history
+130.6% since first listed25 events — show timeline
- 2026-06-11 Listed $124,999 NFMLS
- 2025-03-23 Contingent — NFMLS
- 2025-03-23 Sold (MLS) $97,000 NFMLS
- 2025-03-12 Price Changed $104,500 NFMLS
- 2025-02-02 Relisted — NFMLS
- 2025-01-31 Contingent — NFMLS
- 2024-12-28 Listed $105,000 NFMLS
- 2024-05-09 Price Changed $99,000 NFMLS
- 2024-04-24 Relisted — NFMLS
- 2024-04-10 Contingent — NFMLS
- 2024-03-27 Price Changed $105,000 NFMLS
- 2024-03-21 Price Changed $109,000 NFMLS
- 2024-01-25 Listed $110,000 NFMLS
- 2024-01-14 Listing Removed — Beaches MLS
- 2023-11-22 Price Changed $109,900 NFMLS
- 2023-11-21 Price Changed $109,900 Beaches MLS
- 2023-10-17 Price Changed $129,900 NFMLS
- 2023-10-17 Price Changed $129,900 Beaches MLS
- 2023-09-18 Listed $145,000 NFMLS
- 2023-09-18 Listed $145,000 Beaches MLS
- 2023-05-24 Sold (MLS) $50,000 NFMLS
- 2023-05-15 Listed $88,000 NFMLS
- 2019-08-21 Sold (MLS) $41,750 Stellar MLS as Distributed by MLS Grid
- 2018-11-01 Listed $43,500 Stellar MLS as Distributed by MLS Grid
- 2006-11-21 Sold (Public Records) $54,200 Public Records
Property tax history
+8.2%/yrLatest (2025): $1,633 · +5.8% YoY. Source: county tax records.
Cash-flow waterfall
monthlySold comps — $/sqft
last 12 mo · ≤1 miLoading sold comps…