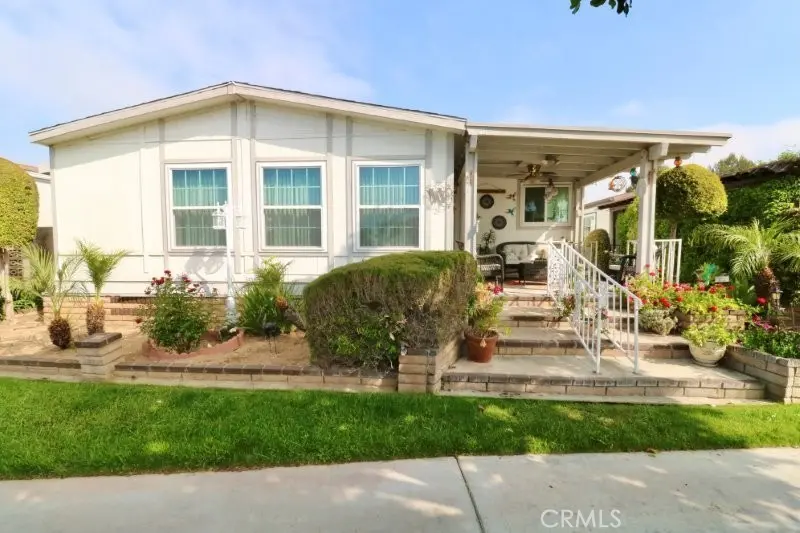
1346 Clear Lake Pl #70 · Brea, CA
Flood risk 1/10 · Minimal
- FEMA flood zone
- X (unshaded)
- Chance of flooding over 30 yrs
- 0.0%
- Est. flood insurance / yr
- $507 – $1,088
Fire risk 2/10 · Minimal
- Est. fire insurance / yr
- $659 – $1,223
Heat risk 6/10 · Moderate
- Hot days now (above 96°F)
- 7 days/yr
- Hot days in 30 yrs
- 22 days/yr
Wind risk 1/10 · Minimal
- Chance of severe wind over 30 yrs
- —
Air-quality risk 5/10 · Moderate
- Unhealthy air days now
- 7 days/yr
- Unhealthy air days in 30 yrs
- 9 days/yr
Risk factors via First Street. Map © Google.
Why this score? — see what drove the B- grade
The composite is a weighted blend of 9 inputs, each scored 0–100. Each bar is that input's sub-score; the figure is the points it added to the 100-point composite (weight × sub-score).
- Cash flow +25.7/30.0
- ARV discount +11.4/15.0
- DSCR +8.6/10.0
- 1% rule +6.8/10.0
- Schools +5.1/10.0
- Livability +3.8/5.0
- Condition / age +3.8/5.0
- Rent growth +2.9/5.0
- Appreciation +0.0/10.0
$305,000
🖨 Deal sheet 📄 Offer letter ✓ Due diligence
Listing remarks
Senior Park Community 55+. .Look no further! This charming large 2br. , 2ba is nestled on the lush greenbelt with a nice covered patio perfect for enjoying morning coffee or your favorite beverage. The entry welcomes you into the spacious living room featuring plenty of windows allowing for natural light, and adjacent to the dining room. Nice size kitchen with lots of counter and cabinet space including pull out drawers, gas cook top and breakfast nook. Just off the kitchen is the Den featuring a fire place and beverage bar perfect for entertaining family and friends. The master bedroom features a walk-in closet, attached bath with double sinks, soaking tub, walk in shower and linen space.
Key facts
- Size kitchen
- Natural light
- Covered patio
Tags
Property features AI
Finance
- Other: Manager approval required for multi-unit; Pets allowed
- Financial info: Monthly land lease (park) of $1,554.75
- HOA & community: Senior community; Park name: Lake Park Brea; Community features include curbs, street lighting, sidewalks, storm drains, lake and fishing
Exterior
- Parking: Concrete driveway; Attached carport (side-by-side)
- Security: Carbon monoxide detector(s); Smoke detector; Resident manager
- Utilities: Public/district water; Public sewer / sewer connected; Natural gas connected; Electricity connected; Telephone in street; Cable available (and noted as not available in one entry)
- Home design: Single-story mobile home (model: Westway, approximately 34' x 60'); Entry at front door; Faces south; One level; Has view
- Construction: Wood, brick, hardboard and stone construction; Composition/shingle roof; Pillar/post/pier foundation
- Exterior features: Covered front porch and patio (wood and concrete); Awning; Rain gutters; Shed (1); Landscaped lot; Greenbelt; Block wall and wrought iron fencing in good condition; Lake on lot and community fishing
Interior
- Kitchen: Microwave; Range/stove hood; Gas range; Electric oven; Tile counters; Kitchen open to family room; Pots & pan drawers
- Bedrooms: Primary suite; Walk-in closet
- Flooring: Vinyl; Carpet
- Bathrooms: Two full bathrooms; Soaking tub; Walk-in shower; Separate tub and shower; Double sinks in primary bath
- Heating & cooling: Central cooling; Central furnace heating
- Interior features: Wood product walls; Tile counters; Drapes/Curtains, blinds and screens; Carbon monoxide detector(s) and smoke detector; Resident manager; Community heated in-ground spa
- Laundry & utility: Inside laundry; Washer included; Dryer included; Washer hookup; Gas & electric dryer hookup
Neighborhood map
What this means for you Summary
Snapshot
- This is a 2-bed/2.0-bath manufactured listed at $305k. Condition is rated good.
Deal economics
- At list price, monthly cash flow is $732 ($9k/yr) — positive.
- The deal already cash-flows at list — no discount required.
- Meets the 1% rule at list price ($4k rent vs $305k).
- Recommended offer: $287k (6.0% below list) — sets the bar for market timing.
- Cap rate 9.2% vs local median 2.1% in Brea — top-decile yield for the area; either an underpriced asset or a hidden risk that comps aren't pricing in. Stress-test before assuming the spread holds.
Location & tenants
- Location reads 76/100 on livability (#100 in CA, #3,570 nationally) — a middle-class / working-renter tenant base. Strengths: amenities A+, employment A+, schools A-; Watch: health & safety C-, cost of living F.
- Fullerton Joint Union High (suburban): math 51% / reading 66% proficiency, ranked #82 of 517 in CA (top 16%) — acceptable for families but not a draw, mixed tenant base, ~2y average lease.
- Market conditions: Rents rising (+1.8%/yr); 63 active listings in the ZIP; 9 comparable units currently listed for rent nearby; rentals leasing fast (median 11d on market — plan ~1-2 weeks tenant-placement turnaround); high-income renter base; 6,974 units permitted in Orange County in 2024 (3,839 in 5+ unit buildings).
- This rent runs 35% of the median local income ($124k/yr) — at the standard rent-burdened threshold; future hikes will face affordability resistance.
Forward outlook
- Local home prices are declining (-3.0%/yr); year-one equity from $2k of loan paydown is wiped out by about $9k of value loss. Plan a longer hold.
- Orange County population projected at +14% by 2050 — modest demand growth; plan on rents tracking national, not racing it.
Negotiation context
- It's been on market 79 days — a 6% lower offer ($287k) is reasonable based on typical stale-listing flexibility.
Risks & watch-outs
- Climate carrying-cost: extreme-heat days projected 7→22/yr by 2055 (HVAC capex compounding) — expect insurance premiums to compound above CPI over the hold.
Questions for the listing agent
- It's been on market 79 days. Have you received any prior offers? Is the seller open to a 6% concession, seller financing, or rate buy-down credit?
- Why hasn't it sold? Are there any deal-killer items the seller is aware of (foundation, flood, title, zoning, code violations)?
- Is there a deadline driving the sale (1031 exchange, divorce, estate, relocation)? That informs how much negotiation room exists.
- Schools are A-rated — typically a magnet for longer-tenancy family renters. What's the average tenant stay here, and is there a school-zone premium baked into asking?
- What's the average days-on-market for RENTAL listings here right now (not sales)? A rising rental-DOM trend means longer vacancies and softer asking-rent achievability than the comps imply.
- What's the recent tenant-quality profile in this submarket — average credit score on applications, eviction rate, late-payment / NSF rate, and stable-employment percentage? A property-management company in the area should have these aggregated.
- How much new for-sale + rental construction is in the pipeline within 1–3 miles? Heavy new supply typically softens prices + rents 12–24 months out; constrained supply supports both.
Investment metrics
- 1% rule
- 1.18% ✓
- Cap rate
- 9.17%
- Cash-on-cash
- 10.29%
- DSCR
- 1.46
- GRM
- 7.1
CMA / ARV
- ARV (on-the-fly)
- $334,080
- Comps found
- 12
Show comp detail 12 sales within ~0.75 mi
| Address | Dist | Beds/Ba | Sqft | Sold | Price | $/sf | Match |
|---|---|---|---|---|---|---|---|
| 1362 Fern Lake Ave #113 | 0.12mi | 2/2.0 | 1,874 (+1%) | 3mo | $385,000 | $205 | 90 |
| 1371 Pleasant Lake Pl #105 | 0.12mi | 2/2.0 | 1,896 (+2%) | 6mo | $388,589 | $205 | 86 |
| 1351 Clear Lake Pl #76 | 0.03mi | 2/2.5 | 1,996 (+8%) | 1mo | $352,500 | $177 | 84 |
| 635 Shadow Lake Ave #43 | 0.16mi | 2/2.0 | 1,810 (-2%) | 9mo | $325,000 | $180 | 80 |
| 1352 Silver Lake Pl #87 | 0.04mi | 2/2.0 | 1,740 (-6%) | 10mo | $260,000 | $149 | 80 |
| 685 Wood Lake Dr #184 | 0.29mi | 2/2.0 | 1,770 (-5%) | 1mo | $155,000 | $88 | 78 |
| 2300 Lake Forest Ln #113 | 0.14mi | 2/2.0 | 1,704 (-8%) | 5mo | $355,000 | $208 | 76 |
| 605 Crest Lake Cir #230 | 0.14mi | 2/2.0 | 1,750 (-6%) | 13mo | $300,370 | $172 | 73 |
| 1381 Harbor Lake Ave #32 | 0.23mi | 2/2.0 | 1,680 (-10%) | 2mo | $250,000 | $149 | 72 |
| 1352 Pleasant Lake Pl #102 | 0.08mi | 2/2.0 | 1,680 (-10%) | 13mo | $280,000 | $167 | 70 |
| 675 Wood Lake Ave #186 | 0.28mi | 2/2.0 | 1,656 (-11%) | 1mo | $399,500 | $241 | 68 |
| 685 View Lake Dr #161 | 0.27mi | 2/2.0 | 1,640 (-12%) | 8mo | $385,000 | $235 | 62 |
Match score weights: distance 35% · size 25% · config 20% · recency 20%. Top-matched comps best support the ARV.
Projected returns pro-forma
-3.0% appreciation · 1.78% rent growth · sell at horizon
- IRR
- -2.2%
- Equity multiple
- 0.92×
- Total profit
- $-7,084
- Equity at exit
- $45,476
- IRR
- 6.1%
- Equity multiple
- 1.43×
- Total profit
- $36,657
- Equity at exit
- $26,371
Cash invested: $85,400 (down + closing). Projections, not guarantees.
Landlord ↔ Tenant lean methodology
- Overall (STATE)
- 18 Strongly Tenant-Friendly
- State California
- 18 Strongly Tenant-Friendly · D+13
- County
- — inherits STATE
- City
- — inherits STATE
ZIP-level market 92821
- Rents YoY
- 1.8%
- Active inventory
- 63
- Price-to-rent
- 7.1×
Monthly cashflow live
- Estimated rent
- $3,595 high interval (Pro) →
- Mortgage (P&I)
- −$1,599
- Tax est. 1.5%
- −$381 /mo · $4,575/yr
- Insurance
- −$127
- HOA
- −$0
- Vacancy / Maint / Mgmt
- −$755
- Net cashflow
- $732
Break-even live
UW: 25.0% down · 7.5% · 30yr · 1.5% tax · 5.0% vac · 8.0% maint · 8.0% mgmt
Financing live
Cash to close
- Down payment
- $76,250
- Closing costs
- $9,150
- Reserves months
- —
- Total cash needed
- —
Loan-product check · same deal, 3 products live
Conventional
25% down · 7.5% · 30yr
- Down + closing
- —
- Monthly P&I
- —
- Monthly cashflow
- —
- DSCR
- —
- Eligible?
- —
Personal DTI + credit; lowest rate.
DSCR
20% down · 8.5% · 30yr
- Down + closing
- —
- Monthly P&I
- —
- Monthly cashflow
- —
- DSCR
- —
- Eligible?
- —
No personal income docs; deal must DSCR.
Hard money
10% down · 12.0% · 12mo
- Down + closing
- —
- Monthly P&I
- —
- Monthly cashflow
- —
- DSCR
- —
- Eligible?
- —
Short-term bridge; refi at stabilization.
Rent comps 9 comps
| Address | Beds | Baths | Sqft | Rent | $/sqft | DOM | Units | Dist |
|---|---|---|---|---|---|---|---|---|
| 1511 Kinsler Ct Brea, CA | 3.0 | 2.5 | 1605 | $4,095 | $2.55 | 15d | 1 | 0.29mi |
| 141 N Fonda St Unit 1 La Habra, CA | 3.0 | 2.5 | 1300 | $3,400 | $2.62 | 10d | 1 | 0.75mi |
| 1500 Eastpark Dr Unit 3 La Habra, CA | 2.0 | 1.5 | 1286 | $2,500 | $1.94 | 1d | 1 | 0.78mi |
| 350 W Central Ave Brea, CA | 1.0–3.0 | 1.0–2.5 | 1024 | $3,538 | $3.45 | 1d | 8 | 1.12mi |
| 715 S Walnut Ave Apt 3 Brea, CA | 2.0 | 2.5 | 1300 | $3,400 | $2.62 | 4d | 1 | 1.35mi |
| 719 S Walnut Ave Brea, CA | 3.0 | 2.0 | 1339 | $3,800 | $2.84 | 44d | 1 | 1.36mi |
| 843 Bernard Dr Fullerton, CA | 3.0 | 2.0 | 1679 | $5,500 | $3.28 | 10d | 1 | 1.37mi |
| 843 Bernard Dr Fullerton, CA | 3.0 | 2.0 | 1679 | $5,500 | $3.28 | 1d | 1 | 1.37mi |
| 716 S Walnut Ave Brea, CA | 3.0 | 2.0 | 1357 | $3,800 | $2.80 | 44d | 1 | 1.39mi |
Listing history 14 events
-
2026-06-18days on market $305,000 Active 79 DOM
-
2026-06-17days on market $305,000 Active 78 DOM
-
2026-06-16days on market $305,000 Active 77 DOM
-
2026-06-15days on market $305,000 Active 76 DOM
-
2026-06-13days on market $305,000 Active 74 DOM
-
2026-06-09days on market $305,000 Active 70 DOM
-
2026-06-08days on market $305,000 Active 69 DOM
-
2026-06-07days on market $305,000 Active 68 DOM
-
2026-06-04days on market $305,000 Active 65 DOM
-
2026-06-03days on market $305,000 Active 64 DOM
-
2026-06-02days on market $305,000 Active 63 DOM
-
2026-06-01days on market $305,000 Active 62 DOM
-
2026-05-31days on market $305,000 Active 61 DOM
-
2026-03-31$305,000 Active
ⓘ Source: listings_history table (triggers on properties + properties_extension) + one-shot
backfill from property_details.listing_events for pre-trigger history.
Climate risk First Street
- Flood 1/10 Low FEMA zone X (unshaded) · 0% chance over 30 yrs
- Wildfire 2/10 Low
- Heat 6/10 Major 7 d/yr ≥96°F today · 22 d/yr by 30 yrs out
- Wind 1/10 Low
- Air quality 5/10 Major 7 unhealthy d/yr today · 9 by 30 yrs out
Nearby sold comps map
Loading sold comps map…
Walkable amenities ~0.75 mi
Loading nearby amenities…
Taxation est. · year 1
- Rental income
- $43,142
- − Mortgage interest
- −$17,085
- − Property taxes
- −$4,575
- − Insurance
- −$1,525
- − Repairs & maintenance
- −$3,451
- − Management
- −$3,451
- − Depreciation
- −$8,873
- Taxable income
- $4,182
- Est. tax owed @ 24.0%
- −$1,004
- After-tax cash flow
- $7,785/yr
For passive investors: Depreciation is non-cash, so a rental often shows a tax loss while cash-flowing — sheltering income. Rental losses are passive: they offset passive income freely, and up to $25,000/yr can offset ordinary (W-2) income if you actively participate and your MAGI is under $100k (phasing out to $0 by $150k); unused losses carry forward. On sale, claimed depreciation is recaptured at up to 25%, and gains may owe capital-gains tax (a 1031 exchange can defer both). Figures are a year-1 estimate at your 24.0% rate — not tax advice; consult a CPA.
Condition & rehab AI · 13 photos
This manufactured home is in good condition with a good roof and exterior. It has a spacious living room and a well-maintained exterior with a covered patio and a front porch. The home could benefit from some interior updates to increase its resale and rental value.
Repairs flagged
- Minor Kitchen cabinets — The cabinets are in good condition but may benefit from a fresh paint job or new hardware.
- Minor Bathroom vanity — The vanity is in good condition but may need a new faucet or hardware for a more modern look.
- Minor Carpet — The carpet in the living room and bedrooms may need to be replaced for a more modern look.
Value-add opportunities
- Resale Paint the interior walls — Updating the interior walls with fresh paint can make the home more appealing to potential buyers.
- Rental Replace the carpet — Replacing the carpet with a more modern and durable option can increase the rental value.
- Both Update the kitchen cabinets — Updating the kitchen cabinets can improve the home's curb appeal and increase both resale and rental value.
- Both Update the bathroom vanity — Updating the bathroom vanity can improve the home's curb appeal and increase both resale and rental value.
Renovation cost estimate screening
| Repair item | Severity | Est. cost |
|---|---|---|
| Kitchen cabinets · The cabinets are in good condition but may benefit from a fresh paint job or new hardware. | Minor | $500–3,000 |
| Bathroom vanity · The vanity is in good condition but may need a new faucet or hardware for a more modern look. | Minor | $500–3,000 |
| Carpet · The carpet in the living room and bedrooms may need to be replaced for a more modern look. | Minor | $500–3,000 |
| Total estimated repair cost · 3 items | $1,500–9,000 |
Value-add ROI direction
- Resale Paint the interior walls — Updating the interior walls with fresh paint can make the home more appealing to potential buyers. ↑
- Rental Replace the carpet — Replacing the carpet with a more modern and durable option can increase the rental value. ↑
- Both Update the kitchen cabinets — Updating the kitchen cabinets can improve the home's curb appeal and increase both resale and rental value. ↑
- Both Update the bathroom vanity — Updating the bathroom vanity can improve the home's curb appeal and increase both resale and rental value. ↑
ⓘ Cost ranges are severity-bucket heuristics (US national rule-of-thumb). Get contractor quotes + a written scope before underwriting a rehab budget.
Schools (NCES district)
- District
- Fullerton Joint Union High
- NCES district ID
- 0614760
- Math proficiency
- 51% ▲ 7.00%
- Reading proficiency
- 66% ▲ 1.00%
- Median HH income
- $66,666
- Composite
- 51.37/100
- National rank
- #1735
- State rank
- #82 of 517 in CA
Livability — Brea
- Score
- 76/100
- State rank
- #100
- US rank
- #3570
Category grades
Schools grade is shown separately in the Schools card above.
Census & demographics
- Census place
- Brea, CA
- County
- Orange County · 3,096,323 people
- City population
- 41,623
- Metro
- Los Angeles-Long Beach-Anaheim, CA
- Population (ZIP)
- 41,623
- Household income
- $123,629
- Rent vs Own
- Severe rent burden
- 1655.0
Population outlook (Orange County) Hauer SSP2
- Today (2025)
- 3,477,456 people
- By 2030
- 3,613,117 · +3.9%
- By 2040
- 3,835,945 · +10.3%
- By 2050
- 3,968,736 · +14.1%
- By 2075
- 4,097,053 · +17.8%
- By 2100
- 3,903,633 · +12.3%
Race, ethnicity, and origin ACS 2023
- Neighborhood character
- Diverse neighborhood (Simpson 0.69)
- Race & ethnicity
- White 38% Hispanic / Latino 32% Asian 24% Two or more races 14% Black 1%
- Hispanic origin (detail)
- Mexican 27%
- Common ancestry
- Slovak 2% Lithuanian 2% Italian 1%
- Foreign-born
- 23% · Canada, South Korea, China
- Languages at home
- 66% English-only · Spanish 16% Korean 6% Chinese 4%
Political lean MEDSL · Orange
- 2024 margin
- Toss-up / Even · D 49.7% · R 47.1% · Other 3.2%
- 2008→2024 swing
- +5.2pp toward D · 2008: -2.6pp · 2024: 2.6pp
- All cycles
- 2024: D+2.6 2020: D+9.0 2016: D+7.7 2012: R+8.3 2008: R+2.6
Not yet ingested
- Civics
- —
Market trends
- HPI YoY
- ▼ -826.78%
- Current HPI
- 374.8663
- Rent YoY
- ▲ 1.78%
- Metro
- Los Angeles-Long Beach-Anaheim, CA
- State GDP YoY
- ▲ 3.21%
- F500 in state
- 116
Industry mix (Fortune 500 HQ in CA)
| Industry | F500 HQs | Revenue |
|---|---|---|
| Technology | 27 | $1,492B |
|
||
| Financial Services | 3 | $174B |
|
||
| Retail | 3 | $44B |
|
||
| Insurance | 3 | $26B |
|
||
| Media / Entertainment | 2 | $115B |
|
||
| Pharmaceuticals / Biotech | 2 | $62B |
|
||
Price history
1 event — show timeline
- 2026-03-31 Listed $305,000 CRMLS
Cash-flow waterfall
monthlySold comps — $/sqft
last 12 mo · ≤1 miLoading sold comps…