 Duplex
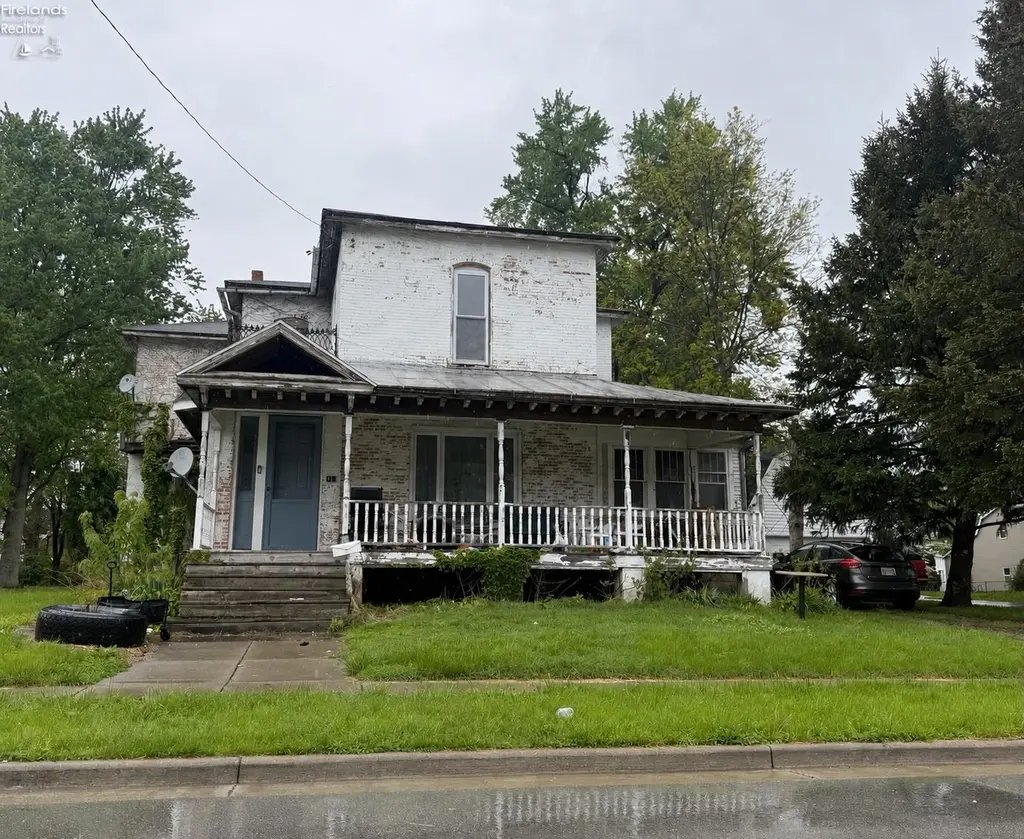
117 E Forest St · Clyde, OH
Flood risk 1/10 · Minimal
- FEMA flood zone
- X (unshaded)
- Chance of flooding over 30 yrs
- 0.0%
- Est. flood insurance / yr
- $473 – $860
Fire risk 1/10 · Minimal
- Est. fire insurance / yr
- $713 – $1,323
Heat risk 3/10 · Minor
- Hot days now (above 98°F)
- 7 days/yr
- Hot days in 30 yrs
- 16 days/yr
Wind risk 2/10 · Minimal
- Chance of severe wind over 30 yrs
- —
Air-quality risk 2/10 · Minimal
- Unhealthy air days now
- 0 days/yr
- Unhealthy air days in 30 yrs
- 1 days/yr
Risk factors via First Street. Map © Google.
Why this score? — see what drove the B grade
The composite is a weighted blend of 9 inputs, each scored 0–100. Each bar is that input's sub-score; the figure is the points it added to the 100-point composite (weight × sub-score).
- Cash flow +30.0/30.0
- 1% rule +10.0/10.0
- DSCR +10.0/10.0
- ARV discount +7.5/15.0
- Schools +4.8/10.0
- Livability +3.7/5.0
- Rent growth +2.5/5.0
- Condition / age +2.5/5.0
- Appreciation +0.0/10.0
$80,000
🖨 Deal sheet (PDF) 📄 Offer letter ✓ Due diligence
Multi-family units
County records classify this as Multi-Family (2-4 Unit). Listing-text estimate: 2 units. confirmed
Listing remarks
Investor Opportunity with Endless Potential! Bring your vision and creativity to this spacious Victorian duplex loaded with character and opportunity. This property currently features two lower-level units offering approximately 1,038 sq ft each, plus a large upper level with approximately 1,309 sq ft and the potential to be converted into a third unit. With its classic Victorian charm, generous square footage, and flexible layout, this property could be transformed into a multi-unit income producer, renovation project, or investment opportunity. The home is in need of significant repairs and updates and is being sold as-is. Whether you're looking to restore its historic beauty or maximize
Key facts
- Victorian duplex
- Historic beauty
- Large upper level
Tags
Property features AI
Exterior
- Parking: Off-street parking
- Utilities: Public water; Public sewer; Electric service with fuses
- Home design: Multi-family residential income property; Multiple units
- Construction: Brick construction
- Exterior features: Residential zoning
Interior
- Heating & cooling: Natural gas forced-air heating
- Interior features: Full basement
Neighborhood map
What this means for you Summary
Snapshot
- This is a 2 × 2-bed/1-bath units multifamily listed at $80k.
Deal economics
- At list price, monthly cash flow is $1k ($13k/yr) — positive. Per door: $543/mo.
- The deal already cash-flows at list — no discount required.
- Meets the 1% rule at list price ($2k rent vs $80k).
- Recommended offer: $78k (3.0% below list) — sets the bar for market timing.
Location & tenants
- Location reads 74/100 on livability (#299 in OH, #4,829 nationally) — a middle-class / working-renter tenant base. Strengths: cost of living A+, housing A+, health & safety A+; Watch: employment C-, amenities F, commute F.
- Clyde-Green Springs Exempted Village (town): math 53% / reading 61% proficiency, ranked #337 of 656 in OH (top 51%) — acceptable for families but not a draw, mixed tenant base, ~2y average lease.
- Zoned schools: Mcpherson Middle School (math 62% / reading 63%, grade B+, #238 of 654 statewide, top 37%, 473 students, 50% FRL); Clyde High School (math 26% / reading 57%, grade F, #515 of 781 statewide, top 66%, 637 students, 46% FRL).
- Market conditions: 21 active listings in the ZIP; 23 units permitted in Sandusky County in 2024 (0 in 5+ unit buildings).
- At $2,100/mo this rent would consume 46% of the median local household income ($55k/yr) — very limited rent-growth headroom before tenants either downsize or default.
Forward outlook
- Local home prices are declining (-3.0%/yr); year-one equity from $553 of loan paydown is wiped out by about $2k of value loss. Plan a longer hold.
- Sandusky County population projected at -17% by 2050 — secular population decline; favor cash flow + early exit over multi-decade hold.
- At projected returns (-3.0% appreciation + 3.0% rent growth), your $22k cash investment doubles in ~2 years — after that, you're playing with house money.
Negotiation context
- It's been on market 46 days — a 3% lower offer ($78k) is reasonable based on typical stale-listing flexibility.
- Current owner paid $35k; list at $80k implies a 129% gain — meaningful room to come down on a strong offer.
Risks & watch-outs
- Watch-outs: built in 1900 — expect roof / HVAC / electrical / plumbing capex.
Questions for the listing agent
- It's been on market 46 days. Have you received any prior offers? Is the seller open to a 3% concession, seller financing, or rate buy-down credit?
- Can we see the unit-by-unit rent roll, current vacancy, and any below-market leases? What's the average tenancy length?
- What capital expenditures (roof, boiler, parking lot, exteriors) have been made in the last 5 years, and what's planned in the next 2?
- Built in 1900 — when were the roof, HVAC, electrical panel, plumbing, and water heater last replaced?
- Is there a deadline driving the sale (1031 exchange, divorce, estate, relocation)? That informs how much negotiation room exists.
- Schools are B-rated — typically a magnet for longer-tenancy family renters. What's the average tenant stay here, and is there a school-zone premium baked into asking?
- What's the average days-on-market for RENTAL listings here right now (not sales)? A rising rental-DOM trend means longer vacancies and softer asking-rent achievability than the comps imply.
- What's the recent tenant-quality profile in this submarket — average credit score on applications, eviction rate, late-payment / NSF rate, and stable-employment percentage? A property-management company in the area should have these aggregated.
- How much new apartment / multifamily construction is in the pipeline within 1–3 miles? Heavy new supply (>2% of stock underway) typically softens rents 12–24 months out; light construction supports rent growth.
Investment metrics
- 1% rule
- 2.62% ✓
- Cap rate
- 22.59%
- Cash-on-cash
- 58.21%
- DSCR
- 3.59
- GRM
- 3.2
CMA / ARV
- ARV (median comp)
- $424,055
- List price
- $80,000
- Delta
- -81.13%
- Verdict
- UNDERPRICED
- Comps
- 1 within 2.0 mi
Projected returns pro-forma
-3.0% appreciation · 3.0% rent growth · sell at horizon
- IRR
- 56.8%
- Equity multiple
- 3.51×
- Total profit
- $56,280
- Equity at exit
- $11,928
- IRR
- 61.7%
- Equity multiple
- 7.17×
- Total profit
- $138,291
- Equity at exit
- $6,917
Cash invested: $22,400 (down + closing). Projections, not guarantees.
Landlord ↔ Tenant lean methodology
- Overall (STATE)
- 73 Landlord-Friendly
- State Ohio
- 73 Landlord-Friendly · R+6
- County
- — inherits STATE
- City
- — inherits STATE
ZIP-level market 43410
- Home prices YoY
- -24.4%
- Active inventory
- 21
- Price-to-rent
- 6.3×
Monthly cashflow live
- Estimated rent
- $2,100 medium interval (Pro) →
- Mortgage (P&I)
- −$420
- Tax from tax record
- −$120 /mo · $1,436/yr
- Insurance
- −$33
- HOA
- −$0
- Vacancy / Maint / Mgmt
- −$441
- Net cashflow
- $1,086
Break-even live
Sensitivity live
| Price | -10% $1,132 | -5% $1,109 | +0% $1,086 | +5% $1,064 | +10% $1,041 |
|---|---|---|---|---|---|
| Rent | -10% $921 | -5% $1,004 | +0% $1,086 | +5% $1,169 | +10% $1,252 |
| Rate | -1.0pp $1,127 | -0.5pp $1,107 | base $1,086 | +0.5pp $1,066 | +1.0pp $1,045 |
2-unit breakdown (identical units grouped — click to expand)
| Units | Beds | Baths | Est. rent |
|---|---|---|---|
| 2× units | 2 | 1 | $2,100 |
| #1 | 2 | 1 | $1,050 |
| #2 | 2 | 1 | $1,050 |
| Total (2 units) | $2,100 | ||
UW: 25.0% down · 7.5% · 30yr · 1.5% tax · 5.0% vac · 8.0% maint · 8.0% mgmt
Financing live
Cash to close
- Down payment
- $20,000
- Closing costs
- $2,400
- Reserves months
- —
- Total cash needed
- —
Loan-product check · same deal, 3 products live
Conventional
25% down · 7.5% · 30yr
- Down + closing
- —
- Monthly P&I
- —
- Monthly cashflow
- —
- DSCR
- —
- Eligible?
- —
Personal DTI + credit; lowest rate.
DSCR
20% down · 8.5% · 30yr
- Down + closing
- —
- Monthly P&I
- —
- Monthly cashflow
- —
- DSCR
- —
- Eligible?
- —
No personal income docs; deal must DSCR.
Hard money
10% down · 12.0% · 12mo
- Down + closing
- —
- Monthly P&I
- —
- Monthly cashflow
- —
- DSCR
- —
- Eligible?
- —
Short-term bridge; refi at stabilization.
Listing history 20 events
-
2026-06-22days on market $80,000 Active 46 DOM
-
2026-06-21days on market $80,000 Active 45 DOM
-
2026-06-19days on market $80,000 Active 43 DOM
-
2026-06-18days on market $80,000 Active 42 DOM
-
2026-06-17days on market $80,000 Active 41 DOM
-
2026-06-16days on market $80,000 Active 40 DOM
-
2026-06-15days on market $80,000 Active 39 DOM
-
2026-06-14days on market $80,000 Active 37 DOM
-
2026-06-12days on market $80,000 Active 36 DOM
-
2026-06-09days on market $80,000 Active 33 DOM
-
2026-06-08days on market $80,000 Active 32 DOM
-
2026-06-07days on market $80,000 Active 31 DOM
-
2026-06-05days on market $80,000 Active 29 DOM
-
2026-06-03days on market $80,000 Active 27 DOM
-
2026-06-02days on market $80,000 Active 26 DOM
-
2026-06-01days on market $80,000 Active 25 DOM
-
2026-05-31days on market $80,000 Active 24 DOM
-
2026-05-30days on market $80,000 Active 23 DOM
-
2026-05-06$80,000 Active 782-char remark
-
2010-08-05soldstatus $35,000
ⓘ Source: listings_history table (triggers on properties + properties_extension) + one-shot
backfill from property_details.listing_events for pre-trigger history.
Tax reassessment forecast OH · Partial reset (capped growth)
- Current annual tax
- $1,436 · $120/mo
- Projected year-2 tax
- $1,436 · $120/mo
- Expected delta
- $0/yr ($0/mo · 0.0%)
ⓘ Screening estimate from a state-policy table — verify with the county assessor before closing.
Climate risk First Street
- Flood 1/10 Low FEMA zone X (unshaded) · 0% chance over 30 yrs
- Wildfire 1/10 Low
- Heat 3/10 Moderate 7 d/yr ≥98°F today · 16 d/yr by 30 yrs out
- Wind 2/10 Low
- Air quality 2/10 Low 0 unhealthy d/yr today · 1 by 30 yrs out
Nearby sold comps map
Loading sold comps map…
Walkable amenities ~0.75 mi
Loading nearby amenities…
Taxation est. · year 1
- Rental income
- $25,200
- − Mortgage interest
- −$4,481
- − Property taxes
- −$1,436
- − Insurance
- −$400
- − Repairs & maintenance
- −$2,016
- − Management
- −$2,016
- − Depreciation
- −$2,327
- Taxable income
- $12,524
- Est. tax owed @ 24.0%
- −$3,006
- After-tax cash flow
- $10,032/yr
For passive investors: Depreciation is non-cash, so a rental often shows a tax loss while cash-flowing — sheltering income. Rental losses are passive: they offset passive income freely, and up to $25,000/yr can offset ordinary (W-2) income if you actively participate and your MAGI is under $100k (phasing out to $0 by $150k); unused losses carry forward. On sale, claimed depreciation is recaptured at up to 25%, and gains may owe capital-gains tax (a 1031 exchange can defer both). Figures are a year-1 estimate at your 24.0% rate — not tax advice; consult a CPA.
Schools (NCES district)
- District
- Clyde-Green Springs Exempted Village
- NCES district ID
- 3910020
- Math proficiency
- 53% ▼ -15.00%
- Reading proficiency
- 61% ▼ -4.00%
- Median HH income
- $49,119
- Composite
- 48.48/100
- National rank
- #2125
- State rank
- #337 of 656 in OH
Livability — Clyde
- Score
- 74/100
- State rank
- #299
- US rank
- #4829
Category grades
Schools grade is shown separately in the Schools card above.
Census & demographics
- Census place
- Clyde, OH
- County
- Sandusky · 51,886 people
- Population (ZIP)
- 10,365
- Household income
- $54,635
- Rent vs Own
- Severe rent burden
- 2.9
Population outlook (Sandusky County) Hauer SSP2
- Today (2025)
- 57,409 people
- By 2030
- 55,791 · -2.8%
- By 2040
- 51,837 · -9.7%
- By 2050
- 47,712 · -16.9%
- By 2075
- 39,908 · -30.5%
- By 2100
- 33,171 · -42.2%
Race, ethnicity, and origin ACS 2023
- Neighborhood character
- Predominantly White (90%)
- Race & ethnicity
- White 90% Two or more races 6% Hispanic / Latino 5%
- Common ancestry
- Romanian 5% Slovak 3% Lithuanian 3%
- Foreign-born
- 1% · Canada, Dominican Republic
- Languages at home
- 97% English-only · Spanish 3%
Political lean MEDSL · Sandusky
- 2024 margin
- Solid R (+30.9) · D 34.1% · R 65.0%
- 2008→2024 swing
- -35.5pp toward R · 2008: 4.6pp · 2024: -30.9pp
- All cycles
- 2024: R+30.9 2020: R+27.6 2016: R+23.0 2012: D+1.9 2008: D+4.6
Not yet ingested
- Civics
- —
Market trends
- HPI YoY
- ▼ -63.59%
- Current HPI
- 197.1954
- Rent YoY
- —
- Metro
- —
- State GDP YoY
- ▲ 1.98%
- F500 in state
- 48
Industry mix (Fortune 500 HQ in OH)
| Industry | F500 HQs | Revenue |
|---|---|---|
| Insurance | 3 | $145B |
|
||
| Industrial Machinery | 3 | $49B |
|
||
| Financial Services | 3 | $24B |
|
||
| Consumer Goods | 2 | $93B |
|
||
| Aerospace / Defense | 2 | $47B |
|
||
| Utilities | 2 | $33B |
|
||
Price history
+128.6% since first listed2 events — show timeline
- 2026-05-06 Listed $80,000 FAOR
- 2010-08-05 Sold (Public Records) $35,000 Public Records
Property tax history
+3.0%/yrLatest (2025): $1,436 · +104.4% YoY. Source: county tax records.
Cash-flow waterfall
monthlySold comps — $/sqft
last 12 mo · ≤1 miLoading sold comps…