4001 Hillcrest Dr #705 · Hollywood, FL
Flood risk 1/10 · Minimal
- FEMA flood zone
- AH
- Chance of flooding over 30 yrs
- 0.0%
- Est. flood insurance / yr
- $1,142 – $2,507
Fire risk 1/10 · Minimal
- Est. fire insurance / yr
- $947 – $1,759
Heat risk 10/10 · Severe
- Hot days now (above 105°F)
- 6 days/yr
- Hot days in 30 yrs
- 22 days/yr
Wind risk 10/10 · Severe
- Chance of severe wind over 30 yrs
- 99.0%
Air-quality risk 2/10 · Minimal
- Unhealthy air days now
- 2 days/yr
- Unhealthy air days in 30 yrs
- 2 days/yr
Risk factors via First Street. Map © Google.
Why this score? — see what drove the C- grade
The composite is a weighted blend of 9 inputs, each scored 0–100. Each bar is that input's sub-score; the figure is the points it added to the 100-point composite (weight × sub-score).
- Cash flow +19.7/30.0
- 1% rule +8.1/10.0
- ARV discount +7.5/15.0
- DSCR +6.2/10.0
- Schools +4.1/10.0
- Livability +3.8/5.0
- Rent growth +3.1/5.0
- Condition / age +2.5/5.0
- Appreciation +0.0/10.0
$230,000
🖨 Deal sheet 📄 Offer letter ✓ Due diligence
Listing remarks
Beautiful corner unit at 4001 Hillcrest Drive, Unit 705—a bright and spacious home offering comfort and style in a highly desirable 55+ community. This residence features an expansive living area that opens to a private screened balcony, perfect for enjoying relaxing breezes and wide scenic views. Additional conveniences include a generous storage throughout. The building is part of one of Hillcrest’s best-maintained associations, offering residents a peaceful, well-managed environment and access to resort-style amenities. With no rentals permitted, the community maintains an exclusive owner-occupied atmosphere. This corner condo truly stands out—clean, updated, and easy t
Key facts
- Generous storage
- $660 HOA
- Garage
Tags
Property features AI
Finance
- Other: Senior community
- Financial info: Pets allowed with size limit (maximum 20 lbs)
- HOA & community: Monthly association fee; Association amenities: bike storage, laundry, pool, trails, trash service, elevators; Association covers: common areas, cable TV, insurance, laundry, grounds maintenance, structure maintenance, parking, pest control, pool(s), reserve fund, sewer, security, trash, water
Exterior
- Parking: Detached garage; One covered garage space; Two or more parking spaces
- Security: Doorman; Secured elevator; Fire sprinkler system; Smoke detectors
- Utilities: Water included in association services; Sewer included in association services; Electric cooling and heating
- Home design: Attached property (condominium); 12-story building; Entry on level 7
- Construction: Block construction; Resale unit
- Exterior features: Balcony (open, screened); Storm/security shutters; Exterior lighting; Association heated pool
Interior
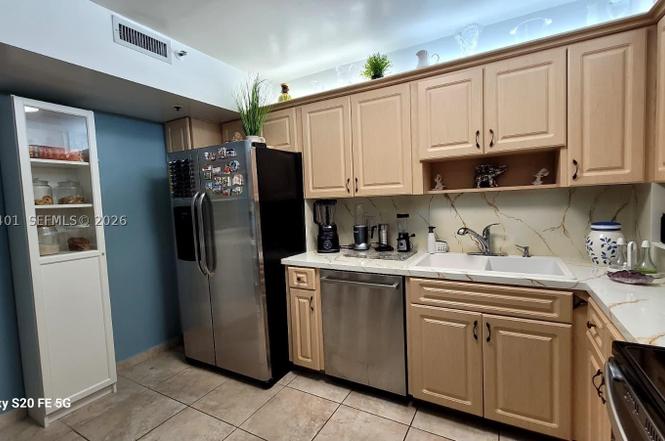
- Kitchen: Dishwasher; Electric range; Disposal; Microwave; Refrigerator; Eat-in kitchen layout
- Bedrooms: Bedroom on main level
- Flooring: Tile flooring
- Bathrooms: 2 full bathrooms
- Heating & cooling: Central heating (electric); Central air conditioning (electric); Ceiling fan(s)
- Interior features: Unfurnished; Built-in features; Closet cabinetry; Eat-in kitchen; Living/dining room; Custom mirrors; Main living area on entry level
- Laundry & utility: Common area laundry; Laundry tub; Laundry room / utility room
Neighborhood map
What this means for you Summary
Snapshot
- This is a 2-bed/2.0-bath condo listed at $230k.
Deal economics
- At list price, monthly cash flow is $117 ($1k/yr) — positive.
- The deal already cash-flows at list — no discount required.
- Meets the 1% rule at list price ($3k rent vs $230k).
- Recommended offer: $209k (9.0% below list) — sets the bar for market timing.
- Cap rate 7.7% vs local median 3.2% in Hollywood — top-decile yield for the area; either an underpriced asset or a hidden risk that comps aren't pricing in. Stress-test before assuming the spread holds.
Location & tenants
- Location reads 76/100 on livability (#232 in FL, #3,548 nationally) — a middle-class / working-renter tenant base. Strengths: commute A+, housing A+, crime B+; Watch: amenities D.
- Broward (suburban): math 42% / reading 53% proficiency, ranked #46 of 73 in FL (top 63%) — families likely to look elsewhere, expect single-tenant / working-renter base with shorter leases.
- Market conditions: Rents rising (+2.4%/yr); 529 active listings in the ZIP; 40 comparable units currently listed for rent nearby; rentals at typical pace (median 25d on market — plan ~3-4 weeks tenant-placement turnaround); 2,111 units permitted in Broward County in 2024 (1,265 in 5+ unit buildings).
- At $3,003/mo this rent would consume 51% of the median local household income ($71k/yr) (locally 2151% of renters already pay >50% of income on rent) — very limited rent-growth headroom before tenants either downsize or default.
Forward outlook
- Local home prices are declining (-3.0%/yr); year-one equity from $2k of loan paydown is wiped out by about $7k of value loss. Plan a longer hold.
- Broward County population projected at +34% by 2050 — long-run rental-demand tailwind backs the buy-and-hold thesis.
Negotiation context
- It's been on market 100 days — a 9% lower offer ($209k) is reasonable based on typical stale-listing flexibility.
- 3 sale attempts; this cycle's ask has dropped $20k (8%) from the opening price — seller is motivated, your offer sets the floor, not the list.
- Current owner paid $115k; list at $230k implies a 100% gain — meaningful room to come down on a strong offer.
Risks & watch-outs
- Watch-outs: flood insurance adds $152/mo; HOA is 22% of rent.
- Climate carrying-cost: in FEMA flood zone AH (mandatory federal flood insurance); severe wind risk, 99% chance of damaging wind over 30y; extreme-heat days projected 6→22/yr by 2055 (HVAC capex compounding) — expect insurance premiums to compound above CPI over the hold.
Questions for the listing agent
- It's been on market 100 days. Have you received any prior offers? Is the seller open to a 9% concession, seller financing, or rate buy-down credit?
- What's the actual annual flood-insurance premium (NFIP or private), and is the property in a SFHA with mandatory coverage?
- What does the HOA fee cover, when was the last increase, and are there any pending special assessments or reserve-fund shortfalls?
- Any open or pending special assessments — roof, HVAC, plumbing, elevator, façade? What's the per-unit balance and payoff schedule, and is the seller paying it off at close or rolling it to the buyer?
- Why hasn't it sold? Are there any deal-killer items the seller is aware of (foundation, flood, title, zoning, code violations)?
- Is there a deadline driving the sale (1031 exchange, divorce, estate, relocation)? That informs how much negotiation room exists.
- What's the average days-on-market for RENTAL listings here right now (not sales)? A rising rental-DOM trend means longer vacancies and softer asking-rent achievability than the comps imply.
- What's the recent tenant-quality profile in this submarket — average credit score on applications, eviction rate, late-payment / NSF rate, and stable-employment percentage? A property-management company in the area should have these aggregated.
- How much new apartment / multifamily construction is in the pipeline within 1–3 miles? Heavy new supply (>2% of stock underway) typically softens rents 12–24 months out; light construction supports rent growth.
Investment metrics
- 1% rule
- 1.31% ✓
- Cap rate
- 7.70%
- Cash-on-cash
- 5.02%
- DSCR
- 1.22
- GRM
- 6.4
CMA / ARV
No comps found within radius.
Projected returns pro-forma
-3.0% appreciation · 2.41% rent growth · sell at horizon
- IRR
- -13.5%
- Equity multiple
- 0.52×
- Total profit
- $-31,109
- Equity at exit
- $34,294
- IRR
- -5.6%
- Equity multiple
- 0.65×
- Total profit
- $-22,801
- Equity at exit
- $19,886
Cash invested: $64,400 (down + closing). Projections, not guarantees.
Landlord ↔ Tenant lean methodology
- Overall (STATE)
- 87 Strongly Landlord-Friendly
- State Florida
- 87 Strongly Landlord-Friendly · R+3
- County
- — inherits STATE
- City
- — inherits STATE
ZIP-level market 33021
- Rents YoY
- 2.4%
- Active inventory
- 529
- Price-to-rent
- 6.4×
Monthly cashflow live
- Estimated rent
- $3,003 high interval (Pro) →
- Mortgage (P&I)
- −$1,206
- Tax from tax record
- −$141 /mo · $1,694/yr
- Insurance
- −$96
- Flood insurance flood zone
- −$152 /mo · $1,824/yr
- HOA
- −$660
- Vacancy / Maint / Mgmt
- −$631
- Net cashflow
- $117
Break-even live
UW: 25.0% down · 7.5% · 30yr · 1.5% tax · 5.0% vac · 8.0% maint · 8.0% mgmt
Financing live
Cash to close
- Down payment
- $57,500
- Closing costs
- $6,900
- Reserves months
- —
- Total cash needed
- —
Loan-product check · same deal, 3 products live
Conventional
25% down · 7.5% · 30yr
- Down + closing
- —
- Monthly P&I
- —
- Monthly cashflow
- —
- DSCR
- —
- Eligible?
- —
Personal DTI + credit; lowest rate.
DSCR
20% down · 8.5% · 30yr
- Down + closing
- —
- Monthly P&I
- —
- Monthly cashflow
- —
- DSCR
- —
- Eligible?
- —
No personal income docs; deal must DSCR.
Hard money
10% down · 12.0% · 12mo
- Down + closing
- —
- Monthly P&I
- —
- Monthly cashflow
- —
- DSCR
- —
- Eligible?
- —
Short-term bridge; refi at stabilization.
Rent comps 40 comps
| Address | Beds | Baths | Sqft | Rent | $/sqft | DOM | Units | Dist |
|---|---|---|---|---|---|---|---|---|
| 3932 Long Leaf Ln #1 Hollywood, FL | 3.0 | 2.5 | 1675 | $3,400 | $2.03 | 24d | 1 | 0.09mi |
| 1101 Banyan Dr Hollywood, FL | 3.0 | 2.0 | 1768 | $4,100 | $2.32 | 24d | 1 | 0.12mi |
| 4200 Hillcrest Dr #503 Hollywood, FL | 2.0 | 2.0 | 1132 | $2,300 | $2.03 | 24d | 1 | 0.13mi |
| 839 S Highland Dr Hollywood, FL | 2.0 | 2.0 | 1748 | $2,500 | $1.43 | 7d | 1 | 0.27mi |
| 839 S Highland Dr Hollywood, FL | 2.0 | 2.0 | 1748 | $3,000 | $1.72 | 24d | 1 | 0.27mi |
| 919 Hillcrest Dr #303 Hollywood, FL | 2.0 | 2.0 | 1100 | $2,000 | $1.82 | 24d | 1 | 0.31mi |
| 4209 Jefferson St Unit 4209 Hollywood, FL | 3.0 | 2.0 | 1697 | $7,200 | $4.24 | 2d | 1 | 0.32mi |
| 632 S Crescent Dr Hollywood, FL | 3.0 | 2.0 | 1744 | $6,500 | $3.73 | 24d | 1 | 0.35mi |
| 632 S Crescent Dr Unit 1533630P Hollywood, FL | 3.0 | 2.0 | 1743 | $7,380 | $4.23 | 7d | 1 | 0.35mi |
| 911 S Park Rd Hollywood, FL | 1.0–3.0 | 1.0–2.0 | 1123 | $2,619 | $2.33 | 1d | 24 | 0.38mi |
| 555 S Luna Ct Hollywood, FL | 2.0 | 2.0 | 1036 | $2,120 | $2.05 | 5d | 2 | 0.44mi |
| 812 S Park Rd Hollywood, FL | 1.0–3.0 | 1.0–2.0 | 999 | $2,424 | $2.43 | 2d | 24 | 0.45mi |
| 400 S Luna Ct #2 Hollywood, FL | 2.0 | 1.0 | 960 | $2,300 | $2.40 | 24d | 1 | 0.48mi |
| 3624 Jackson St Unit 21 Hollywood, FL | 2.0 | 2.0 | 1100 | $1,900 | $1.73 | 3d | 1 | 0.49mi |
| 570 S Park Rd Unit 13-6 Hollywood, FL | 2.0 | 2.0 | 1060 | $2,400 | $2.26 | 24d | 1 | 0.50mi |
| 530 S Park Rd Hollywood, FL | 2.0 | 2.0 | 1060 | $2,375 | $2.24 | 18d | 1 | 0.52mi |
| 640 S Park Rd Unit 14-4 Hollywood, FL | 2.0 | 2.0 | 1060 | $2,200 | $2.08 | 17d | 1 | 0.52mi |
| 640 S Park Rd Unit 34-4 Hollywood, FL | 2.0 | 2.0 | 1060 | $2,250 | $2.12 | 24d | 1 | 0.52mi |
| 640 S Park Rd Unit 14-4 Hollywood, FL | 2.0 | 2.0 | 1060 | $2,300 | $2.17 | 24d | 1 | 0.52mi |
| 640 S Park Rd Unit 12-4 Hollywood, FL | 3.0 | 2.0 | 1236 | $2,950 | $2.39 | 24d | 1 | 0.52mi |
| 3500 Jackson St Unit 203 Hollywood, FL | 2.0 | 2.0 | 875 | $1,995 | $2.28 | 24d | 1 | 0.53mi |
| 1455 Silk Oak Dr #1455 Hollywood, FL | 3.0 | 2.5 | 1800 | $4,100 | $2.28 | 24d | 1 | 0.55mi |
| 1455 Silk Oak Dr #1455 Hollywood, FL | 3.0 | 2.5 | 1800 | $4,250 | $2.36 | 7d | 1 | 0.55mi |
| 4802 Washington St #5 Hollywood, FL | 2.0 | 2.0 | 1080 | $2,500 | $2.31 | 24d | 1 | 0.55mi |
| 3600 Van Buren St Hollywood, FL | 1.0–2.0 | 1.0–2.0 | 1055 | $2,350 | $2.23 | 3d | 4 | 0.56mi |
| 450 S Park Rd Unit 5-307 Hollywood, FL | 3.0 | 2.0 | 1084 | $2,800 | $2.58 | 24d | 1 | 0.56mi |
| 470 S Park Rd Unit 7-307 Hollywood, FL | 3.0 | 2.0 | 1084 | $3,250 | $3.00 | 24d | 1 | 0.56mi |
| 3501 Jackson St #309 Hollywood, FL | 2.0 | 2.0 | 1170 | $2,500 | $2.14 | 24d | 1 | 0.56mi |
| 4764 Eucalyptus Dr Hollywood, FL | 3.0 | 2.5 | 1780 | $3,950 | $2.22 | 14d | 1 | 0.56mi |
| 4764 Eucalyptus Dr Hollywood, FL | 3.0 | 2.5 | 1780 | $3,950 | $2.22 | 24d | 1 | 0.56mi |
| 4812 Washington St #7 Hollywood, FL | 2.0 | 2.0 | 1080 | $2,200 | $2.04 | 18d | 1 | 0.57mi |
| 4812 Washington St Unit 147 Hollywood, FL | 2.0 | 2.0 | 1080 | $2,200 | $2.04 | 7d | 1 | 0.58mi |
| 460 S Park Rd Unit 6-304 Hollywood, FL | 2.0 | 1.0 | 918 | $1,950 | $2.12 | 5d | 1 | 0.58mi |
| 981 Hillcrest Ct #114 Hollywood, FL | 2.0 | 2.0 | 899 | $2,000 | $2.22 | 24d | 1 | 0.59mi |
| 3601 Van Buren St Hollywood, FL | 1.0–2.0 | 1.0–2.0 | 941 | $2,195 | $2.33 | 3d | 3 | 0.59mi |
| 4810 Eucalyptus Dr #3 Hollywood, FL | 3.0 | 2.5 | 1421 | $3,200 | $2.25 | 20d | 1 | 0.60mi |
| 530 S Park Rd Unit 17-11 Hollywood, FL | 2.0 | 2.0 | 1060 | $2,300 | $2.17 | 22d | 1 | 0.60mi |
| 530 S Park Rd Unit 12-11 Hollywood, FL | 2.0 | 2.0 | 1060 | $2,375 | $2.24 | 15d | 1 | 0.60mi |
| 4901 Washington St Hollywood, FL | 3.0 | 3.0 | 1397 | $4,850 | $3.47 | 24d | 1 | 0.60mi |
| 4901 Washington St Hollywood, FL | 3.0 | 3.0 | 1397 | $4,850 | $3.47 | 5d | 1 | 0.60mi |
HOA detail condo
- Monthly dues
- $660 · $7,920/yr
- Assessments
- None detected in remarks — confirm with the listing agent.
Listing history 22 events
-
2026-06-18days on market $230,000 Active 100 DOM
-
2026-06-17pricedays on market $230,000 Active 99 DOM
-
2026-06-16days on market $250,000 Active 98 DOM
-
2026-06-15days on market $250,000 Active 97 DOM
-
2026-06-13days on market $250,000 Active 95 DOM
-
2026-06-09days on market $250,000 Active 91 DOM
-
2026-06-07days on market $250,000 Active 89 DOM
-
2026-06-04days on market $250,000 Active 86 DOM
-
2026-06-03days on market $250,000 Active 85 DOM
-
2026-06-02days on market $250,000 Active 84 DOM
-
2026-06-01days on market $250,000 Active 83 DOM
-
2026-05-31days on market $250,000 Active 82 DOM
-
2026-03-10$250,000 Active
-
2026-03-09historical
-
2026-02-19price $250,000
-
2025-12-08$259,500 Active
-
2025-10-24historical
-
2025-08-29price $269,500
-
2025-07-15$275,000 Active
-
2017-11-21soldstatus $115,000
-
2004-06-22soldstatus $105,000
-
1979-10-01soldstatus $48,500
ⓘ Source: listings_history table (triggers on properties + properties_extension) + one-shot
backfill from property_details.listing_events for pre-trigger history.
Tax reassessment forecast FL · Resets to sale price
- Current annual tax
- $1,694 · $141/mo
- Projected year-2 tax
- $1,909 · $159/mo
- Expected delta
- +$215/yr (+$18/mo · 12.7%)
ⓘ Screening estimate from a state-policy table — verify with the county assessor before closing.
Climate risk First Street
- Flood 1/10 Low FEMA zone AH · 0% chance over 30 yrs
- Wildfire 1/10 Low
- Heat 10/10 Extreme 6 d/yr ≥105°F today · 22 d/yr by 30 yrs out
- Wind 10/10 Extreme 99% chance of damaging wind over 30 yrs
- Air quality 2/10 Low 2 unhealthy d/yr today · 2 by 30 yrs out
Nearby sold comps map
Loading sold comps map…
Walkable amenities ~0.75 mi
Loading nearby amenities…
Taxation est. · year 1
- Rental income
- $36,039
- − Mortgage interest
- −$12,884
- − Property taxes
- −$1,694
- − Insurance
- −$2,974
- − Repairs & maintenance
- −$2,883
- − Management
- −$2,883
- − HOA
- −$7,920
- − Depreciation
- −$6,691
- Taxable loss
- −$1,890
- Est. tax savings @ 24.0%
- +$454
- After-tax cash flow
- $1,863/yr
For passive investors: Depreciation is non-cash, so a rental often shows a tax loss while cash-flowing — sheltering income. Rental losses are passive: they offset passive income freely, and up to $25,000/yr can offset ordinary (W-2) income if you actively participate and your MAGI is under $100k (phasing out to $0 by $150k); unused losses carry forward. On sale, claimed depreciation is recaptured at up to 25%, and gains may owe capital-gains tax (a 1031 exchange can defer both). Figures are a year-1 estimate at your 24.0% rate — not tax advice; consult a CPA.
Schools (NCES district)
- District
- Broward
- NCES district ID
- 1200180
- Math proficiency
- 42% ▼ -18.00%
- Reading proficiency
- 53% ▼ -5.00%
- Median HH income
- $52,139
- Composite
- 40.88/100
- National rank
- #3621
- State rank
- #46 of 73 in FL
Livability — Hollywood
- Score
- 76/100
- State rank
- #232
- US rank
- #3548
Category grades
Schools grade is shown separately in the Schools card above.
Census & demographics
- Census place
- Hollywood, FL
- County
- Broward County · 1,963,430 people
- City population
- 109,079
- Metro
- Miami-Fort Lauderdale-Pompano Beach, FL
- Population (ZIP)
- 48,464
- Household income
- $71,318
- Rent vs Own
- Severe rent burden
- 2151.0
Population outlook (Broward County) Hauer SSP2
- Today (2025)
- 2,207,033 people
- By 2030
- 2,360,704 · +7.0%
- By 2040
- 2,661,208 · +20.6%
- By 2050
- 2,946,698 · +33.5%
- By 2075
- 3,602,273 · +63.2%
- By 2100
- 3,970,984 · +79.9%
Race, ethnicity, and origin ACS 2023
- Neighborhood character
- Diverse neighborhood (Simpson 0.65)
- Race & ethnicity
- White 45% Hispanic / Latino 37% Two or more races 17% Black 13% Asian 3%
- Hispanic origin (detail)
- Puerto Rican 5% Cuban 10% Dominican 2%
- Common ancestry
- Romanian 3% Scotch-Irish 2% Hispanic 2%
- Foreign-born
- 35% · Canada, Jamaica, Dominican Republic
- Languages at home
- 53% English-only · Spanish 33% French/Haitian/Cajun 4% Russian/Polish/Slavic 2%
Political lean MEDSL · Broward
- 2024 margin
- D (+17.0) · D 58.0% · R 41.0%
- 2008→2024 swing
- -17.8pp toward R · 2008: 34.7pp · 2024: 17.0pp
- All cycles
- 2024: D+17.0 2020: D+29.8 2016: D+35.0 2012: D+34.9 2008: D+34.7
Not yet ingested
- Civics
- —
Market trends
- HPI YoY
- ▼ -404.28%
- Current HPI
- 429.7129
- Rent YoY
- ▲ 2.41%
- Metro
- Miami-Fort Lauderdale-Pompano Beach, FL
- State GDP YoY
- ▲ 3.28%
- F500 in state
- 36
Industry mix (Fortune 500 HQ in FL)
| Industry | F500 HQs | Revenue |
|---|---|---|
| Industrial Technology | 2 | $29B |
|
||
| Insurance | 2 | $17B |
|
||
| Retail | 1 | $60B |
|
||
| Technology Distribution | 1 | $58B |
|
||
| Homebuilding | 1 | $35B |
|
||
| Technology Manufacturing | 1 | $35B |
|
||
Price history
+415.5% since first listed10 events — show timeline
- 2026-03-10 Listed $250,000 MARMLS
- 2026-03-09 Listing Removed — MARMLS
- 2026-02-19 Price Changed $250,000 MARMLS
- 2025-12-08 Listed $259,500 MARMLS
- 2025-10-24 Listing Removed — MARMLS
- 2025-08-29 Price Changed $269,500 MARMLS
- 2025-07-15 Listed $275,000 MARMLS
- 2017-11-21 Sold (Public Records) $115,000 Public Records
- 2004-06-22 Sold (Public Records) $105,000 Public Records
- 1979-10-01 Sold (Public Records) $48,500 Public Records
Property tax history
+5.9%/yrLatest (2025): $1,694 · -19.5% YoY. Source: county tax records.
Cash-flow waterfall
monthlySold comps — $/sqft
last 12 mo · ≤1 miLoading sold comps…