453 Fm 457 · Bay City, TX
Flood risk 6/10 · Moderate
- FEMA flood zone
- X (unshaded)
- Chance of flooding over 30 yrs
- 0.71%
- Est. flood insurance / yr
- $507 – $1,088
Fire risk 3/10 · Minor
- Est. fire insurance / yr
- $1,222 – $2,270
Heat risk 9/10 · Severe
- Hot days now (above 109°F)
- 7 days/yr
- Hot days in 30 yrs
- 23 days/yr
Wind risk 9/10 · Severe
- Chance of severe wind over 30 yrs
- 99.0%
Air-quality risk 2/10 · Minimal
- Unhealthy air days now
- 0 days/yr
- Unhealthy air days in 30 yrs
- 1 days/yr
Risk factors via First Street. Map © Google.
Why this score? — see what drove the B- grade
The composite is a weighted blend of 9 inputs, each scored 0–100. Each bar is that input's sub-score; the figure is the points it added to the 100-point composite (weight × sub-score).
- Cash flow +30.0/30.0
- 1% rule +10.0/10.0
- DSCR +10.0/10.0
- ARV discount +7.5/15.0
- Livability +3.6/5.0
- Rent growth +3.3/5.0
- Schools +2.6/10.0
- Condition / age +2.5/5.0
- Appreciation +0.0/10.0
$75,000
🖨 Deal sheet 📄 Offer letter ✓ Due diligence
Listing remarks
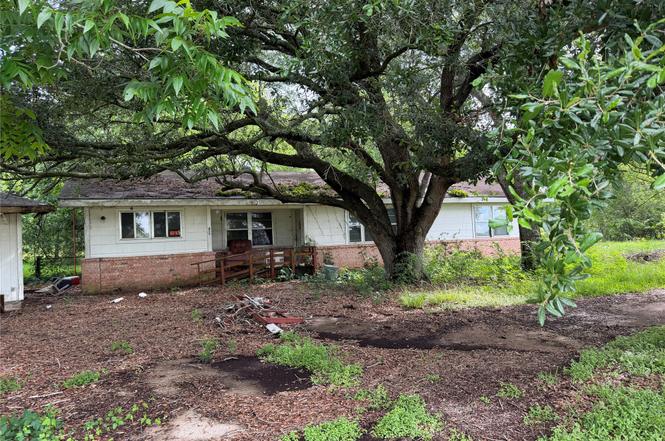
nvestor opportunity on a beautiful one-acre tract with mature trees providing shade and privacy. The property features a convenient circular driveway and offers plenty of space for future improvements or renovation projects. Surrounded by established trees and a peaceful setting, this property has great potential for investors, rental income, or those looking to create their own country retreat. Enjoy the charm of rural living while still being within easy reach of Bay City amenities. Don't miss this chance to own a property with character, space, and endless possibilities.
Key facts
- One acre tract
- Rural living
- Peaceful setting
Tags
Property features AI
Finance
- Financial info: Full ownership; Lease not considered
Exterior
- Parking: Detached garage; 2-car garage
- Utilities: Well water; Septic tank
- Home design: Residential property; Single-story (all listed rooms on the first floor)
- Construction: Built in 1956; Asbestos, brick and wood siding exterior; Composition roof; Slab foundation
- Exterior features: Cleared lot; Concrete road surface; Circular driveway
Interior
- Kitchen: Kitchen on the first floor (11'4" x 11'3"); Breakfast nook on the first floor (11'4" x 9'10")
- Bedrooms: Primary bedroom on the first floor (19 x 11'7"); Two additional first-floor bedrooms (12'3" x 10'6" and 11'10" x 9'8")
- Flooring: Carpet; Tile; Wood
- Bathrooms: 1 full bathroom
- Interior features: Washer hookup and electric dryer hookup; Carpet, tile and wood flooring; Total of 7 rooms
- Laundry & utility: Washer hookup; Electric dryer hookup
Neighborhood map
What this means for you Summary
Snapshot
- This is a 4-bed/1.0-bath single-family listed at $75k.
Deal economics
- At list price, monthly cash flow is $600 ($7k/yr) — positive.
- The deal already cash-flows at list — no discount required.
- Meets the 1% rule at list price ($1k rent vs $75k).
- Cap rate 15.9% vs local median 3.4% in Bay City — top-decile yield for the area; either an underpriced asset or a hidden risk that comps aren't pricing in. Stress-test before assuming the spread holds.
Location & tenants
- Location reads 71/100 on livability (#311 in TX) — a middle-class / working-renter tenant base. Strengths: cost of living A+, housing A+, health & safety A+; Watch: crime F, commute F, employment F.
- Bay City ISD (town): math 31% / reading 31% proficiency, ranked #604 of 826 in TX (top 73%) — families likely to look elsewhere, expect single-tenant / working-renter base with shorter leases; 66% free/reduced lunch — lower-income household profile, screen leases tightly.
- Zoned schools: Roberts El (513 students, 82% FRL); Bay City H S (math 35% / reading 39%, grade F, #897 of 1,632 statewide, top 57%, 1,031 students, 78% FRL).
- Market conditions: Rents rising (+3.3%/yr); 620 active listings in the ZIP; 1 comparable units currently listed for rent nearby; 153 units permitted in Matagorda County in 2024 (0 in 5+ unit buildings).
- This rent runs 30% of the median local income ($59k/yr) — at the standard rent-burdened threshold; future hikes will face affordability resistance.
Forward outlook
- Local home prices are declining (-3.0%/yr); year-one equity from $519 of loan paydown is wiped out by about $2k of value loss. Plan a longer hold.
- At projected returns (-3.0% appreciation + 3.3% rent growth), your $21k cash investment doubles in ~4 years — after that, you're playing with house money.
Negotiation context
- Only 3 days on market — expect competitive offers; lowballing is unlikely to land.
Risks & watch-outs
- Watch-outs: built in 1956 — expect roof / HVAC / electrical / plumbing capex.
- Climate carrying-cost: major flood risk; severe wind risk, 99% chance of damaging wind over 30y; extreme-heat days projected 7→23/yr by 2055 (HVAC capex compounding) — expect insurance premiums to compound above CPI over the hold.
Questions for the listing agent
- Built in 1956 — when were the roof, HVAC, electrical panel, plumbing, and water heater last replaced?
- Is there a deadline driving the sale (1031 exchange, divorce, estate, relocation)? That informs how much negotiation room exists.
- Schools are F-rated, which usually means shorter tenancies and higher turnover. Who's the typical renter profile here, and what's been the actual vacancy rate?
- Crime grade is F in this area — have there been break-ins, vandalism, or insurance claims at this property in the last 3 years? What carrier currently insures it and at what premium?
- What's the average days-on-market for RENTAL listings here right now (not sales)? A rising rental-DOM trend means longer vacancies and softer asking-rent achievability than the comps imply.
- What's the recent tenant-quality profile in this submarket — average credit score on applications, eviction rate, late-payment / NSF rate, and stable-employment percentage? A property-management company in the area should have these aggregated.
- How much new for-sale + rental construction is in the pipeline within 1–3 miles? Heavy new supply typically softens prices + rents 12–24 months out; constrained supply supports both.
Investment metrics
- 1% rule
- 1.99% ✓
- Cap rate
- 15.89%
- Cash-on-cash
- 34.28%
- DSCR
- 2.53
- GRM
- 4.2
CMA / ARV
No comps found within radius.
Projected returns pro-forma
-3.0% appreciation · 3.28% rent growth · sell at horizon
- IRR
- 30.1%
- Equity multiple
- 2.26×
- Total profit
- $26,531
- Equity at exit
- $11,183
- IRR
- 37.5%
- Equity multiple
- 4.54×
- Total profit
- $74,277
- Equity at exit
- $6,485
Cash invested: $21,000 (down + closing). Projections, not guarantees.
Landlord ↔ Tenant lean methodology
- Overall (STATE)
- 87 Strongly Landlord-Friendly
- State Texas
- 87 Strongly Landlord-Friendly · R+5
- County
- — inherits STATE
- City
- — inherits STATE
ZIP-level market 77414
- Home prices YoY
- -17.7%
- Rents YoY
- 3.3%
- Active inventory
- 620
- Price-to-rent
- 4.2×
Monthly cashflow live
- Estimated rent
- $1,492 medium interval (Pro) →
- Mortgage (P&I)
- −$393
- Tax from tax record
- −$154 /mo · $1,853/yr
- Insurance
- −$31
- HOA
- −$0
- Vacancy / Maint / Mgmt
- −$313
- Net cashflow
- $600
Break-even live
UW: 25.0% down · 7.5% · 30yr · 1.5% tax · 5.0% vac · 8.0% maint · 8.0% mgmt
Financing live
Cash to close
- Down payment
- $18,750
- Closing costs
- $2,250
- Reserves months
- —
- Total cash needed
- —
Loan-product check · same deal, 3 products live
Conventional
25% down · 7.5% · 30yr
- Down + closing
- —
- Monthly P&I
- —
- Monthly cashflow
- —
- DSCR
- —
- Eligible?
- —
Personal DTI + credit; lowest rate.
DSCR
20% down · 8.5% · 30yr
- Down + closing
- —
- Monthly P&I
- —
- Monthly cashflow
- —
- DSCR
- —
- Eligible?
- —
No personal income docs; deal must DSCR.
Hard money
10% down · 12.0% · 12mo
- Down + closing
- —
- Monthly P&I
- —
- Monthly cashflow
- —
- DSCR
- —
- Eligible?
- —
Short-term bridge; refi at stabilization.
Rent comps 1 comps
| Address | Beds | Baths | Sqft | Rent | $/sqft | DOM | Units | Dist |
|---|---|---|---|---|---|---|---|---|
| 1417 Highland Dr Bay City, TX | 3.0 | 2.0 | 1662 | $1,600 | $0.96 | 43d | 1 | 1.48mi |
Listing history 4 events
-
2026-06-19days on market $75,000 Active 3 DOM
-
2026-06-18days on market $75,000 Active 2 DOM
-
2026-06-17remarks 580-char remark
-
2026-06-17$75,000 Active 1 DOM
ⓘ Source: listings_history table (triggers on properties + properties_extension) + one-shot
backfill from property_details.listing_events for pre-trigger history.
Tax reassessment forecast TX · Resets to sale price
- Current annual tax
- $1,853 · $154/mo
- Projected year-2 tax
- $1,853 · $154/mo
- Expected delta
- $0/yr ($0/mo · 0.0%)
ⓘ Screening estimate from a state-policy table — verify with the county assessor before closing.
Climate risk First Street
- Flood 6/10 Major FEMA zone X (unshaded) · 71% chance over 30 yrs
- Wildfire 3/10 Moderate
- Heat 9/10 Extreme 7 d/yr ≥109°F today · 23 d/yr by 30 yrs out
- Wind 9/10 Extreme 99% chance of damaging wind over 30 yrs
- Air quality 2/10 Low 0 unhealthy d/yr today · 1 by 30 yrs out
Nearby sold comps map
Loading sold comps map…
Walkable amenities ~0.75 mi
Loading nearby amenities…
Taxation est. · year 1
- Rental income
- $17,906
- − Mortgage interest
- −$4,201
- − Property taxes
- −$1,853
- − Insurance
- −$375
- − Repairs & maintenance
- −$1,432
- − Management
- −$1,432
- − Depreciation
- −$2,182
- Taxable income
- $6,430
- Est. tax owed @ 24.0%
- −$1,543
- After-tax cash flow
- $5,655/yr
For passive investors: Depreciation is non-cash, so a rental often shows a tax loss while cash-flowing — sheltering income. Rental losses are passive: they offset passive income freely, and up to $25,000/yr can offset ordinary (W-2) income if you actively participate and your MAGI is under $100k (phasing out to $0 by $150k); unused losses carry forward. On sale, claimed depreciation is recaptured at up to 25%, and gains may owe capital-gains tax (a 1031 exchange can defer both). Figures are a year-1 estimate at your 24.0% rate — not tax advice; consult a CPA.
Schools (NCES district)
- District
- Bay City ISD
- NCES district ID
- 4809630
- Math proficiency
- 31% ▼ -8.00%
- Reading proficiency
- 31% ▼ -3.00%
- Median HH income
- $43,285
- Composite
- 26.4/100
- National rank
- #7229
- State rank
- #604 of 826 in TX
Livability — Bay City
- Score
- 71/100
- State rank
- #311
- US rank
- #7004
Category grades
Schools grade is shown separately in the Schools card above.
Census & demographics
- County
- Matagorda County · 24,334 people
- City population
- 24,334
- Metro
- Bay City, TX
- Population (ZIP)
- 24,334
- Household income
- $59,128
- Rent vs Own
- Severe rent burden
- 1228.0
Population outlook (Matagorda County) Hauer SSP2
- Today (2025)
- 37,148 people
- By 2030
- 37,082 · -0.2%
- By 2040
- 36,987 · -0.4%
- By 2050
- 36,934 · -0.6%
- By 2075
- 37,178 · +0.1%
- By 2100
- 35,184 · -5.3%
Race, ethnicity, and origin ACS 2023
- Neighborhood character
- Diverse neighborhood (Simpson 0.65)
- Race & ethnicity
- Hispanic / Latino 43% White 39% Black 13% Two or more races 13% Asian 2%
- Hispanic origin (detail)
- Mexican 37% Puerto Rican 1%
- Common ancestry
- Lithuanian 1% Slovak 1% Serbian 1%
- Foreign-born
- 12% · Canada
- Languages at home
- 71% English-only · Spanish 26% Other Indo-European 2% German/W. Germanic 1%
Political lean MEDSL · Matagorda
- 2024 margin
- Solid R (+50.5) · D 24.3% · R 74.8%
- 2008→2024 swing
- -23.1pp toward R · 2008: -27.4pp · 2024: -50.5pp
- All cycles
- 2024: R+50.5 2020: R+44.5 2016: R+40.7 2012: R+33.5 2008: R+27.4
Not yet ingested
- Civics
- —
Market trends
- HPI YoY
- ▼ -36.31%
- Current HPI
- 168.9985
- Rent YoY
- ▲ 3.28%
- Metro
- Bay City, TX
- State GDP YoY
- ▲ 3.95%
- F500 in state
- 110
Industry mix (Fortune 500 HQ in TX)
| Industry | F500 HQs | Revenue |
|---|---|---|
| Energy | 16 | $1,198B |
|
||
| Technology | 5 | $198B |
|
||
| Engineering / Construction | 4 | $72B |
|
||
| Energy Services | 3 | $60B |
|
||
| Utilities | 3 | $41B |
|
||
| Healthcare | 2 | $330B |
|
||
Price history
1 event — show timeline
- 2026-06-16 Listed $75,000 HARMLS
Property tax history
+2.2%/yrLatest (2025): $1,853 · -5.3% YoY. Source: county tax records.
Cash-flow waterfall
monthlySold comps — $/sqft
last 12 mo · ≤1 miLoading sold comps…