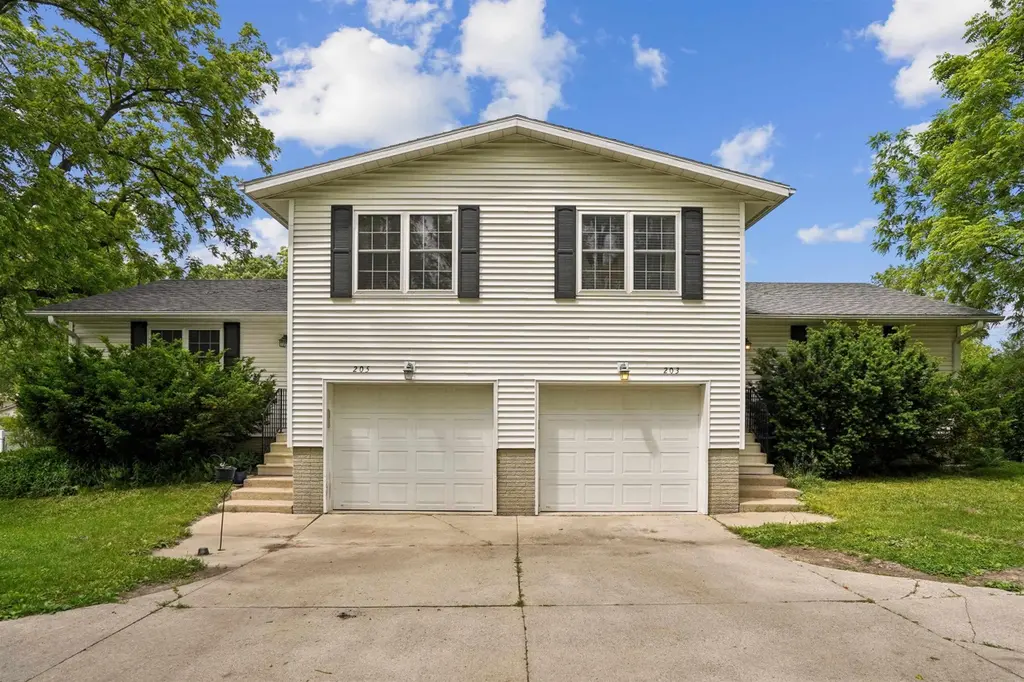
 Duplex
203-205 N Hackett Rd · Waterloo, IA
Flood risk 1/10 · Minimal
- FEMA flood zone
- X (unshaded)
- Chance of flooding over 30 yrs
- 0.0%
- Est. flood insurance / yr
- $473 – $860
Fire risk 1/10 · Minimal
- Est. fire insurance / yr
- $902 – $1,676
Heat risk 3/10 · Minor
- Hot days now (above 101°F)
- 7 days/yr
- Hot days in 30 yrs
- 15 days/yr
Wind risk 2/10 · Minimal
- Chance of severe wind over 30 yrs
- —
Air-quality risk 1/10 · Minimal
- Unhealthy air days now
- 0 days/yr
- Unhealthy air days in 30 yrs
- 0 days/yr
Risk factors via First Street. Map © Google.
Why this score? — see what drove the D- grade
The composite is a weighted blend of 9 inputs, each scored 0–100. Each bar is that input's sub-score; the figure is the points it added to the 100-point composite (weight × sub-score).
- ARV discount +13.6/15.0
- Cash flow +6.4/30.0
- Schools +4.4/10.0
- Livability +4.0/5.0
- Rent growth +3.5/5.0
- Condition / age +2.5/5.0
- 1% rule +1.9/10.0
- DSCR +0.7/10.0
- Appreciation +0.0/10.0
$264,900
🖨 Deal sheet 📄 Offer letter ✓ Due diligence
Multi-family units
County records classify this as Multi-Family (2-4 Unit). Listing-text estimate: 2 units. confirmed
Listing remarks
Well-maintained and exceptionally clean duplex located in a highly desirable Waterloo location. This turnkey investment property features two spacious units, each offering 2 large bedrooms, 1 updated bathroom, a generous living room, dining area, and functional kitchen layout. Each unit also includes a lower level with washer and dryer and excellent storage space, along with an attached garage for added tenant convenience. Situated on a large, partially fenced lot, the property also includes a detached 2-stall, double-deep garage currently being utilized by the owner for storage. This space offers excellent potential for additional rental income or expanded tenant storage options. The duple
Key facts
- Two spacious units
- Partially fenced lot
- Attached garage
Tags
Property features AI
Finance
- Other: Property type: Residential Income (Duplex)
- Financial info: Actual rent reported: $1,050 for each unit
Exterior
- Parking: Attached garage (total 2 garage spaces); Additional parking pad providing about 3 open parking spaces; Each unit includes 1 garage space
- Utilities: Public water; Public sewer
- Home design: Residential income duplex; One to one-and-a-half levels
- Construction: Vinyl siding construction
- Exterior features: Asphalt roof; Vinyl siding; Lot approximately 102 x 144 (0.34 acre); Zoned R-3
Interior
- Kitchen: No kitchen appliance details provided
- Bedrooms: Two 2-bedroom units
- Bathrooms: Each unit has one bathroom
- Heating & cooling: Forced air heating (natural gas); Central air conditioning; Ceiling fans
- Interior features: Basement with concrete floor and both interior and exterior entry
- Laundry & utility: Laundry hookups on lower level; Washer hookup and gas dryer hookup
Neighborhood map
What this means for you Summary
Snapshot
- This is a 2 × 2-bed/1.0-bath units multifamily listed at $265k.
Deal economics
- At list price, monthly cash flow is $-458 ($-6k/yr) — negative. Per door: $-229/mo.
- To cash-flow at today's rent, offer at most $184k (30.6% below list).
- To meet the 1% rule (rent ≥ 1% of price), the offer needs to be $184k (30.7% below list).
- Recommended offer: $184k (30.7% below list) — sets the bar for 1% rule.
Location & tenants
- Location reads 81/100 on livability (#74 in IA, #1,589 nationally) — a professional / high-income tenant draw. Strengths: commute A+, cost of living A+, housing A+; Watch: crime F, employment D-.
- Waterloo Community School District (urban): math 50% / reading 54% proficiency, ranked #276 of 289 in IA (top 96%) — acceptable for families but not a draw, mixed tenant base, ~2y average lease.
- Zoned schools: Fred Becker Elementary School (math 57% / reading 47%, grade C-, #494 of 616 statewide, top 83%, 473 students, 76% FRL); East High School (math 39% / reading 58%, grade D, #317 of 336 statewide, top 94%, 1,022 students, 73% FRL) — zoned schools average 74% FRL vs 58% district-wide (16 pts higher); higher-poverty schools than district average — tighter screening recommended.
- Market conditions: Rents rising (+3.8%/yr); 282 active listings in the ZIP; 3 comparable units currently listed for rent nearby; rentals lingering (median 44d on market — plan ~5-8 weeks vacancy on turnover, expect pricing pressure); 67% of comp listings sitting > 30 days — soft ceiling on asking rent; 287 units permitted in Black Hawk County in 2024 (67 in 5+ unit buildings).
- This rent runs 36% of the median local income ($61k/yr) — at the standard rent-burdened threshold; future hikes will face affordability resistance.
Forward outlook
- Local home prices are declining (-3.0%/yr); year-one equity from $2k of loan paydown is wiped out by about $8k of value loss. Plan a longer hold.
- Black Hawk County population projected at +10% by 2050 — modest demand growth; plan on rents tracking national, not racing it.
Negotiation context
- Only 1 days on market — expect competitive offers; lowballing is unlikely to land.
- Current owner paid $143k; list at $265k implies a 85% gain — meaningful room to come down on a strong offer.
Questions for the listing agent
- What do current leases actually rent for vs. the listed asking? Can we see a recent rent roll and the last 12 months of T-12 income?
- Can we see the unit-by-unit rent roll, current vacancy, and any below-market leases? What's the average tenancy length?
- What capital expenditures (roof, boiler, parking lot, exteriors) have been made in the last 5 years, and what's planned in the next 2?
- Is there a deadline driving the sale (1031 exchange, divorce, estate, relocation)? That informs how much negotiation room exists.
- Crime grade is F in this area — have there been break-ins, vandalism, or insurance claims at this property in the last 3 years? What carrier currently insures it and at what premium?
- The area grade is low — what's the realistic commute time and amenity access for the typical tenant pool here? Any planned neighborhood developments (good or bad) we should know about?
- What's the average days-on-market for RENTAL listings here right now (not sales)? A rising rental-DOM trend means longer vacancies and softer asking-rent achievability than the comps imply.
- What's the recent tenant-quality profile in this submarket — average credit score on applications, eviction rate, late-payment / NSF rate, and stable-employment percentage? A property-management company in the area should have these aggregated.
- How much new apartment / multifamily construction is in the pipeline within 1–3 miles? Heavy new supply (>2% of stock underway) typically softens rents 12–24 months out; light construction supports rent growth.
Investment metrics
- 1% rule
- 0.69% ✗
- Cap rate
- 4.22%
- Cash-on-cash
- -7.42%
- DSCR
- 0.67
- GRM
- 12.0
CMA / ARV
- ARV (on-the-fly)
- $306,432
- Comps found
- 1
Show comp detail 1 sale within ~0.75 mi
| Address | Dist | Beds/Ba | Sqft | Sold | Price | $/sf | Match |
|---|---|---|---|---|---|---|---|
| 2114 Cardinal Dr | 0.31mi | 4/2.0 | 1,636 (-10%) | 18mo | $275,000 | $168 | 52 |
Match score weights: distance 35% · size 25% · config 20% · recency 20%. Top-matched comps best support the ARV.
Projected returns pro-forma
-3.0% appreciation · 3.8% rent growth · sell at horizon
- IRR
- -28.3%
- Equity multiple
- 0.05×
- Total profit
- $-70,559
- Equity at exit
- $39,497
- IRR
- -24.3%
- Equity multiple
- -0.25×
- Total profit
- $-92,516
- Equity at exit
- $22,904
Cash invested: $74,172 (down + closing). Projections, not guarantees.
Landlord ↔ Tenant lean methodology
- Overall (STATE)
- 83 Strongly Landlord-Friendly
- State Iowa
- 83 Strongly Landlord-Friendly · R+6
- County
- — inherits STATE
- City
- — inherits STATE
ZIP-level market 50701
- Rents YoY
- 3.8%
- Active inventory
- 282
- Price-to-rent
- 24.0×
Monthly cashflow live
- Estimated rent
- $1,837 high interval (Pro) →
- Mortgage (P&I)
- −$1,389
- Tax from tax record
- −$410 /mo · $4,922/yr
- Insurance
- −$110
- HOA
- −$0
- Vacancy / Maint / Mgmt
- −$386
- Net cashflow
- $-458
Break-even live
2-unit breakdown (identical units grouped — click to expand)
| Units | Beds | Baths | Est. rent |
|---|---|---|---|
| 2× units | 2 | 1 | $1,836 |
| #1 | 2 | 1 | $918 |
| #2 | 2 | 1 | $918 |
| Total (2 units) | $1,837 | ||
UW: 25.0% down · 7.5% · 30yr · 1.5% tax · 5.0% vac · 8.0% maint · 8.0% mgmt
Financing live
Cash to close
- Down payment
- $66,225
- Closing costs
- $7,947
- Reserves months
- —
- Total cash needed
- —
Loan-product check · same deal, 3 products live
Conventional
25% down · 7.5% · 30yr
- Down + closing
- —
- Monthly P&I
- —
- Monthly cashflow
- —
- DSCR
- —
- Eligible?
- —
Personal DTI + credit; lowest rate.
DSCR
20% down · 8.5% · 30yr
- Down + closing
- —
- Monthly P&I
- —
- Monthly cashflow
- —
- DSCR
- —
- Eligible?
- —
No personal income docs; deal must DSCR.
Hard money
10% down · 12.0% · 12mo
- Down + closing
- —
- Monthly P&I
- —
- Monthly cashflow
- —
- DSCR
- —
- Eligible?
- —
Short-term bridge; refi at stabilization.
Rent comps 3 comps
| Address | Beds | Baths | Sqft | Rent | $/sqft | DOM | Units | Dist |
|---|---|---|---|---|---|---|---|---|
| 1915 Mayfair St Waterloo, IA | 4.0 | 2.5 | 2300 | $2,100 | $0.91 | 43d | 1 | 0.29mi |
| 3856 Jay Ln Waterloo, IA | 3.0 | 3.5 | 1520 | $1,975 | $1.30 | 43d | 1 | 0.63mi |
| 1247 Doreen Ave Waterloo, IA | 4.0 | 1.0 | 1288 | $1,500 | $1.16 | 21d | 1 | 1.48mi |
Listing history 3 events
-
2026-06-03status $264,900 Pending 1 DOM
-
2026-06-01remarks 699-char remark
-
2026-06-01$264,900 Active 1 DOM
ⓘ Source: listings_history table (triggers on properties + properties_extension) + one-shot
backfill from property_details.listing_events for pre-trigger history.
Tax reassessment forecast IA · Partial reset (capped growth)
- Current annual tax
- $4,922 · $410/mo
- Projected year-2 tax
- $4,922 · $410/mo
- Expected delta
- $0/yr ($0/mo · 0.0%)
ⓘ Screening estimate from a state-policy table — verify with the county assessor before closing.
Climate risk First Street
- Flood 1/10 Low FEMA zone X (unshaded) · 0% chance over 30 yrs
- Wildfire 1/10 Low
- Heat 3/10 Moderate 7 d/yr ≥101°F today · 15 d/yr by 30 yrs out
- Wind 2/10 Low
- Air quality 1/10 Low 0 unhealthy d/yr today · 0 by 30 yrs out
Nearby sold comps map
Loading sold comps map…
Walkable amenities ~0.75 mi
Loading nearby amenities…
Taxation est. · year 1
- Rental income
- $22,044
- − Mortgage interest
- −$14,839
- − Property taxes
- −$4,922
- − Insurance
- −$1,324
- − Repairs & maintenance
- −$1,764
- − Management
- −$1,764
- − Depreciation
- −$7,706
- Taxable loss
- −$10,274
- Est. tax savings @ 24.0%
- +$2,466
- After-tax cash flow
- $-3,036/yr
For passive investors: Depreciation is non-cash, so a rental often shows a tax loss while cash-flowing — sheltering income. Rental losses are passive: they offset passive income freely, and up to $25,000/yr can offset ordinary (W-2) income if you actively participate and your MAGI is under $100k (phasing out to $0 by $150k); unused losses carry forward. On sale, claimed depreciation is recaptured at up to 25%, and gains may owe capital-gains tax (a 1031 exchange can defer both). Figures are a year-1 estimate at your 24.0% rate — not tax advice; consult a CPA.
Schools (NCES district)
- District
- Waterloo Community School District
- NCES district ID
- 1930480
- Math proficiency
- 50% ▼ -4.00%
- Reading proficiency
- 54% ▲ 1.00%
- Median HH income
- $42,545
- Composite
- 43.72/100
- National rank
- #2950
- State rank
- #276 of 289 in IA
Livability — Waterloo
- Score
- 81/100
- State rank
- #74
- US rank
- #1589
Category grades
Schools grade is shown separately in the Schools card above.
Census & demographics
- Census place
- Waterloo, IA
- County
- Black Hawk County · 112,933 people
- City population
- 69,066
- Metro
- Waterloo-Cedar Falls, IA
- Population (ZIP)
- 30,232
- Household income
- $61,475
- Rent vs Own
- Severe rent burden
- 1377.0
Population outlook (Black Hawk County) Hauer SSP2
- Today (2025)
- 139,716 people
- By 2030
- 142,853 · +2.2%
- By 2040
- 147,843 · +5.8%
- By 2050
- 153,247 · +9.7%
- By 2075
- 167,977 · +20.2%
- By 2100
- 177,320 · +26.9%
Race, ethnicity, and origin ACS 2023
- Neighborhood character
- Predominantly White (78%)
- Race & ethnicity
- White 78% Black 11% Two or more races 5% Hispanic / Latino 3% Asian 3%
- Common ancestry
- Portuguese 3% Italian 3% American 2%
- Foreign-born
- 7% · Canada, South Korea, Vietnam
- Languages at home
- 92% English-only · Russian/Polish/Slavic 2% Spanish 2% French/Haitian/Cajun 2%
Political lean MEDSL · Black Hawk
- 2024 margin
- Toss-up / Even · D 50.0% · R 48.8% · Other 1.2%
- 2008→2024 swing
- -21.3pp toward R · 2008: 22.4pp · 2024: 1.2pp
- All cycles
- 2024: D+1.2 2020: D+9.0 2016: D+7.3 2012: D+20.0 2008: D+22.4
Not yet ingested
- Civics
- —
Market trends
- HPI YoY
- ▼ -107.19%
- Current HPI
- 162.8951
- Rent YoY
- ▲ 3.80%
- Metro
- Waterloo-Cedar Falls, IA
- State GDP YoY
- ▲ 2.48%
- F500 in state
- 4
Industry mix (Fortune 500 HQ in IA)
| Industry | F500 HQs | Revenue |
|---|---|---|
| Financial Services | 1 | $16B |
|
||
| Retail / Convenience | 1 | $15B |
|
||
Price history
+85.2% since first listed2 events — show timeline
- 2026-06-01 Listed $264,900 NEIRBR as distributed by MLS GRID
- 2011-05-17 Sold (Public Records) $143,000 Public Records
Property tax history
+3.0%/yrLatest (2025): $4,922 · +8.5% YoY. Source: county tax records.
Cash-flow waterfall
monthlySold comps — $/sqft
last 12 mo · ≤1 miLoading sold comps…