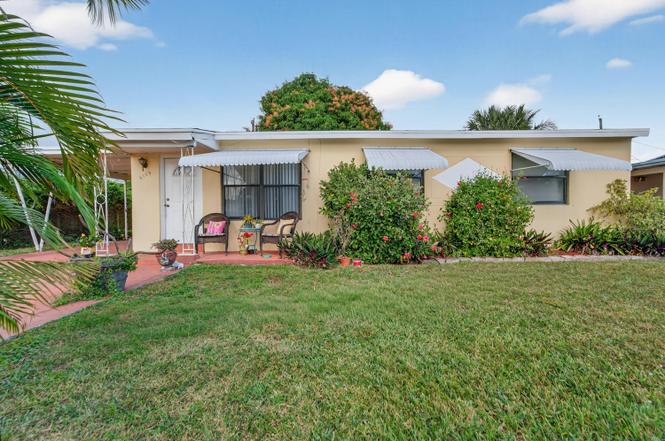
2105 Worthington Rd · West Palm Beach, FL
Flood risk 4/10 · Minor
- FEMA flood zone
- X (unshaded)
- Chance of flooding over 30 yrs
- 0.22%
- Est. flood insurance / yr
- $507 – $1,088
Fire risk 1/10 · Minimal
- Est. fire insurance / yr
- $947 – $1,759
Heat risk 10/10 · Severe
- Hot days now (above 105°F)
- 7 days/yr
- Hot days in 30 yrs
- 25 days/yr
Wind risk 10/10 · Severe
- Chance of severe wind over 30 yrs
- 99.0%
Air-quality risk 2/10 · Minimal
- Unhealthy air days now
- 1 days/yr
- Unhealthy air days in 30 yrs
- 1 days/yr
Risk factors via First Street. Map © Google.
Why this score? — see what drove the C- grade
The composite is a weighted blend of 9 inputs, each scored 0–100. Each bar is that input's sub-score; the figure is the points it added to the 100-point composite (weight × sub-score).
- Cash flow +22.1/30.0
- ARV discount +7.5/15.0
- DSCR +7.1/10.0
- 1% rule +4.5/10.0
- Schools +4.3/10.0
- Livability +4.1/5.0
- Rent growth +2.5/5.0
- Condition / age +2.5/5.0
- Appreciation +0.0/10.0
$319,000
🖨 Deal sheet (PDF) 📄 Offer letter ✓ Due diligence
Listing remarks
Located in the established 33409 corridor of West Palm Beach, this single-family home offers 912 sq ft of living space on a 6,000 sq ft lot, making it a strong option for investors or buyers seeking value in a central location. The property benefits from close proximity to major roadways, downtown West Palm Beach, shopping, dining, and everyday conveniences, all of which support long-term demand in this area. With a functional footprint and room to add value, this probate property is well suited for renovation, rental, or personal use. Offered as-is, it presents a solid opportunity for buyers looking to capitalize on location and future upside in Palm Beach County.
Key facts
- 6,000 sq ft lot
- Parking
- Built 1959
Neighborhood map
What this means for you Summary
Snapshot
- This is a 2-bed/1.0-bath single-family listed at $319k.
Deal economics
- At list price, monthly cash flow is $515 ($6k/yr) — positive.
- The deal already cash-flows at list — no discount required.
- To meet the 1% rule (rent ≥ 1% of price), the offer needs to be $302k (5.2% below list).
- Recommended offer: $302k (5.2% below list) — sets the bar for 1% rule.
- Cap rate 8.2% vs local median 3.8% in West Palm Beach — top-decile yield for the area; either an underpriced asset or a hidden risk that comps aren't pricing in. Stress-test before assuming the spread holds.
Location & tenants
- Location reads 82/100 on livability (#75 in FL, #1,255 nationally) — a professional / high-income tenant draw. Strengths: commute A+, housing A+, health & safety A+; Watch: employment C-, crime F.
- Palm Beach (suburban): math 46% / reading 53% proficiency, ranked #34 of 73 in FL (top 47%) — families likely to look elsewhere, expect single-tenant / working-renter base with shorter leases.
- Market conditions: Rents soft (-0.1%/yr); 189 active listings in the ZIP; 23 comparable units currently listed for rent nearby; rentals at typical pace (median 18d on market — plan ~3-4 weeks tenant-placement turnaround); 3,974 units permitted in Palm Beach County in 2024 (1,012 in 5+ unit buildings).
- At $3,023/mo this rent would consume 54% of the median local household income ($67k/yr) (locally 1333% of renters already pay >50% of income on rent) — very limited rent-growth headroom before tenants either downsize or default.
Forward outlook
- Local home prices are declining (-3.0%/yr); year-one equity from $2k of loan paydown is wiped out by about $10k of value loss. Plan a longer hold.
- Palm Beach County population projected at +30% by 2050 — long-run rental-demand tailwind backs the buy-and-hold thesis.
Negotiation context
- Only 8 days on market — expect competitive offers; lowballing is unlikely to land.
- 3 sale attempts with the ask held roughly flat each time — persistent listings suggest the price (not the market) is what's stuck; bring a comps-based counter.
Risks & watch-outs
- Watch-outs: built in 1959 — expect roof / HVAC / electrical / plumbing capex.
- Climate carrying-cost: severe wind risk, 99% chance of damaging wind over 30y; extreme-heat days projected 7→25/yr by 2055 (HVAC capex compounding) — expect insurance premiums to compound above CPI over the hold.
Questions for the listing agent
- Built in 1959 — when were the roof, HVAC, electrical panel, plumbing, and water heater last replaced?
- Is there a deadline driving the sale (1031 exchange, divorce, estate, relocation)? That informs how much negotiation room exists.
- Crime grade is F in this area — have there been break-ins, vandalism, or insurance claims at this property in the last 3 years? What carrier currently insures it and at what premium?
- What's the average days-on-market for RENTAL listings here right now (not sales)? A rising rental-DOM trend means longer vacancies and softer asking-rent achievability than the comps imply.
- What's the recent tenant-quality profile in this submarket — average credit score on applications, eviction rate, late-payment / NSF rate, and stable-employment percentage? A property-management company in the area should have these aggregated.
- How much new for-sale + rental construction is in the pipeline within 1–3 miles? Heavy new supply typically softens prices + rents 12–24 months out; constrained supply supports both.
Investment metrics
- 1% rule
- 0.95% ✗
- Cap rate
- 8.23%
- Cash-on-cash
- 6.91%
- DSCR
- 1.31
- GRM
- 8.8
CMA / ARV
No comps found within radius.
Projected returns pro-forma
-3.0% appreciation · 0.0% rent growth · sell at horizon
- IRR
- -8.8%
- Equity multiple
- 0.69×
- Total profit
- $-27,932
- Equity at exit
- $47,564
- IRR
- -3.2%
- Equity multiple
- 0.81×
- Total profit
- $-16,995
- Equity at exit
- $27,581
Cash invested: $89,320 (down + closing). Projections, not guarantees.
Landlord ↔ Tenant lean methodology
- Overall (STATE)
- 87 Strongly Landlord-Friendly
- State Florida
- 87 Strongly Landlord-Friendly · R+3
- County
- — inherits STATE
- City
- — inherits STATE
ZIP-level market 33409
- Home prices YoY
- -25.6%
- Rents YoY
- -0.1%
- Active inventory
- 189
- Price-to-rent
- 8.8×
Monthly cashflow live
- Estimated rent
- $3,023 high interval (Pro) →
- Mortgage (P&I)
- −$1,673
- Tax from tax record
- −$68 /mo · $812/yr
- Insurance
- −$133
- HOA
- −$0
- Vacancy / Maint / Mgmt
- −$635
- Net cashflow
- $515
Break-even live
Sensitivity live
| Price | -10% $695 | -5% $605 | +0% $515 | +5% $424 | +10% $334 |
|---|---|---|---|---|---|
| Rent | -10% $276 | -5% $395 | +0% $515 | +5% $634 | +10% $753 |
| Rate | -1.0pp $675 | -0.5pp $596 | base $515 | +0.5pp $432 | +1.0pp $348 |
UW: 25.0% down · 7.5% · 30yr · 1.5% tax · 5.0% vac · 8.0% maint · 8.0% mgmt
Financing live
Cash to close
- Down payment
- $79,750
- Closing costs
- $9,570
- Reserves months
- —
- Total cash needed
- —
Loan-product check · same deal, 3 products live
Conventional
25% down · 7.5% · 30yr
- Down + closing
- —
- Monthly P&I
- —
- Monthly cashflow
- —
- DSCR
- —
- Eligible?
- —
Personal DTI + credit; lowest rate.
DSCR
20% down · 8.5% · 30yr
- Down + closing
- —
- Monthly P&I
- —
- Monthly cashflow
- —
- DSCR
- —
- Eligible?
- —
No personal income docs; deal must DSCR.
Hard money
10% down · 12.0% · 12mo
- Down + closing
- —
- Monthly P&I
- —
- Monthly cashflow
- —
- DSCR
- —
- Eligible?
- —
Short-term bridge; refi at stabilization.
Rent comps 23 comps
| Address | Beds | Baths | Sqft | Rent | $/sqft | DOM | Units | Dist |
|---|---|---|---|---|---|---|---|---|
| 2018 Whitney Rd West Palm Beach, FL | 3.0 | 2.0 | 1169 | $3,100 | $2.65 | 0d | 1 | 0.10mi |
| 1500 Centrepark Blvd West Palm Beach, FL | 2.0 | 1.0–2.0 | 862 | $3,015 | $3.50 | 0d | 18 | 0.43mi |
| 2615 Hiawatha Ave West Palm Beach, FL | 3.0 | 2.0 | 1276 | $2,950 | $2.31 | 3d | 1 | 0.94mi |
| 2665 Hiawatha Ave West Palm Beach, FL | 3.0 | 2.0 | 1276 | $3,005 | $2.36 | 25d | 1 | 0.95mi |
| 2671 Hiawatha Ave West Palm Beach, FL | 3.0 | 2.0 | 1276 | $3,005 | $2.36 | 25d | 1 | 0.95mi |
| 2677 Hiawatha Ave West Palm Beach, FL | 3.0 | 2.0 | 1276 | $3,005 | $2.36 | 25d | 1 | 0.96mi |
| 2683 Hiawatha Ave West Palm Beach, FL | 3.0 | 2.0 | 1276 | $3,005 | $2.36 | 25d | 1 | 0.96mi |
| 2689 Hiawatha Ave West Palm Beach, FL | 3.0 | 2.0 | 1276 | $2,950 | $2.31 | 3d | 1 | 0.97mi |
| 1050 Blanche St West Palm Beach, FL | 2.0 | 1.0–2.0 | 740 | $3,374 | $4.56 | 3d | 8 | 0.98mi |
| 1911 Parker Ave West Palm Beach, FL | 2.0 | 2.0 | 1135 | $14,000 | $12.33 | 25d | 1 | 1.15mi |
| 904 Ortega Rd West Palm Beach, FL | 3.0 | 1.0 | 910 | $3,500 | $3.85 | 6d | 1 | 1.19mi |
| 833 Ardmore Rd West Palm Beach, FL | 3.0 | 2.5 | 1132 | $4,500 | $3.98 | 16d | 1 | 1.21mi |
| 833 Ardmore Rd West Palm Beach, FL | 3.0 | 2.5 | 1132 | $4,500 | $3.98 | 17d | 1 | 1.21mi |
| 616 Clearwater Park Rd West Palm Beach, FL | 2.0 | 2.0 | 1090 | $3,248 | $2.98 | 12d | 3 | 1.40mi |
| 616 Clearwater Park Rd West Palm Beach, FL | 2.0 | 2.0 | 1090 | $3,348 | $3.07 | 14d | 2 | 1.40mi |
| 616 Clearwater Park Rd West Palm Beach, FL | 2.0 | 2.0 | 1130 | $3,245 | $2.87 | 3d | 3 | 1.40mi |
| 616 Clearwater Park Rd West Palm Beach, FL | 2.0 | 2.0 | 1112 | $3,348 | $3.01 | 6d | 2 | 1.40mi |
| 290 Courtney Lakes Cir West Palm Beach, FL | 1.0–3.0 | 1.0–2.0 | 1069 | $2,705 | $2.53 | 20d | 19 | 1.40mi |
| 616 Clearwater Park Rd Unit Lp01 West Palm Beach, FL | 2.0 | 2.0 | 1112 | $3,495 | $3.14 | 25d | 1 | 1.42mi |
| 616 Upland Rd West Palm Beach, FL | 3.0 | 2.0 | 1456 | $4,500 | $3.09 | 25d | 1 | 1.45mi |
| 616 Upland Rd West Palm Beach, FL | 3.0 | 2.0 | 1456 | $4,500 | $3.09 | 21d | 1 | 1.45mi |
| 1713 Florida Ave Unit A2 West Palm Beach, FL | 2.0 | 1.0 | 888 | $3,500 | $3.94 | 25d | 1 | 1.47mi |
| 605 Sunset Rd West Palm Beach, FL | 3.0 | 2.0 | 1434 | $4,000 | $2.79 | 25d | 1 | 1.48mi |
Listing history 5 events
-
2026-03-11status Pending
-
2026-01-16status Pending
-
2026-01-15status Active
-
2026-01-08Active Under Contract
-
2026-01-08$319,000
ⓘ Source: listings_history table (triggers on properties + properties_extension) + one-shot
backfill from property_details.listing_events for pre-trigger history.
Tax reassessment forecast FL · Resets to sale price
- Current annual tax
- $812 · $68/mo
- Projected year-2 tax
- $2,648 · $221/mo
- Expected delta
- +$1,835/yr (+$153/mo · 225.9%)
ⓘ Screening estimate from a state-policy table — verify with the county assessor before closing.
Climate risk First Street
- Flood 4/10 Moderate FEMA zone X (unshaded) · 22% chance over 30 yrs
- Wildfire 1/10 Low
- Heat 10/10 Extreme 7 d/yr ≥105°F today · 25 d/yr by 30 yrs out
- Wind 10/10 Extreme 99% chance of damaging wind over 30 yrs
- Air quality 2/10 Low 1 unhealthy d/yr today · 1 by 30 yrs out
Nearby sold comps map
Loading sold comps map…
Walkable amenities ~0.75 mi
Loading nearby amenities…
Taxation est. · year 1
- Rental income
- $36,275
- − Mortgage interest
- −$17,869
- − Property taxes
- −$812
- − Insurance
- −$1,595
- − Repairs & maintenance
- −$2,902
- − Management
- −$2,902
- − Depreciation
- −$9,280
- Taxable income
- $915
- Est. tax owed @ 24.0%
- −$220
- After-tax cash flow
- $5,956/yr
For passive investors: Depreciation is non-cash, so a rental often shows a tax loss while cash-flowing — sheltering income. Rental losses are passive: they offset passive income freely, and up to $25,000/yr can offset ordinary (W-2) income if you actively participate and your MAGI is under $100k (phasing out to $0 by $150k); unused losses carry forward. On sale, claimed depreciation is recaptured at up to 25%, and gains may owe capital-gains tax (a 1031 exchange can defer both). Figures are a year-1 estimate at your 24.0% rate — not tax advice; consult a CPA.
Schools (NCES district)
- District
- Palm Beach
- NCES district ID
- 1201500
- Math proficiency
- 46% ▼ -16.00%
- Reading proficiency
- 53% ▼ -4.00%
- Median HH income
- $53,943
- Composite
- 42.72/100
- National rank
- #3160
- State rank
- #34 of 73 in FL
Livability — West Palm Beach
- Score
- 82/100
- State rank
- #75
- US rank
- #1255
Category grades
Schools grade is shown separately in the Schools card above.
Census & demographics
- County
- Palm Beach County · 1,438,312 people
- City population
- 222,012
- Metro
- Miami-Fort Lauderdale-Pompano Beach, FL
- Population (ZIP)
- 33,489
- Household income
- $67,073
- Rent vs Own
- Severe rent burden
- 1333.0
Population outlook (Palm Beach County) Hauer SSP2
- Today (2025)
- 1,637,487 people
- By 2030
- 1,743,255 · +6.5%
- By 2040
- 1,948,712 · +19.0%
- By 2050
- 2,132,979 · +30.3%
- By 2075
- 2,530,027 · +54.5%
- By 2100
- 2,706,979 · +65.3%
Race, ethnicity, and origin ACS 2023
- Neighborhood character
- Highly diverse neighborhood (Simpson 0.70)
- Race & ethnicity
- Hispanic / Latino 36% Black 31% White 27% Two or more races 21% Asian 2%
- Hispanic origin (detail)
- Mexican 4% Puerto Rican 4% Cuban 8% Dominican 1%
- Common ancestry
- Hispanic 8% Romanian 1% Lithuanian 1%
- Foreign-born
- 34% · Canada, Jamaica
- Languages at home
- 55% English-only · Spanish 30% French/Haitian/Cajun 10% Other Indo-European 2%
Political lean MEDSL · Palm Beach
- 2024 margin
- Toss-up / Even · D 50.0% · R 49.2%
- 2008→2024 swing
- -22.1pp toward R · 2008: 22.9pp · 2024: 0.8pp
- All cycles
- 2024: D+0.8 2020: D+12.8 2016: D+15.3 2012: D+17.0 2008: D+22.9
Not yet ingested
- Civics
- —
Market trends
- HPI YoY
- ▼ -128.54%
- Current HPI
- 374.2506
- Rent YoY
- ▼ -0.15%
- Metro
- Miami-Fort Lauderdale-Pompano Beach, FL
- State GDP YoY
- ▲ 3.28%
- F500 in state
- 36
Industry mix (Fortune 500 HQ in FL)
| Industry | F500 HQs | Revenue |
|---|---|---|
| Industrial Technology | 2 | $29B |
|
||
| Insurance | 2 | $17B |
|
||
| Retail | 1 | $60B |
|
||
| Technology Distribution | 1 | $58B |
|
||
| Homebuilding | 1 | $35B |
|
||
| Technology Manufacturing | 1 | $35B |
|
||
Price history
5 events — show timeline
- 2026-03-11 Pending — Beaches MLS
- 2026-01-16 Pending — Beaches MLS
- 2026-01-15 Relisted — Beaches MLS
- 2026-01-08 Listed — Beaches MLS
- 2026-01-08 Listed $319,000 Beaches MLS
Property tax history
+1.5%/yrLatest (2025): $812 · +4.5% YoY. Source: county tax records.
Cash-flow waterfall
monthlySold comps — $/sqft
last 12 mo · ≤1 miLoading sold comps…