2316 E 15th Ave · Sheffield, AL
Flood risk 1/10 · Minimal
- FEMA flood zone
- X (unshaded)
- Chance of flooding over 30 yrs
- 0.0%
- Est. flood insurance / yr
- $507 – $1,088
Fire risk 3/10 · Minor
- Est. fire insurance / yr
- $916 – $1,700
Heat risk 6/10 · Moderate
- Hot days now (above 108°F)
- 7 days/yr
- Hot days in 30 yrs
- 20 days/yr
Wind risk 4/10 · Minor
- Chance of severe wind over 30 yrs
- 21.0%
Air-quality risk 2/10 · Minimal
- Unhealthy air days now
- 0 days/yr
- Unhealthy air days in 30 yrs
- 1 days/yr
Risk factors via First Street. Map © Google.
Why this score? — see what drove the B grade
The composite is a weighted blend of 9 inputs, each scored 0–100. Each bar is that input's sub-score; the figure is the points it added to the 100-point composite (weight × sub-score).
- Cash flow +30.0/30.0
- ARV discount +15.0/15.0
- 1% rule +10.0/10.0
- DSCR +10.0/10.0
- Livability +3.0/5.0
- Rent growth +2.5/5.0
- Condition / age +2.5/5.0
- Schools +1.9/10.0
- Appreciation +0.0/10.0
$44,900
🖨 Deal sheet 📄 Offer letter ✓ Due diligence
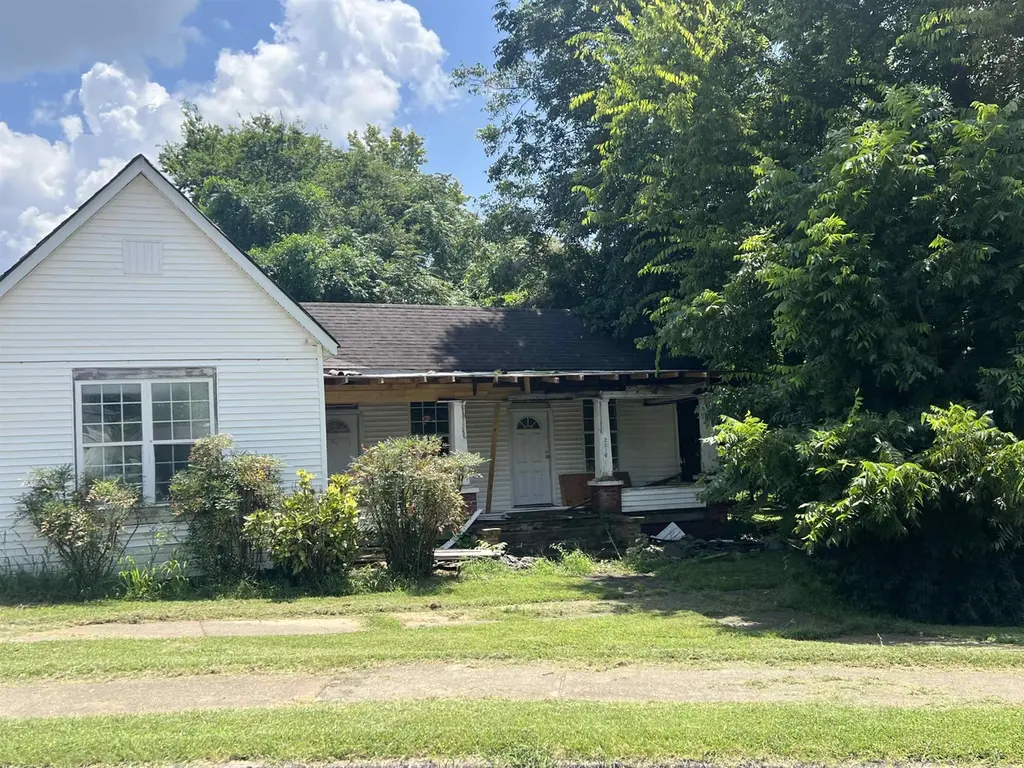
Listing remarks MLS
Great opportunity for investor! Home is situated on a nice big lot downtown Sheffield. Close to school, shopping, restaurants etc. .. This area is seeing a lot of home revitalizations and will be a great fixer upper for flipping, renting, or to live in. You can rarely even find a lot to build on for the price of this home. All info to be verified by purchaser. Priced for quick sale!
Key facts
- Big lot
- Downtown sheffield
- Home revitalizations
Tags
Neighborhood map
What this means for you Summary
Snapshot
- This is a 3-bed/1.0-bath single-family listed at $45k.
Deal economics
- At list price, monthly cash flow is $537 ($6k/yr) — positive.
- The deal already cash-flows at list — no discount required.
- Meets the 1% rule at list price ($1k rent vs $45k).
- Recommended offer: $40k (12.0% below list) — sets the bar for market timing.
- Cap rate 20.6% vs local median 5.1% in Sheffield — top-decile yield for the area; either an underpriced asset or a hidden risk that comps aren't pricing in. Stress-test before assuming the spread holds.
Location & tenants
- Location reads 60/100 on livability (#312 in AL) — a middle-class / working-renter tenant base. Strengths: cost of living A+, housing A+; Watch: schools F, crime F, amenities F.
- Sheffield City (suburban): math 12% / reading 34% proficiency, ranked #103 of 129 in AL (top 80%) — low school quality limits family demand, transient renter base, plan for 1-2y turnover; 74% free/reduced lunch — lower-income household profile, screen leases tightly.
- Market conditions: 115 active listings in the ZIP; 3 comparable units currently listed for rent nearby; rentals lingering (median 44d on market — plan ~5-8 weeks vacancy on turnover, expect pricing pressure); 100% of comp listings sitting > 30 days — soft ceiling on asking rent; 91 units permitted in Colbert County in 2024 (0 in 5+ unit buildings).
Forward outlook
- Local home prices are declining (-3.0%/yr); year-one equity from $310 of loan paydown is wiped out by about $1k of value loss. Plan a longer hold.
- Colbert County population projected to shrink 7% by 2050 — rents likely to lag national; underwrite the cash flow, not the appreciation.
- At projected returns (-3.0% appreciation + 3.0% rent growth), your $13k cash investment doubles in ~3 years — after that, you're playing with house money.
Negotiation context
- It's been on market 326 days — a 12% lower offer ($40k) is reasonable based on typical stale-listing flexibility.
- Current owner paid $15k; list at $45k implies a 199% gain — meaningful room to come down on a strong offer.
Risks & watch-outs
- Climate carrying-cost: extreme-heat days projected 7→20/yr by 2055 (HVAC capex compounding) — expect insurance premiums to compound above CPI over the hold.
Questions for the listing agent
- It's been on market 326 days. Have you received any prior offers? Is the seller open to a 12% concession, seller financing, or rate buy-down credit?
- Why hasn't it sold? Are there any deal-killer items the seller is aware of (foundation, flood, title, zoning, code violations)?
- Is there a deadline driving the sale (1031 exchange, divorce, estate, relocation)? That informs how much negotiation room exists.
- Schools are F-rated, which usually means shorter tenancies and higher turnover. Who's the typical renter profile here, and what's been the actual vacancy rate?
- Crime grade is F in this area — have there been break-ins, vandalism, or insurance claims at this property in the last 3 years? What carrier currently insures it and at what premium?
- What's the average days-on-market for RENTAL listings here right now (not sales)? A rising rental-DOM trend means longer vacancies and softer asking-rent achievability than the comps imply.
- What's the recent tenant-quality profile in this submarket — average credit score on applications, eviction rate, late-payment / NSF rate, and stable-employment percentage? A property-management company in the area should have these aggregated.
- How much new for-sale + rental construction is in the pipeline within 1–3 miles? Heavy new supply typically softens prices + rents 12–24 months out; constrained supply supports both.
Investment metrics
- 1% rule
- 2.28% ✓
- Cap rate
- 20.64%
- Cash-on-cash
- 51.25%
- DSCR
- 3.28
- GRM
- 3.7
CMA / ARV
- ARV (median comp)
- $86,032
- List price
- $44,900
- Delta
- -47.81%
- Verdict
- UNDERPRICED
- Comps
- 20 within 1.0 mi
Show comp detail 12 sales within ~0.75 mi
| Address | Dist | Beds/Ba | Sqft | Sold | Price | $/sf | Match |
|---|---|---|---|---|---|---|---|
| 409 N Atlanta Ave | 0.19mi | 2/1.0 (-1) | 1,340 (+3%) | 9mo | $152,000 | $113 | 73 |
| 1510 E 29th St | 0.51mi | 3/1.0 | 1,279 (-2%) | 5mo | $128,400 | $100 | 70 |
| 503 Austin Ave | 0.51mi | 3/1.0 | 1,274 (-2%) | 6mo | $98,000 | $77 | 68 |
| 2612 E 17th Ave | 0.31mi | 3/1.0 | 1,210 (-7%) | 8mo | $71,550 | $59 | 68 |
| 803 SE 20th St | 0.69mi | 3/1.0 | 1,345 (+4%) | 1mo | $50,000 | $37 | 61 |
| 607 E 12th St | 0.58mi | 3/2.0 | 1,368 (+5%) | 3mo | $140,000 | $102 | 58 |
| 1217 Greer St | 0.71mi | 3/1.5 | 1,386 (+7%) | 2mo | $182,900 | $132 | 52 |
| 1503 28th St | 0.35mi | 3/2.0 | 1,462 (+12%) | 8mo | $125,000 | $85 | 52 |
| 401 St Louis Ave | 0.68mi | 3/2.0 | 1,218 (-6%) | 3mo | $165,000 | $135 | 52 |
| 1305 Gordon Dr | 0.69mi | 3/2.0 | 1,212 (-7%) | 1mo | $80,000 | $66 | 51 |
| 505 St Louis Ave | 0.69mi | 3/1.0 | 1,145 (-12%) | 4mo | $70,000 | $61 | 45 |
| 301 River Bluff Dr | 0.70mi | 2/2.0 (-1) | 1,385 (+7%) | 9mo | $193,000 | $139 | 40 |
Match score weights: distance 35% · size 25% · config 20% · recency 20%. Top-matched comps best support the ARV.
Projected returns pro-forma
-3.0% appreciation · 3.0% rent growth · sell at horizon
- IRR
- 49.1%
- Equity multiple
- 3.14×
- Total profit
- $26,914
- Equity at exit
- $6,695
- IRR
- 54.6%
- Equity multiple
- 6.36×
- Total profit
- $67,436
- Equity at exit
- $3,882
Cash invested: $12,572 (down + closing). Projections, not guarantees.
Landlord ↔ Tenant lean methodology
- Overall (STATE)
- 90 Strongly Landlord-Friendly
- State Alabama
- 90 Strongly Landlord-Friendly · R+15
- County
- — inherits STATE
- City
- — inherits STATE
ZIP-level market 35660
- Home prices YoY
- -29.5%
- Active inventory
- 115
- Price-to-rent
- 3.7×
Monthly cashflow live
- Estimated rent
- $1,022 medium interval (Pro) →
- Mortgage (P&I)
- −$235
- Tax from tax record
- −$16 /mo · $194/yr
- Insurance
- −$19
- HOA
- −$0
- Vacancy / Maint / Mgmt
- −$215
- Net cashflow
- $537
Break-even live
UW: 25.0% down · 7.5% · 30yr · 1.5% tax · 5.0% vac · 8.0% maint · 8.0% mgmt
Financing live
Cash to close
- Down payment
- $11,225
- Closing costs
- $1,347
- Reserves months
- —
- Total cash needed
- —
Loan-product check · same deal, 3 products live
Conventional
25% down · 7.5% · 30yr
- Down + closing
- —
- Monthly P&I
- —
- Monthly cashflow
- —
- DSCR
- —
- Eligible?
- —
Personal DTI + credit; lowest rate.
DSCR
20% down · 8.5% · 30yr
- Down + closing
- —
- Monthly P&I
- —
- Monthly cashflow
- —
- DSCR
- —
- Eligible?
- —
No personal income docs; deal must DSCR.
Hard money
10% down · 12.0% · 12mo
- Down + closing
- —
- Monthly P&I
- —
- Monthly cashflow
- —
- DSCR
- —
- Eligible?
- —
Short-term bridge; refi at stabilization.
Rent comps 3 comps
| Address | Beds | Baths | Sqft | Rent | $/sqft | DOM | Units | Dist |
|---|---|---|---|---|---|---|---|---|
| 1010 N Nashville Ave Sheffield, AL | 2.0 | 2.0 | 1200 | $1,100 | $0.92 | 43d | 1 | 0.55mi |
| 3323 Oakwood Blvd Sheffield, AL | 2.0 | 1.0 | 1100 | $1,000 | $0.91 | 44d | 1 | 0.91mi |
| 100 Brink Ct Sheffield, AL | 2.0 | 2.0 | 1100 | $899 | $0.82 | 43d | 5 | 0.94mi |
Listing history 19 events
-
2026-06-19days on market $44,900 Active 326 DOM
-
2026-06-18days on market $44,900 Active 325 DOM
-
2026-06-17days on market $44,900 Active 324 DOM
-
2026-06-16days on market $44,900 Active 323 DOM
-
2026-06-15days on market $44,900 Active 322 DOM
-
2026-06-14days on market $44,900 Active 320 DOM
-
2026-06-13days on market $44,900 Active 319 DOM
-
2026-06-10days on market $44,900 Active 317 DOM
-
2026-06-09days on market $44,900 Active 316 DOM
-
2026-06-08days on market $44,900 Active 315 DOM
-
2026-06-07days on market $44,900 Active 314 DOM
-
2026-06-05days on market $44,900 Active 311 DOM
-
2026-06-02days on market $44,900 Active 309 DOM
-
2026-06-01days on market $44,900 Active 308 DOM
-
2026-05-31days on market $44,900 Active 307 DOM
-
2026-05-30days on market $44,900 Active 306 DOM
-
2025-07-28$44,900 Active 386-char remark
Show marketing remark (386 chars)
Great opportunity for investor! Home is situated on a nice big lot downtown Sheffield. Close to school, shopping, restaurants etc. .. This area is seeing a lot of home revitalizations and will be a great fixer upper for flipping, renting, or to live in. You can rarely even find a lot to build on for the price of this home. All info to be verified by purchaser. Priced for quick sale!
-
2020-07-30soldstatus $15,000
-
2020-03-16soldstatus $186,000
ⓘ Source: listings_history table (triggers on properties + properties_extension) + one-shot
backfill from property_details.listing_events for pre-trigger history.
Tax reassessment forecast AL · Resets to sale price
- Current annual tax
- $194 · $16/mo
- Projected year-2 tax
- $194 · $16/mo
- Expected delta
- $0/yr ($0/mo · 0.0%)
ⓘ Screening estimate from a state-policy table — verify with the county assessor before closing.
Climate risk First Street
- Flood 1/10 Low FEMA zone X (unshaded) · 0% chance over 30 yrs
- Wildfire 3/10 Moderate
- Heat 6/10 Major 7 d/yr ≥108°F today · 20 d/yr by 30 yrs out
- Wind 4/10 Moderate 21% chance of damaging wind over 30 yrs
- Air quality 2/10 Low 0 unhealthy d/yr today · 1 by 30 yrs out
Nearby sold comps map
Loading sold comps map…
Walkable amenities ~0.75 mi
Loading nearby amenities…
Taxation est. · year 1
- Rental income
- $12,262
- − Mortgage interest
- −$2,515
- − Property taxes
- −$194
- − Insurance
- −$224
- − Repairs & maintenance
- −$981
- − Management
- −$981
- − Depreciation
- −$1,306
- Taxable income
- $6,061
- Est. tax owed @ 24.0%
- −$1,455
- After-tax cash flow
- $4,989/yr
For passive investors: Depreciation is non-cash, so a rental often shows a tax loss while cash-flowing — sheltering income. Rental losses are passive: they offset passive income freely, and up to $25,000/yr can offset ordinary (W-2) income if you actively participate and your MAGI is under $100k (phasing out to $0 by $150k); unused losses carry forward. On sale, claimed depreciation is recaptured at up to 25%, and gains may owe capital-gains tax (a 1031 exchange can defer both). Figures are a year-1 estimate at your 24.0% rate — not tax advice; consult a CPA.
Schools (NCES district)
- District
- Sheffield City
- NCES district ID
- 0103000
- Math proficiency
- 12% ▼ -30.00%
- Reading proficiency
- 34% ▼ -1.00%
- Median HH income
- $34,188
- Composite
- 18.8/100
- National rank
- #8866
- State rank
- #103 of 129 in AL
Livability — Sheffield
- Score
- 60/100
- State rank
- #312
- US rank
- #19366
Category grades
Schools grade is shown separately in the Schools card above.
Census & demographics
- Census place
- Sheffield, AL
- City population
- 9,385
- Population (ZIP)
- 9,385
Population outlook (Colbert County) Hauer SSP2
- Today (2025)
- 54,154 people
- By 2030
- 53,746 · -0.8%
- By 2040
- 52,431 · -3.2%
- By 2050
- 50,303 · -7.1%
- By 2075
- 44,789 · -17.3%
- By 2100
- 36,676 · -32.3%
Race, ethnicity, and origin ACS 2023
- Neighborhood character
- Predominantly White (68%)
- Race & ethnicity
- White 68% Black 26% Two or more races 4% Hispanic / Latino 2%
- Common ancestry
- Slovak 1% Lithuanian 1% Serbian 1%
- Foreign-born
- 1% · Canada
- Languages at home
- 98% English-only · Spanish 2%
Political lean MEDSL · Colbert
- 2024 margin
- Solid R (+46.4) · D 26.4% · R 72.8%
- 2008→2024 swing
- -26.2pp toward R · 2008: -20.3pp · 2024: -46.4pp
- All cycles
- 2024: R+46.4 2020: R+38.9 2016: R+38.3 2012: R+20.4 2008: R+20.3
Not yet ingested
- Civics
- —
Market trends
- HPI YoY
- ▼ -74.23%
- Current HPI
- 177.3226
- Rent YoY
- —
- Metro
- —
- State GDP YoY
- ▲ 2.94%
- F500 in state
- 4
Industry mix (Fortune 500 HQ in AL)
| Industry | F500 HQs | Revenue |
|---|---|---|
| Financial Services | 1 | $8B |
|
||
| Healthcare | 1 | $5B |
|
||
Price history
-75.9% since first listed3 events — show timeline
- 2025-07-28 Listed $44,900 SAARMLS
- 2020-07-30 Sold (Public Records) $15,000 Public Records
- 2020-03-16 Sold (Public Records) $186,000 Public Records
Property tax history
+1.4%/yrLatest (2025): $194 · +6.8% YoY. Source: county tax records.
Cash-flow waterfall
monthlySold comps — $/sqft
last 12 mo · ≤1 miLoading sold comps…