804 W Walnut Dr · Rockville, IN
Flood risk 1/10 · Minimal
- FEMA flood zone
- X (unshaded)
- Chance of flooding over 30 yrs
- 0.0%
- Est. flood insurance / yr
- $507 – $1,088
Fire risk 1/10 · Minimal
- Est. fire insurance / yr
- $717 – $1,331
Heat risk 3/10 · Minor
- Hot days now (above 104°F)
- 7 days/yr
- Hot days in 30 yrs
- 18 days/yr
Wind risk 2/10 · Minimal
- Chance of severe wind over 30 yrs
- 1.0%
Air-quality risk 2/10 · Minimal
- Unhealthy air days now
- 1 days/yr
- Unhealthy air days in 30 yrs
- 2 days/yr
Risk factors via First Street. Map © Google.
Why this score? — see what drove the D+ grade
The composite is a weighted blend of 9 inputs, each scored 0–100. Each bar is that input's sub-score; the figure is the points it added to the 100-point composite (weight × sub-score).
- Cash flow +19.8/30.0
- DSCR +6.3/10.0
- 1% rule +4.8/10.0
- ARV discount +4.2/15.0
- Livability +3.2/5.0
- Schools +2.9/10.0
- Rent growth +2.5/5.0
- Condition / age +2.5/5.0
- Appreciation +0.0/10.0
$145,000
🖨 Deal sheet 📄 Offer letter ✓ Due diligence
Listing remarks
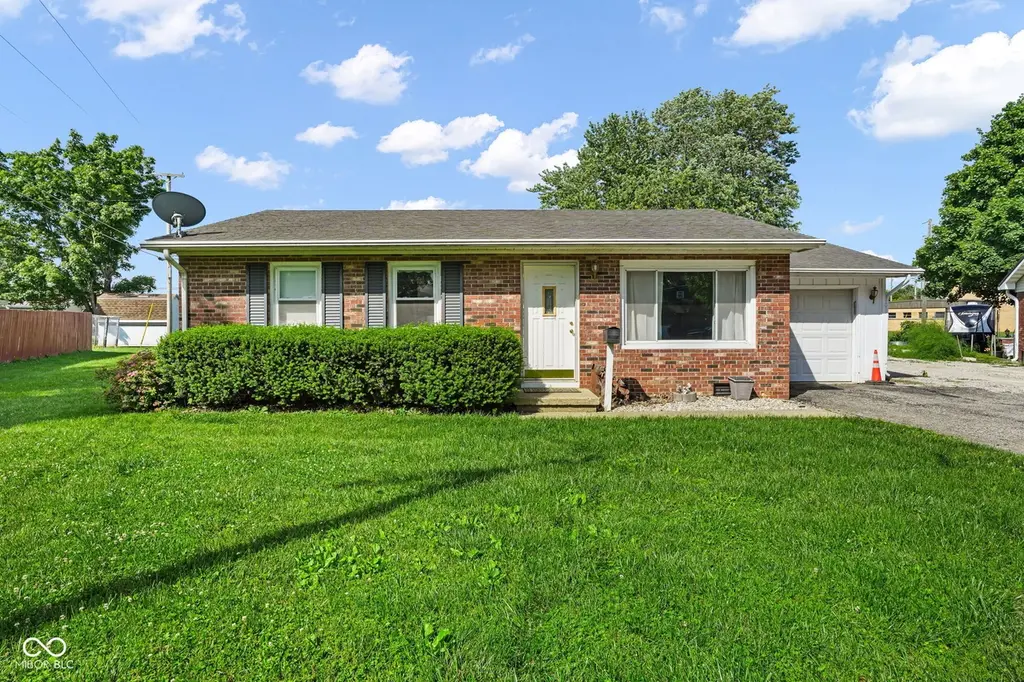
Discover the ease of single-story living at 804 W Walnut DR in ROCKVILLE, IN. This inviting, ready-to-move-in single family residence offers 952 square feet of comfortable living space, designed for a lifestyle of convenience and enjoyment for either a starter home or someone downsizing. With three well-proportioned bedrooms, this home provides flexible spaces for rest and personalization. The single full bathroom is recently remodeled to serve daily routines with efficiency. The practical ranch-style exterior is complemented by an attached garage, offering direct access and additional storage. Situated on a generous lot, there is ample outdoor space for leisure and potential enhancements.
Key facts
- Ranch style exterior
- Generous lot
- Attached garage
Tags
Property features AI
Exterior
- Parking: Attached garage (1 car, ~264 sq ft)
- Utilities: Public water; Municipal sewer connected
- Home design: Single-family residence; One story
- Construction: Brick exterior; Crawl space foundation
- Exterior features: Approximately 0.26-acre lot (about 1/4–1/2 acre)
Interior
- Kitchen: Electric oven; Microwave; Over-the-range microwave/hood; Refrigerator; Dishwasher
- Bedrooms: Three bedrooms on the main level (approx. 12x12, 10x12, 10x10)
- Bathrooms: One full bathroom on the main level
- Heating & cooling: Forced air heating; Central air conditioning
- Interior features: Eat-in kitchen; Five main-level rooms
- Laundry & utility: Washer; Dryer; Electric water heater
Neighborhood map
What this means for you Summary
Snapshot
- This is a 3-bed/1.0-bath single-family listed at $145k.
Deal economics
- At list price, monthly cash flow is $172 ($2k/yr) — positive.
- The deal already cash-flows at list — no discount required.
- To meet the 1% rule (rent ≥ 1% of price), the offer needs to be $143k (1.7% below list).
- Recommended offer: $143k (1.7% below list) — sets the bar for 1% rule.
Location & tenants
- Location reads 64/100 on livability (#372 in IN) — a middle-class / working-renter tenant base. Strengths: crime A+, cost of living A+, housing A+; Watch: employment D+, amenities F, commute F.
- North Central Parke Comm School Corporation (town): math 30% / reading 39% proficiency, ranked #198 of 301 in IN (top 66%) — families likely to look elsewhere, expect single-tenant / working-renter base with shorter leases.
- Zoned schools: Parke Heritage High School (math 12% / reading 57%, grade F, #270 of 369 statewide, top 77%, 341 students, 57% FRL).
- Market conditions: 84 active listings in the ZIP; 61 units permitted in Parke County in 2024 (0 in 5+ unit buildings).
Forward outlook
- Local home prices are declining (-3.0%/yr); year-one equity from $1k of loan paydown is wiped out by about $4k of value loss. Plan a longer hold.
- Parke County population projected at -10% by 2050 — secular population decline; favor cash flow + early exit over multi-decade hold.
Negotiation context
- Only 7 days on market — expect competitive offers; lowballing is unlikely to land.
Questions for the listing agent
- Built in 1965 — when were the roof, HVAC, electrical panel, plumbing, and water heater last replaced?
- Is there a deadline driving the sale (1031 exchange, divorce, estate, relocation)? That informs how much negotiation room exists.
- The area grade is low — what's the realistic commute time and amenity access for the typical tenant pool here? Any planned neighborhood developments (good or bad) we should know about?
- What's the average days-on-market for RENTAL listings here right now (not sales)? A rising rental-DOM trend means longer vacancies and softer asking-rent achievability than the comps imply.
- What's the recent tenant-quality profile in this submarket — average credit score on applications, eviction rate, late-payment / NSF rate, and stable-employment percentage? A property-management company in the area should have these aggregated.
- How much new for-sale + rental construction is in the pipeline within 1–3 miles? Heavy new supply typically softens prices + rents 12–24 months out; constrained supply supports both.
Investment metrics
- 1% rule
- 0.98% ✗
- Cap rate
- 7.72%
- Cash-on-cash
- 5.09%
- DSCR
- 1.23
- GRM
- 8.5
CMA / ARV
- ARV (on-the-fly)
- $135,184
- Comps found
- 8
Show comp detail 8 sales within ~0.75 mi
| Address | Dist | Beds/Ba | Sqft | Sold | Price | $/sf | Match |
|---|---|---|---|---|---|---|---|
| 808 W Walnut Dr | 0.03mi | 3/1.0 | 936 (-2%) | 9mo | $129,900 | $139 | 88 |
| 603 Tulip Ln | 0.54mi | 2/1.0 (-1) | 960 (+1%) | 13mo | $167,000 | $174 | 57 |
| 309 Voorhees St | 0.61mi | 2/1.0 (-1) | 936 (-2%) | 14mo | $135,000 | $144 | 52 |
| 101 Applewood Dr | 0.65mi | 3/1.0 | 1,051 (+10%) | 4mo | $51,000 | $49 | 49 |
| 406 Jackson St | 0.63mi | 2/1.0 (-1) | 1,000 (+5%) | 11mo | $175,000 | $175 | 48 |
| 512 Voorhees St | 0.50mi | 2/1.0 (-1) | 930 (-2%) | 24mo | $100,000 | $108 | 48 |
| 401 Jackson St | 0.68mi | 2/1.0 (-1) | 1,020 (+7%) | 20mo | $104,500 | $102 | 34 |
| 307 Voorhees St | 0.61mi | 3/1.5 | 1,092 (+15%) | 14mo | $155,000 | $142 | 33 |
Match score weights: distance 35% · size 25% · config 20% · recency 20%. Top-matched comps best support the ARV.
Projected returns pro-forma
-3.0% appreciation · 3.0% rent growth · sell at horizon
- IRR
- -8.4%
- Equity multiple
- 0.69×
- Total profit
- $-12,546
- Equity at exit
- $21,620
- IRR
- 1.1%
- Equity multiple
- 1.08×
- Total profit
- $3,152
- Equity at exit
- $12,537
Cash invested: $40,600 (down + closing). Projections, not guarantees.
Landlord ↔ Tenant lean methodology
- Overall (STATE)
- 90 Strongly Landlord-Friendly
- State Indiana
- 90 Strongly Landlord-Friendly · R+11
- County
- — inherits STATE
- City
- — inherits STATE
ZIP-level market 47872
- Home prices YoY
- -7.8%
- Active inventory
- 84
- Price-to-rent
- 8.5×
Monthly cashflow live
- Estimated rent
- $1,425 medium interval (Pro) →
- Mortgage (P&I)
- −$760
- Tax from tax record
- −$133 /mo · $1,599/yr
- Insurance
- −$60
- HOA
- −$0
- Vacancy / Maint / Mgmt
- −$299
- Net cashflow
- $172
Break-even live
UW: 25.0% down · 7.5% · 30yr · 1.5% tax · 5.0% vac · 8.0% maint · 8.0% mgmt
Financing live
Cash to close
- Down payment
- $36,250
- Closing costs
- $4,350
- Reserves months
- —
- Total cash needed
- —
Loan-product check · same deal, 3 products live
Conventional
25% down · 7.5% · 30yr
- Down + closing
- —
- Monthly P&I
- —
- Monthly cashflow
- —
- DSCR
- —
- Eligible?
- —
Personal DTI + credit; lowest rate.
DSCR
20% down · 8.5% · 30yr
- Down + closing
- —
- Monthly P&I
- —
- Monthly cashflow
- —
- DSCR
- —
- Eligible?
- —
No personal income docs; deal must DSCR.
Hard money
10% down · 12.0% · 12mo
- Down + closing
- —
- Monthly P&I
- —
- Monthly cashflow
- —
- DSCR
- —
- Eligible?
- —
Short-term bridge; refi at stabilization.
Listing history 7 events
-
2026-06-09status $145,000 Pending 7 DOM
-
2026-06-08days on market $145,000 Active 7 DOM
-
2026-06-07days on market $145,000 Active 6 DOM
-
2026-06-05days on market $145,000 Active 3 DOM
-
2026-06-03days on market $145,000 Active 2 DOM
-
2026-06-01remarks 699-char remark
-
2026-06-01$145,000 Active 1 DOM
ⓘ Source: listings_history table (triggers on properties + properties_extension) + one-shot
backfill from property_details.listing_events for pre-trigger history.
Tax reassessment forecast IN · Partial reset (capped growth)
- Current annual tax
- $1,599 · $133/mo
- Projected year-2 tax
- $1,599 · $133/mo
- Expected delta
- $0/yr ($0/mo · 0.0%)
ⓘ Screening estimate from a state-policy table — verify with the county assessor before closing.
Climate risk First Street
- Flood 1/10 Low FEMA zone X (unshaded) · 0% chance over 30 yrs
- Wildfire 1/10 Low
- Heat 3/10 Moderate 7 d/yr ≥104°F today · 18 d/yr by 30 yrs out
- Wind 2/10 Low 100% chance of damaging wind over 30 yrs
- Air quality 2/10 Low 1 unhealthy d/yr today · 2 by 30 yrs out
Nearby sold comps map
Loading sold comps map…
Walkable amenities ~0.75 mi
Loading nearby amenities…
Taxation est. · year 1
- Rental income
- $17,105
- − Mortgage interest
- −$8,122
- − Property taxes
- −$1,599
- − Insurance
- −$725
- − Repairs & maintenance
- −$1,368
- − Management
- −$1,368
- − Depreciation
- −$4,218
- Taxable loss
- −$296
- Est. tax savings @ 24.0%
- +$71
- After-tax cash flow
- $2,136/yr
For passive investors: Depreciation is non-cash, so a rental often shows a tax loss while cash-flowing — sheltering income. Rental losses are passive: they offset passive income freely, and up to $25,000/yr can offset ordinary (W-2) income if you actively participate and your MAGI is under $100k (phasing out to $0 by $150k); unused losses carry forward. On sale, claimed depreciation is recaptured at up to 25%, and gains may owe capital-gains tax (a 1031 exchange can defer both). Figures are a year-1 estimate at your 24.0% rate — not tax advice; consult a CPA.
Schools (NCES district)
- District
- North Central Parke Comm School Corporation
- NCES district ID
- 1800118
- Math proficiency
- 30% ▼ -8.00%
- Reading proficiency
- 39% ▼ -4.00%
- Median HH income
- $43,739
- Composite
- 29.31/100
- National rank
- #6553
- State rank
- #198 of 301 in IN
Livability — Rockville
- Score
- 64/100
- State rank
- #372
- US rank
- #13880
Category grades
Schools grade is shown separately in the Schools card above.
Census & demographics
- Census place
- Rockville, IN
- Population (ZIP)
- 8,641
Population outlook (Parke County) Hauer SSP2
- Today (2025)
- 15,937 people
- By 2030
- 15,467 · -2.9%
- By 2040
- 14,793 · -7.2%
- By 2050
- 14,318 · -10.2%
- By 2075
- 13,484 · -15.4%
- By 2100
- 12,236 · -23.2%
Race, ethnicity, and origin ACS 2023
- Neighborhood character
- Predominantly White (93%)
- Race & ethnicity
- White 93% Black 3% Two or more races 3% Hispanic / Latino 2%
- Common ancestry
- Iranian 3% Lithuanian 2% Slovak 2%
- Foreign-born
- 0%
- Languages at home
- 92% English-only · German/W. Germanic 5% Spanish 2% French/Haitian/Cajun 1%
Political lean MEDSL · Parke
- 2024 margin
- Solid R (+56.9) · D 20.6% · R 77.5% · Other 1.9%
- 2008→2024 swing
- -42.8pp toward R · 2008: -14.1pp · 2024: -56.9pp
- All cycles
- 2024: R+56.9 2020: R+55.5 2016: R+52.0 2012: R+32.6 2008: R+14.1
Not yet ingested
- Civics
- —
Market trends
- HPI YoY
- ▼ -19.85%
- Current HPI
- 234.3039
- Rent YoY
- —
- Metro
- —
- State GDP YoY
- ▲ 2.90%
- F500 in state
- 18
Industry mix (Fortune 500 HQ in IN)
| Industry | F500 HQs | Revenue |
|---|---|---|
| Industrial Machinery | 2 | $37B |
|
||
| Healthcare | 1 | $177B |
|
||
| Pharmaceuticals | 1 | $45B |
|
||
| Metals / Steel | 1 | $18B |
|
||
| Agriculture | 1 | $17B |
|
||
| Packaging | 1 | $12B |
|
||
Price history
1 event — show timeline
- 2026-05-29 Listed $145,000 MIBOR as Distributed by MLS Grid
Property tax history
+40.8%/yrLatest (2024): $1,599 · -4.2% YoY. Source: county tax records.
Cash-flow waterfall
monthlySold comps — $/sqft
last 12 mo · ≤1 miLoading sold comps…