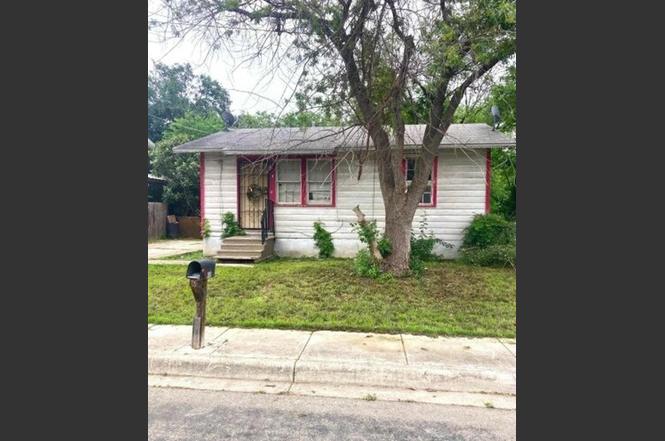
3010 Neptune St · San Antonio, TX
Flood risk 1/10 · Minimal
- FEMA flood zone
- X (unshaded)
- Chance of flooding over 30 yrs
- 0.0%
- Est. flood insurance / yr
- $507 – $1,088
Fire risk 1/10 · Minimal
- Est. fire insurance / yr
- $1,222 – $2,270
Heat risk 8/10 · Major
- Hot days now (above 108°F)
- 7 days/yr
- Hot days in 30 yrs
- 22 days/yr
Wind risk 7/10 · Major
- Chance of severe wind over 30 yrs
- 78.0%
Air-quality risk 2/10 · Minimal
- Unhealthy air days now
- 1 days/yr
- Unhealthy air days in 30 yrs
- 2 days/yr
Risk factors via First Street. Map © Google.
Why this score? — see what drove the B+ grade
The composite is a weighted blend of 9 inputs, each scored 0–100. Each bar is that input's sub-score; the figure is the points it added to the 100-point composite (weight × sub-score).
- Cash flow +30.0/30.0
- ARV discount +15.0/15.0
- 1% rule +10.0/10.0
- DSCR +10.0/10.0
- Livability +4.0/5.0
- Appreciation +3.9/10.0
- Rent growth +2.5/5.0
- Condition / age +2.5/5.0
- Schools +1.4/10.0
$59,000
🖨 Deal sheet 📄 Offer letter ✓ Due diligence
Listing remarks
Attention investors, flippers, and handy buyers! This 2-bedroom, 1-bath home offers tremendous potential for those looking to add value through renovations and updates. With solid bones and plenty of opportunity to customize, this property is perfect for a fix-and-flip project, rental investment, or long-term hold strategy. Conveniently located near schools, shopping, dining, and major transportation routes, the property's location adds to its investment appeal. Property is being sold as-is.
Key facts
- 5,941 sq ft lot
- Built 1962
- Listed 3 days
Property features AI
Exterior
- Utilities: Public water; Public sewer
- Home design: Residential property; Single-story (first-level living)
- Construction: Built in 1962; Cement siding; Slab foundation; Composition roof
- Exterior features: Subdivision lot
Interior
- Bedrooms: Two bedrooms on the first level (each approx. 10 x 10)
- Bathrooms: One full bathroom
- Interior features: Two total rooms
Neighborhood map
What this means for you Summary
Snapshot
- This is a 2-bed/1.0-bath single-family listed at $59k.
Deal economics
- At list price, monthly cash flow is $268 ($3k/yr) — positive.
- The deal already cash-flows at list — no discount required.
- Meets the 1% rule at list price ($998 rent vs $59k).
- Cap rate 11.7% vs local median 3.8% in San Antonio — top-decile yield for the area; either an underpriced asset or a hidden risk that comps aren't pricing in. Stress-test before assuming the spread holds.
Location & tenants
- Location reads 80/100 on livability (#31 in TX, #1,616 nationally) — a professional / high-income tenant draw. Strengths: amenities A+, commute A+, cost of living A+; Watch: crime F.
- San Antonio ISD (urban): math 12% / reading 22% proficiency, ranked #805 of 826 in TX (top 98%) — low school quality limits family demand, transient renter base, plan for 1-2y turnover; 80% free/reduced lunch — lower-income household profile, screen leases tightly.
- Zoned schools: George E Kelly El (math 17% / reading 22%, grade F, #3,583 of 4,322 statewide, top 86%, 227 students, 94% FRL); Harris Middle (math 11% / reading 23%, grade F, #1,520 of 1,662 statewide, top 92%, 762 students, 94% FRL, charter); Burbank H S (math 9% / reading 20%, grade F, #1,522 of 1,632 statewide, top 94%, 1,319 students, 90% FRL, charter).
- Market conditions: 7 active listings in the ZIP; 7 comparable units currently listed for rent nearby; rentals leasing fast (median 13d on market — plan ~1-2 weeks tenant-placement turnaround); 8,308 units permitted in Bexar County in 2024 (2,506 in 5+ unit buildings).
Forward outlook
- Local home prices are declining (-2.3%/yr); year-one equity from $408 of loan paydown is wiped out by about $1k of value loss. Plan a longer hold.
- Bexar County population projected at +50% by 2050 — long-run rental-demand tailwind backs the buy-and-hold thesis.
- At projected returns (-2.3% appreciation + 3.0% rent growth), your $17k cash investment doubles in ~6 years — after that, you're playing with house money.
Negotiation context
- Only 3 days on market — expect competitive offers; lowballing is unlikely to land.
- 6 sale attempts since 11y ago with the ask held roughly flat each time — persistent listings suggest the price (not the market) is what's stuck; bring a comps-based counter.
Risks & watch-outs
- Watch-outs: property tax is 3.8% of price.
- Climate carrying-cost: major wind risk, 78% chance of damaging wind over 30y; extreme-heat days projected 7→22/yr by 2055 (HVAC capex compounding) — expect insurance premiums to compound above CPI over the hold.
Questions for the listing agent
- Built in 1962 — when were the roof, HVAC, electrical panel, plumbing, and water heater last replaced?
- Property tax is high relative to price — has the assessment been appealed recently, and will the sale trigger a re-assessment?
- Is there a deadline driving the sale (1031 exchange, divorce, estate, relocation)? That informs how much negotiation room exists.
- Crime grade is F in this area — have there been break-ins, vandalism, or insurance claims at this property in the last 3 years? What carrier currently insures it and at what premium?
- What's the average days-on-market for RENTAL listings here right now (not sales)? A rising rental-DOM trend means longer vacancies and softer asking-rent achievability than the comps imply.
- What's the recent tenant-quality profile in this submarket — average credit score on applications, eviction rate, late-payment / NSF rate, and stable-employment percentage? A property-management company in the area should have these aggregated.
- How much new for-sale + rental construction is in the pipeline within 1–3 miles? Heavy new supply typically softens prices + rents 12–24 months out; constrained supply supports both.
Investment metrics
- 1% rule
- 1.69% ✓
- Cap rate
- 11.75%
- Cash-on-cash
- 19.47%
- DSCR
- 1.87
- GRM
- 4.9
CMA / ARV
- ARV (on-the-fly)
- $116,928
- Comps found
- 7
Show comp detail 7 sales within ~0.75 mi
| Address | Dist | Beds/Ba | Sqft | Sold | Price | $/sf | Match |
|---|---|---|---|---|---|---|---|
| 3102 Neptune | 0.05mi | 2/1.0 | 672 (0%) | 1mo | $69,000 | $103 | 96 |
| 3111 Mars | 0.04mi | 2/1.0 | 672 (0%) | 5mo | $150,000 | $223 | 94 |
| 2263 19th | 0.39mi | 2/1.0 | 720 (+7%) | 6mo | $50,000 | $69 | 66 |
| 834 Jennings | 0.31mi | 2/1.0 | 756 (+12%) | 8mo | $125,000 | $165 | 58 |
| 553 Barrett | 0.64mi | 2/1.0 | 660 (-2%) | 13mo | $138,900 | $210 | 57 |
| 557 Barrett | 0.63mi | 2/1.0 | 748 (+11%) | 8mo | $129,900 | $174 | 45 |
| 439 Walton Ave | 0.65mi | 2/1.0 | 720 (+7%) | 22mo | $149,000 | $207 | 39 |
Match score weights: distance 35% · size 25% · config 20% · recency 20%. Top-matched comps best support the ARV.
Projected returns pro-forma
-2.26% appreciation · 3.0% rent growth · sell at horizon
- IRR
- 13.6%
- Equity multiple
- 1.57×
- Total profit
- $9,434
- Equity at exit
- $10,749
- IRR
- 21.4%
- Equity multiple
- 2.95×
- Total profit
- $32,159
- Equity at exit
- $8,518
Cash invested: $16,520 (down + closing). Projections, not guarantees.
Landlord ↔ Tenant lean methodology
- Overall (STATE)
- 87 Strongly Landlord-Friendly
- State Texas
- 87 Strongly Landlord-Friendly · R+5
- County
- — inherits STATE
- City
- — inherits STATE
ZIP-level market 78226
- Home prices YoY
- -0.9%
- Active inventory
- 7
- Price-to-rent
- 4.9×
Monthly cashflow live
- Estimated rent
- $998 high interval (Pro) →
- Mortgage (P&I)
- −$309
- Tax from tax record
- −$187 /mo · $2,239/yr
- Insurance
- −$25
- HOA
- −$0
- Vacancy / Maint / Mgmt
- −$210
- Net cashflow
- $268
Break-even live
UW: 25.0% down · 7.5% · 30yr · 1.5% tax · 5.0% vac · 8.0% maint · 8.0% mgmt
Financing live
Cash to close
- Down payment
- $14,750
- Closing costs
- $1,770
- Reserves months
- —
- Total cash needed
- —
Loan-product check · same deal, 3 products live
Conventional
25% down · 7.5% · 30yr
- Down + closing
- —
- Monthly P&I
- —
- Monthly cashflow
- —
- DSCR
- —
- Eligible?
- —
Personal DTI + credit; lowest rate.
DSCR
20% down · 8.5% · 30yr
- Down + closing
- —
- Monthly P&I
- —
- Monthly cashflow
- —
- DSCR
- —
- Eligible?
- —
No personal income docs; deal must DSCR.
Hard money
10% down · 12.0% · 12mo
- Down + closing
- —
- Monthly P&I
- —
- Monthly cashflow
- —
- DSCR
- —
- Eligible?
- —
Short-term bridge; refi at stabilization.
Rent comps 7 comps
| Address | Beds | Baths | Sqft | Rent | $/sqft | DOM | Units | Dist |
|---|---|---|---|---|---|---|---|---|
| 515 Humble Ave San Antonio, TX | 1.0 | 1.0 | 700 | $810 | $1.16 | 43d | 1 | 0.43mi |
| 350 Barrett Pl San Antonio, TX | 2.0 | 1.0 | 616 | $1,225 | $1.99 | 4d | 1 | 0.94mi |
| 2003 S Zarzamora St San Antonio, TX | 1.0–4.0 | 1.0–2.0 | 1028 | $1,120 | $1.09 | 23d | 1 | 0.94mi |
| 330 Barrett Pl San Antonio, TX | 1.0 | 1.0 | 400 | $900 | $2.25 | 12d | 1 | 0.98mi |
| 1938 S Zarzamora St Unit 610 San Antonio, TX | 1.0 | 1.0 | 744 | $915 | $1.23 | 3d | 1 | 0.99mi |
| 1202 Division Ave San Antonio, TX | 1.0 | 1.0 | 550 | $1,100 | $2.00 | 23d | 1 | 1.33mi |
| 815 Ripford St San Antonio, TX | 2.0 | 1.0 | 728 | $1,300 | $1.79 | 4d | 1 | 1.47mi |
Listing history 5 events
-
2026-06-19price $59,000 Active 3 DOM
-
2026-06-18days on market $62,000 Active 3 DOM
-
2026-06-17days on market $62,000 Active 2 DOM
-
2026-06-16remarks 496-char remark
-
2026-06-16$62,000 Active 1 DOM
ⓘ Source: listings_history table (triggers on properties + properties_extension) + one-shot
backfill from property_details.listing_events for pre-trigger history.
Tax reassessment forecast TX · Resets to sale price
- Current annual tax
- $2,239 · $187/mo
- Projected year-2 tax
- $2,239 · $187/mo
- Expected delta
- $0/yr ($0/mo · 0.0%)
ⓘ Screening estimate from a state-policy table — verify with the county assessor before closing.
Climate risk First Street
- Flood 1/10 Low FEMA zone X (unshaded) · 0% chance over 30 yrs
- Wildfire 1/10 Low
- Heat 8/10 Severe 7 d/yr ≥108°F today · 22 d/yr by 30 yrs out
- Wind 7/10 Severe 78% chance of damaging wind over 30 yrs
- Air quality 2/10 Low 1 unhealthy d/yr today · 2 by 30 yrs out
Nearby sold comps map
Loading sold comps map…
Walkable amenities ~0.75 mi
Loading nearby amenities…
Taxation est. · year 1
- Rental income
- $11,980
- − Mortgage interest
- −$3,305
- − Property taxes
- −$2,239
- − Insurance
- −$295
- − Repairs & maintenance
- −$958
- − Management
- −$958
- − Depreciation
- −$1,716
- Taxable income
- $2,508
- Est. tax owed @ 24.0%
- −$602
- After-tax cash flow
- $2,615/yr
For passive investors: Depreciation is non-cash, so a rental often shows a tax loss while cash-flowing — sheltering income. Rental losses are passive: they offset passive income freely, and up to $25,000/yr can offset ordinary (W-2) income if you actively participate and your MAGI is under $100k (phasing out to $0 by $150k); unused losses carry forward. On sale, claimed depreciation is recaptured at up to 25%, and gains may owe capital-gains tax (a 1031 exchange can defer both). Figures are a year-1 estimate at your 24.0% rate — not tax advice; consult a CPA.
Schools (NCES district)
- District
- San Antonio ISD
- NCES district ID
- 4838730
- Math proficiency
- 12% ▼ -21.00%
- Reading proficiency
- 22% ▼ -7.00%
- Median HH income
- $30,952
- Composite
- 13.57/100
- National rank
- #9512
- State rank
- #805 of 826 in TX
Livability — San Antonio
- Score
- 80/100
- State rank
- #31
- US rank
- #1616
Category grades
Schools grade is shown separately in the Schools card above.
Census & demographics
- Census place
- San Antonio, TX
- City population
- 1,806,925
- Population (ZIP)
- 6,907
Population outlook (Bexar County) Hauer SSP2
- Today (2025)
- 2,336,851 people
- By 2030
- 2,560,728 · +9.6%
- By 2040
- 3,020,569 · +29.3%
- By 2050
- 3,493,522 · +49.5%
- By 2075
- 4,668,459 · +99.8%
- By 2100
- 5,533,242 · +136.8%
Race, ethnicity, and origin ACS 2023
- Neighborhood character
- Predominantly Hispanic (87%)
- Race & ethnicity
- Hispanic / Latino 87% Two or more races 27% White 8% Black 4% Native American 2%
- Hispanic origin (detail)
- Mexican 73%
- Common ancestry
- Portuguese 1%
- Foreign-born
- 12% · Canada
- Languages at home
- 50% English-only · Spanish 50%
Political lean MEDSL · Bexar
- 2024 margin
- Lean D (+9.8) · D 54.3% · R 44.6% · Other 1.1%
- 2008→2024 swing
- +4.2pp toward D · 2008: 5.6pp · 2024: 9.8pp
- All cycles
- 2024: D+9.8 2020: D+18.2 2016: D+13.5 2012: D+4.6 2008: D+5.6
Not yet ingested
- Civics
- —
Market trends
- HPI YoY
- ▼ -2.26%
- Current HPI
- 244.9905
- Rent YoY
- —
- Metro
- —
- State GDP YoY
- ▲ 3.95%
- F500 in state
- 110
Industry mix (Fortune 500 HQ in TX)
| Industry | F500 HQs | Revenue |
|---|---|---|
| Energy | 16 | $1,198B |
|
||
| Technology | 5 | $198B |
|
||
| Engineering / Construction | 4 | $72B |
|
||
| Energy Services | 3 | $60B |
|
||
| Utilities | 3 | $41B |
|
||
| Healthcare | 2 | $330B |
|
||
Price history
+37.8% since first listed16 events — show timeline
- 2026-06-15 Listed $62,000 HARMLS
- 2024-08-14 Listing Removed — LERA
- 2024-06-12 Relisted — LERA
- 2024-05-29 Pending — LERA
- 2024-04-27 Contingent — LERA
- 2024-04-23 Listed $85,000 LERA
- 2016-02-23 Listing Removed — LERA
- 2016-02-03 Relisted — LERA
- 2016-01-22 Pending — LERA
- 2015-12-22 Contingent — LERA
- 2015-12-17 Relisted — LERA
- 2015-10-10 Pending — LERA
- 2015-09-29 Contingent — LERA
- 2015-08-26 Price Changed $39,900 LERA
- 2015-08-11 Listed $45,000 LERA
- 2015-05-05 Sold (Public Records) — Public Records
Property tax history
+6.6%/yrLatest (2025): $2,239 · +0.0% YoY. Source: county tax records.
Cash-flow waterfall
monthlySold comps — $/sqft
last 12 mo · ≤1 miLoading sold comps…