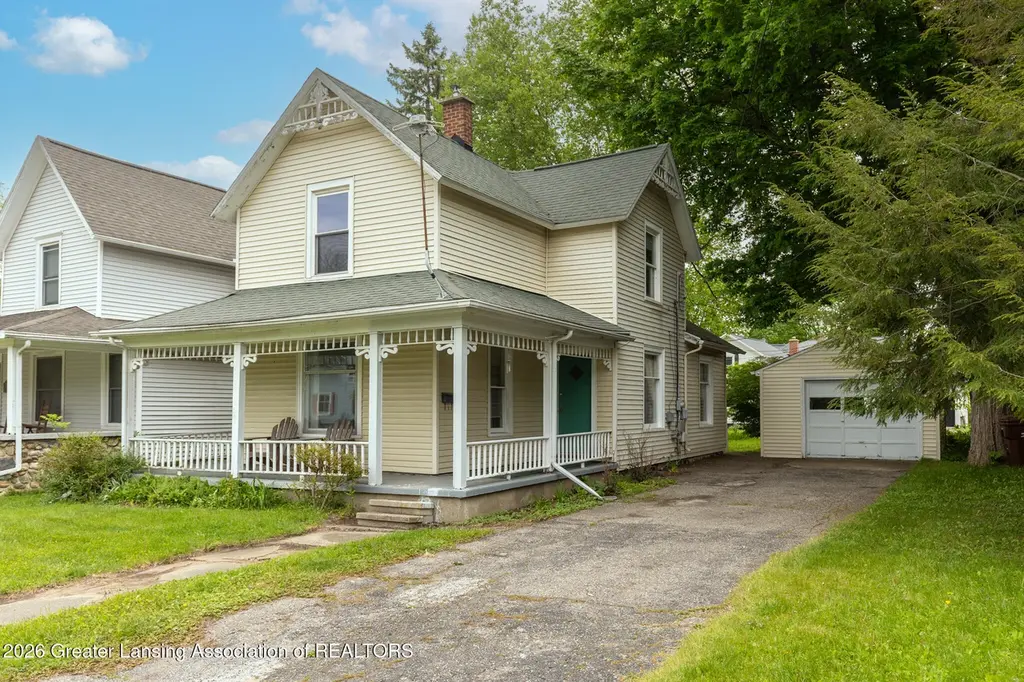
426 N Putnam St · Williamston, MI
Flood risk 1/10 · Minimal
- FEMA flood zone
- X (unshaded)
- Chance of flooding over 30 yrs
- 0.0%
- Est. flood insurance / yr
- $473 – $860
Fire risk 1/10 · Minimal
- Est. fire insurance / yr
- $784 – $1,456
Heat risk 2/10 · Minimal
- Hot days now (above 97°F)
- 7 days/yr
- Hot days in 30 yrs
- 15 days/yr
Wind risk 2/10 · Minimal
- Chance of severe wind over 30 yrs
- —
Air-quality risk 2/10 · Minimal
- Unhealthy air days now
- 1 days/yr
- Unhealthy air days in 30 yrs
- 2 days/yr
Risk factors via First Street. Map © Google.
Why this score? — see what drove the B+ grade
The composite is a weighted blend of 9 inputs, each scored 0–100. Each bar is that input's sub-score; the figure is the points it added to the 100-point composite (weight × sub-score).
- Cash flow +30.0/30.0
- ARV discount +15.0/15.0
- DSCR +10.0/10.0
- 1% rule +9.7/10.0
- Schools +5.0/10.0
- Livability +4.3/5.0
- Rent growth +2.5/5.0
- Condition / age +2.5/5.0
- Appreciation +0.0/10.0
$139,000
🖨 Deal sheet 📄 Offer letter ✓ Due diligence
Key facts
- 6,534 sq ft lot
- Garage
- Built 1900
Property features AI
Exterior
- Parking: One garage space; Asphalt parking
- Utilities: Natural gas connected; Electricity connected (fuses); Public sewer
- Home design: Traditional-style home; Two levels; Road frontage on a city street; Built in 1900
- Construction: Vinyl siding; Stone foundation
- Exterior features: Private yard; Covered patio/porch, deck, and porch; Shingle roof
Interior
- Kitchen: Kitchen included
- Bedrooms: Three bedrooms (primary bedroom included)
- Flooring: Carpet; Vinyl; Wood
- Bathrooms: One full bathroom; One half bathroom
- Heating & cooling: Forced air heating; No central cooling
- Interior features: Seven total rooms; Full basement (Michigan-style)
- Laundry & utility: Washer and dryer on main level
Neighborhood map
What this means for you Summary
Snapshot
- This is a 3-bed/1.5-bath single-family listed at $139k.
Deal economics
- At list price, monthly cash flow is $578 ($7k/yr) — positive.
- The deal already cash-flows at list — no discount required.
- Meets the 1% rule at list price ($2k rent vs $139k).
- Recommended offer: $137k (1.5% below list) — sets the bar for market timing.
Location & tenants
- Location reads 86/100 on livability (#19 in MI, #359 nationally) — a professional / high-income tenant draw. Strengths: crime A+, employment A+, cost of living A+; Watch: amenities D-, health & safety D-.
- Williamston Community Schools (town): math 49% / reading 62% proficiency, ranked #55 of 540 in MI (top 10%) — acceptable for families but not a draw, mixed tenant base, ~2y average lease; only 16% free/reduced lunch — higher-income household profile.
- Market conditions: 59 active listings in the ZIP; 2 comparable units currently listed for rent nearby; 350 units permitted in Ingham County in 2024 (186 in 5+ unit buildings).
Forward outlook
- Local home prices are declining (-3.0%/yr); year-one equity from $961 of loan paydown is wiped out by about $4k of value loss. Plan a longer hold.
- Ingham County population projected at +11% by 2050 — modest demand growth; plan on rents tracking national, not racing it.
- At projected returns (-3.0% appreciation + 3.0% rent growth), your $39k cash investment doubles in ~7 years — after that, you're playing with house money.
Negotiation context
- It's been on market 19 days — a 2% lower offer ($137k) is reasonable based on typical stale-listing flexibility.
- 7 sale attempts since 23y ago with the ask held roughly flat each time — persistent listings suggest the price (not the market) is what's stuck; bring a comps-based counter.
- Current owner paid $115k; 21% above their basis — modest negotiation headroom, anchor on the comps not their cost.
Risks & watch-outs
- Watch-outs: built in 1900 — expect roof / HVAC / electrical / plumbing capex.
Questions for the listing agent
- Built in 1900 — when were the roof, HVAC, electrical panel, plumbing, and water heater last replaced?
- Is there a deadline driving the sale (1031 exchange, divorce, estate, relocation)? That informs how much negotiation room exists.
- Schools are B-rated — typically a magnet for longer-tenancy family renters. What's the average tenant stay here, and is there a school-zone premium baked into asking?
- What's the average days-on-market for RENTAL listings here right now (not sales)? A rising rental-DOM trend means longer vacancies and softer asking-rent achievability than the comps imply.
- What's the recent tenant-quality profile in this submarket — average credit score on applications, eviction rate, late-payment / NSF rate, and stable-employment percentage? A property-management company in the area should have these aggregated.
- How much new for-sale + rental construction is in the pipeline within 1–3 miles? Heavy new supply typically softens prices + rents 12–24 months out; constrained supply supports both.
Investment metrics
- 1% rule
- 1.47% ✓
- Cap rate
- 11.28%
- Cash-on-cash
- 17.82%
- DSCR
- 1.79
- GRM
- 5.7
CMA / ARV
- ARV (on-the-fly)
- $231,072
- Comps found
- 12
Show comp detail 12 sales within ~0.75 mi
| Address | Dist | Beds/Ba | Sqft | Sold | Price | $/sf | Match |
|---|---|---|---|---|---|---|---|
| 324 E Church St | 0.18mi | 4/2.0 (+1) | 1,353 (-3%) | 1mo | $265,000 | $196 | 80 |
| 136 W Church St | 0.15mi | 3/2.0 | 1,304 (-6%) | 11mo | $230,000 | $176 | 71 |
| 133 E Riverside St | 0.06mi | 3/2.0 | 1,556 (+12%) | 8mo | $270,000 | $174 | 69 |
| 316 Leasia St | 0.47mi | 3/1.0 | 1,418 (+2%) | 10mo | $235,000 | $166 | 64 |
| 370 S Cedar St | 0.44mi | 4/2.0 (+1) | 1,491 (+7%) | 1mo | $187,500 | $126 | 60 |
| 131 W South St | 0.38mi | 2/1.0 (-1) | 1,296 (-7%) | 6mo | $203,000 | $157 | 59 |
| 300 E Church St | 0.14mi | 3/2.0 | 1,596 (+15%) | 11mo | $291,000 | $182 | 58 |
| 824 E Grand Riv | 0.58mi | 3/1.0 | 1,302 (-6%) | 4mo | $230,000 | $177 | 57 |
| 333 S Putnam St | 0.43mi | 3/1.0 | 1,288 (-8%) | 12mo | $187,500 | $146 | 56 |
| 718 W Grand River Ave | 0.64mi | 3/2.0 | 1,534 (+10%) | 2mo | $250,000 | $163 | 50 |
| 719 Williams St | 0.62mi | 2/2.0 (-1) | 1,532 (+10%) | 3mo | $210,500 | $137 | 45 |
| 1144 Riverview Ct | 0.73mi | 2/2.0 (-1) | 1,450 (+4%) | 12mo | $179,900 | $124 | 42 |
Match score weights: distance 35% · size 25% · config 20% · recency 20%. Top-matched comps best support the ARV.
Projected returns pro-forma
-3.0% appreciation · 3.0% rent growth · sell at horizon
- IRR
- 9.4%
- Equity multiple
- 1.37×
- Total profit
- $14,370
- Equity at exit
- $20,725
- IRR
- 18.6%
- Equity multiple
- 2.55×
- Total profit
- $60,239
- Equity at exit
- $12,018
Cash invested: $38,920 (down + closing). Projections, not guarantees.
Landlord ↔ Tenant lean methodology
- Overall (STATE)
- 62 Landlord-Friendly
- State Michigan
- 62 Landlord-Friendly · EVEN
- County
- — inherits STATE
- City
- — inherits STATE
ZIP-level market 48895
- Active inventory
- 59
- Price-to-rent
- 5.7×
Monthly cashflow live
- Estimated rent
- $2,046 medium interval (Pro) →
- Mortgage (P&I)
- −$729
- Tax from tax record
- −$252 /mo · $3,021/yr
- Insurance
- −$58
- HOA
- −$0
- Vacancy / Maint / Mgmt
- −$430
- Net cashflow
- $578
Break-even live
UW: 25.0% down · 7.5% · 30yr · 1.5% tax · 5.0% vac · 8.0% maint · 8.0% mgmt
Financing live
Cash to close
- Down payment
- $34,750
- Closing costs
- $4,170
- Reserves months
- —
- Total cash needed
- —
Loan-product check · same deal, 3 products live
Conventional
25% down · 7.5% · 30yr
- Down + closing
- —
- Monthly P&I
- —
- Monthly cashflow
- —
- DSCR
- —
- Eligible?
- —
Personal DTI + credit; lowest rate.
DSCR
20% down · 8.5% · 30yr
- Down + closing
- —
- Monthly P&I
- —
- Monthly cashflow
- —
- DSCR
- —
- Eligible?
- —
No personal income docs; deal must DSCR.
Hard money
10% down · 12.0% · 12mo
- Down + closing
- —
- Monthly P&I
- —
- Monthly cashflow
- —
- DSCR
- —
- Eligible?
- —
Short-term bridge; refi at stabilization.
Rent comps 2 comps
| Address | Beds | Baths | Sqft | Rent | $/sqft | DOM | Units | Dist |
|---|---|---|---|---|---|---|---|---|
| 123 E Riverside St Williamston, MI | 3.0 | 2.0 | 1292 | $1,975 | $1.53 | 13d | 1 | 0.06mi |
| 2155 Mitchell Rd Williamston, MI | 3.0 | 2.0 | 1492 | $2,530 | $1.70 | 13d | 1 | 0.68mi |
Listing history 22 events
-
2026-06-09statusdays on market $139,000 Pending 19 DOM
-
2026-06-08days on market $139,000 Active Under Contract 18 DOM
-
2026-06-07days on market $139,000 Active Under Contract 17 DOM
-
2026-06-05days on market $139,000 Active Under Contract 14 DOM
-
2026-06-03days on market $139,000 Active Under Contract 13 DOM
-
2026-06-02days on market $139,000 Active Under Contract 12 DOM
-
2026-06-01days on market $139,000 Active Under Contract 11 DOM
-
2026-05-31days on market $139,000 Active Under Contract 10 DOM
-
2026-05-30days on market $139,000 Active Under Contract 9 DOM
-
2026-05-21$139,000 Active
-
2026-05-21$139,000 Active
-
2011-04-30historical
-
2010-07-19$116,900
-
2008-12-30historical
-
2008-06-13$124,300
-
2008-05-30historical
-
2007-11-20$129,800
-
2006-08-31historical
-
2006-03-07$137,500
-
2003-09-19soldstatus $115,000
-
2003-09-10soldstatus $115,000
-
2003-07-01$120,000
ⓘ Source: listings_history table (triggers on properties + properties_extension) + one-shot
backfill from property_details.listing_events for pre-trigger history.
Tax reassessment forecast MI · Partial reset (capped growth)
- Current annual tax
- $3,021 · $252/mo
- Projected year-2 tax
- $3,021 · $252/mo
- Expected delta
- $0/yr ($0/mo · 0.0%)
ⓘ Screening estimate from a state-policy table — verify with the county assessor before closing.
Climate risk First Street
- Flood 1/10 Low FEMA zone X (unshaded) · 0% chance over 30 yrs
- Wildfire 1/10 Low
- Heat 2/10 Low 7 d/yr ≥97°F today · 15 d/yr by 30 yrs out
- Wind 2/10 Low
- Air quality 2/10 Low 1 unhealthy d/yr today · 2 by 30 yrs out
Nearby sold comps map
Loading sold comps map…
Walkable amenities ~0.75 mi
Loading nearby amenities…
Taxation est. · year 1
- Rental income
- $24,557
- − Mortgage interest
- −$7,786
- − Property taxes
- −$3,021
- − Insurance
- −$695
- − Repairs & maintenance
- −$1,965
- − Management
- −$1,965
- − Depreciation
- −$4,044
- Taxable income
- $5,082
- Est. tax owed @ 24.0%
- −$1,220
- After-tax cash flow
- $5,717/yr
For passive investors: Depreciation is non-cash, so a rental often shows a tax loss while cash-flowing — sheltering income. Rental losses are passive: they offset passive income freely, and up to $25,000/yr can offset ordinary (W-2) income if you actively participate and your MAGI is under $100k (phasing out to $0 by $150k); unused losses carry forward. On sale, claimed depreciation is recaptured at up to 25%, and gains may owe capital-gains tax (a 1031 exchange can defer both). Figures are a year-1 estimate at your 24.0% rate — not tax advice; consult a CPA.
Schools (NCES district)
- District
- Williamston Community Schools
- NCES district ID
- 2636420
- Math proficiency
- 49% ▼ -15.00%
- Reading proficiency
- 62% ▼ -8.00%
- Median HH income
- $79,113
- Composite
- 50.08/100
- National rank
- #1909
- State rank
- #55 of 540 in MI
Livability — Williamston
- Score
- 86/100
- State rank
- #19
- US rank
- #359
Category grades
Schools grade is shown separately in the Schools card above.
Census & demographics
- Census place
- Williamston, MI
- City population
- 11,294
- Population (ZIP)
- 11,294
Population outlook (Ingham County) Hauer SSP2
- Today (2025)
- 300,362 people
- By 2030
- 307,808 · +2.5%
- By 2040
- 320,492 · +6.7%
- By 2050
- 333,223 · +10.9%
- By 2075
- 373,693 · +24.4%
- By 2100
- 392,021 · +30.5%
Race, ethnicity, and origin ACS 2023
- Neighborhood character
- Predominantly White (93%)
- Race & ethnicity
- White 93% Two or more races 3% Hispanic / Latino 3%
- Common ancestry
- Italian 7% Romanian 6% Lithuanian 5%
- Foreign-born
- 1%
- Languages at home
- 97% English-only · Spanish 1% French/Haitian/Cajun 1% German/W. Germanic 1%
Political lean MEDSL · Ingham
- 2024 margin
- Strong D (+29.7) · D 63.9% · R 34.2% · Other 2.0%
- 2008→2024 swing
- -3.6pp toward R · 2008: 33.3pp · 2024: 29.7pp
- All cycles
- 2024: D+29.7 2020: D+32.2 2016: D+27.6 2012: D+27.9 2008: D+33.3
Not yet ingested
- Civics
- —
Market trends
- HPI YoY
- ▼ -175.37%
- Current HPI
- 202.0808
- Rent YoY
- —
- Metro
- —
- State GDP YoY
- ▲ 1.37%
- F500 in state
- 28
Industry mix (Fortune 500 HQ in MI)
| Industry | F500 HQs | Revenue |
|---|---|---|
| Automotive Parts | 3 | $48B |
|
||
| Automotive | 2 | $372B |
|
||
| Chemicals | 1 | $45B |
|
||
| Automotive Retail | 1 | $29B |
|
||
| Healthcare / Medical Devices | 1 | $23B |
|
||
| Automotive Technology | 1 | $20B |
|
||
Price history
+15.8% since first listed13 events — show timeline
- 2026-05-21 Listed $139,000 REALCOMP
- 2026-05-21 Listed $139,000 Greater Lansing AoR
- 2011-04-30 Listing Removed — Greater Lansing AoR
- 2010-07-19 Listed $116,900 Greater Lansing AoR
- 2008-12-30 Listing Removed — Greater Lansing AoR
- 2008-06-13 Listed $124,300 Greater Lansing AoR
- 2008-05-30 Listing Removed — Greater Lansing AoR
- 2007-11-20 Listed $129,800 Greater Lansing AoR
- 2006-08-31 Listing Removed — REALCOMP
- 2006-03-07 Listed $137,500 REALCOMP
- 2003-09-19 Sold (Public Records) $115,000 Public Records
- 2003-09-10 Sold (MLS) $115,000 REALCOMP
- 2003-07-01 Listed $120,000 REALCOMP
Property tax history
+3.0%/yrLatest (2025): $3,021 · +2.9% YoY. Source: county tax records.
Cash-flow waterfall
monthlySold comps — $/sqft
last 12 mo · ≤1 miLoading sold comps…