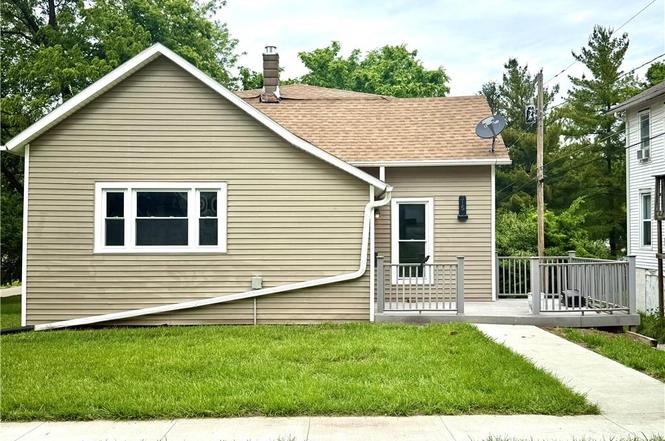
315 W Thompson St · Maryville, MO
Flood risk 1/10 · Minimal
- FEMA flood zone
- X (unshaded)
- Chance of flooding over 30 yrs
- 0.0%
- Est. flood insurance / yr
- $507 – $1,088
Fire risk 1/10 · Minimal
- Est. fire insurance / yr
- $1,054 – $1,958
Heat risk 3/10 · Minor
- Hot days now (above 105°F)
- 7 days/yr
- Hot days in 30 yrs
- 15 days/yr
Wind risk 2/10 · Minimal
- Chance of severe wind over 30 yrs
- —
Air-quality risk 2/10 · Minimal
- Unhealthy air days now
- 1 days/yr
- Unhealthy air days in 30 yrs
- 1 days/yr
Risk factors via First Street. Map © Google.
Why this score? — see what drove the C grade
The composite is a weighted blend of 9 inputs, each scored 0–100. Each bar is that input's sub-score; the figure is the points it added to the 100-point composite (weight × sub-score).
- Cash flow +23.6/30.0
- DSCR +7.6/10.0
- ARV discount +7.5/15.0
- 1% rule +5.3/10.0
- Livability +4.0/5.0
- Schools +3.9/10.0
- Rent growth +2.5/5.0
- Condition / age +2.5/5.0
- Appreciation +0.0/10.0
$119,000
🖨 Deal sheet 📄 Offer letter ✓ Due diligence
Listing remarks MLS
Lots of updates in this ranch home. Updates include new furnace with heat pump, hot water heater, new siding, roof, windows, doors and front porch. Newer carpet throughout plus updated bathroom. Perfect starter home or rental.
Key facts
- One-car garage
- Front porch
- Deck
Tags
Property features AI
Finance
- Other: Lot roughly 59 x 132 (city lot)
- HOA & community: No association fees
Exterior
- Parking: Basement parking access; 1‑car garage
- Utilities: Public water; Public sewer
- Home design: Single-family residential; Bungalow style; One story (main living on first level)
- Construction: Block and vinyl siding exterior; Composition roof
- Exterior features: Deck; Porch; Property inside city limits; Paved road access, public maintenance
Interior
- Kitchen: Free‑standing electric oven; Refrigerator
- Bedrooms: Three bedrooms on the main level
- Flooring: Carpet; Vinyl
- Bathrooms: One full bathroom on the main level
- Heating & cooling: Natural gas heating; Electric cooling
- Interior features: Full unfinished basement with garage entrance and plumbing stub for bath; Fireplace; Bungalow floor plan
- Laundry & utility: Washer and dryer; Main-level laundry
Neighborhood map
What this means for you Summary
Snapshot
- This is a 3-bed/1.0-bath other listed at $119k.
Deal economics
- At list price, monthly cash flow is $224 ($3k/yr) — positive.
- The deal already cash-flows at list — no discount required.
- Meets the 1% rule at list price ($1k rent vs $119k).
- Recommended offer: $105k (12.0% below list) — sets the bar for market timing.
- Cap rate 8.5% vs local median 4.2% in Maryville — top-decile yield for the area; either an underpriced asset or a hidden risk that comps aren't pricing in. Stress-test before assuming the spread holds.
Location & tenants
- Location reads 79/100 on livability (#23 in MO, #2,122 nationally) — a middle-class / working-renter tenant base. Strengths: cost of living A+, health & safety A+, housing B+; Watch: employment D, commute F.
- Maryville R-II (town): math 42% / reading 53% proficiency, ranked #79 of 324 in MO (top 24%) — families likely to look elsewhere, expect single-tenant / working-renter base with shorter leases.
- Market conditions: 132 active listings in the ZIP; 49 units permitted in Nodaway County in 2024 (0 in 5+ unit buildings).
Forward outlook
- Local home prices are declining (-3.0%/yr); year-one equity from $823 of loan paydown is wiped out by about $4k of value loss. Plan a longer hold.
- Nodaway County population projected at -13% by 2050 — secular population decline; favor cash flow + early exit over multi-decade hold.
Negotiation context
- It's been on market 373 days — a 12% lower offer ($105k) is reasonable based on typical stale-listing flexibility.
- 3 sale attempts since 8y ago; this cycle's ask has dropped $20k (14%) from the opening price — seller is motivated, your offer sets the floor, not the list.
Risks & watch-outs
- Watch-outs: built in 1905 — expect roof / HVAC / electrical / plumbing capex.
Questions for the listing agent
- It's been on market 373 days. Have you received any prior offers? Is the seller open to a 12% concession, seller financing, or rate buy-down credit?
- Built in 1905 — when were the roof, HVAC, electrical panel, plumbing, and water heater last replaced?
- Why hasn't it sold? Are there any deal-killer items the seller is aware of (foundation, flood, title, zoning, code violations)?
- Is there a deadline driving the sale (1031 exchange, divorce, estate, relocation)? That informs how much negotiation room exists.
- Schools are B-rated — typically a magnet for longer-tenancy family renters. What's the average tenant stay here, and is there a school-zone premium baked into asking?
- What's the average days-on-market for RENTAL listings here right now (not sales)? A rising rental-DOM trend means longer vacancies and softer asking-rent achievability than the comps imply.
- What's the recent tenant-quality profile in this submarket — average credit score on applications, eviction rate, late-payment / NSF rate, and stable-employment percentage? A property-management company in the area should have these aggregated.
- How much new for-sale + rental construction is in the pipeline within 1–3 miles? Heavy new supply typically softens prices + rents 12–24 months out; constrained supply supports both.
Investment metrics
- 1% rule
- 1.03% ✓
- Cap rate
- 8.55%
- Cash-on-cash
- 8.05%
- DSCR
- 1.36
- GRM
- 8.1
CMA / ARV
No comps found within radius.
Projected returns pro-forma
-3.0% appreciation · 3.0% rent growth · sell at horizon
- IRR
- -4.1%
- Equity multiple
- 0.85×
- Total profit
- $-5,068
- Equity at exit
- $17,743
- IRR
- 5.6%
- Equity multiple
- 1.41×
- Total profit
- $13,815
- Equity at exit
- $10,289
Cash invested: $33,320 (down + closing). Projections, not guarantees.
Landlord ↔ Tenant lean methodology
- Overall (STATE)
- 81 Strongly Landlord-Friendly
- State Missouri
- 81 Strongly Landlord-Friendly · R+10
- County
- — inherits STATE
- City
- — inherits STATE
ZIP-level market 64468
- Home prices YoY
- -25.4%
- Active inventory
- 132
- Price-to-rent
- 8.1×
Monthly cashflow live
- Estimated rent
- $1,229 medium interval (Pro) →
- Mortgage (P&I)
- −$624
- Tax from tax record
- −$74 /mo · $888/yr
- Insurance
- −$50
- HOA
- −$0
- Vacancy / Maint / Mgmt
- −$258
- Net cashflow
- $224
Break-even live
UW: 25.0% down · 7.5% · 30yr · 1.5% tax · 5.0% vac · 8.0% maint · 8.0% mgmt
Financing live
Cash to close
- Down payment
- $29,750
- Closing costs
- $3,570
- Reserves months
- —
- Total cash needed
- —
Loan-product check · same deal, 3 products live
Conventional
25% down · 7.5% · 30yr
- Down + closing
- —
- Monthly P&I
- —
- Monthly cashflow
- —
- DSCR
- —
- Eligible?
- —
Personal DTI + credit; lowest rate.
DSCR
20% down · 8.5% · 30yr
- Down + closing
- —
- Monthly P&I
- —
- Monthly cashflow
- —
- DSCR
- —
- Eligible?
- —
No personal income docs; deal must DSCR.
Hard money
10% down · 12.0% · 12mo
- Down + closing
- —
- Monthly P&I
- —
- Monthly cashflow
- —
- DSCR
- —
- Eligible?
- —
Short-term bridge; refi at stabilization.
Listing history 22 events
-
2026-06-18days on market $119,000 Active 373 DOM
-
2026-06-17days on market $119,000 Active 372 DOM
-
2026-06-16days on market $119,000 Active 371 DOM
-
2026-06-15days on market $119,000 Active 370 DOM
-
2026-06-13days on market $119,000 Active 368 DOM
-
2026-06-12days on market $119,000 Active 367 DOM
-
2026-06-09days on market $119,000 Active 364 DOM
-
2026-06-08days on market $119,000 Active 363 DOM
-
2026-06-07days on market $119,000 Active 362 DOM
-
2026-06-07days on market $119,000 Active 361 DOM
-
2026-06-04days on market $119,000 Active 358 DOM
-
2026-06-02days on market $119,000 Active 357 DOM
-
2026-06-01days on market $119,000 Active 356 DOM
-
2026-05-31days on market $119,000 Active 355 DOM
-
2025-12-19price $122,000
-
2025-10-13price $129,000
-
2025-07-11price $132,000
-
2025-06-10$139,000 Active
-
2021-03-26soldstatus
-
2021-02-15$79,500
-
2019-02-11soldstatus 226-char remark
Show marketing remark (226 chars)
Lots of updates in this ranch home. Updates include new furnace with heat pump, hot water heater, new siding, roof, windows, doors and front porch. Newer carpet throughout plus updated bathroom. Perfect starter home or rental.
-
2018-11-02$67,000 226-char remark
Show marketing remark (226 chars)
Lots of updates in this ranch home. Updates include new furnace with heat pump, hot water heater, new siding, roof, windows, doors and front porch. Newer carpet throughout plus updated bathroom. Perfect starter home or rental.
ⓘ Source: listings_history table (triggers on properties + properties_extension) + one-shot
backfill from property_details.listing_events for pre-trigger history.
Tax reassessment forecast MO · Resets to sale price
- Current annual tax
- $888 · $74/mo
- Projected year-2 tax
- $1,154 · $96/mo
- Expected delta
- +$266/yr (+$22/mo · 30.0%)
ⓘ Screening estimate from a state-policy table — verify with the county assessor before closing.
Climate risk First Street
- Flood 1/10 Low FEMA zone X (unshaded) · 0% chance over 30 yrs
- Wildfire 1/10 Low
- Heat 3/10 Moderate 7 d/yr ≥105°F today · 15 d/yr by 30 yrs out
- Wind 2/10 Low
- Air quality 2/10 Low 1 unhealthy d/yr today · 1 by 30 yrs out
Nearby sold comps map
Loading sold comps map…
Walkable amenities ~0.75 mi
Loading nearby amenities…
Taxation est. · year 1
- Rental income
- $14,753
- − Mortgage interest
- −$6,666
- − Property taxes
- −$888
- − Insurance
- −$595
- − Repairs & maintenance
- −$1,180
- − Management
- −$1,180
- − Depreciation
- −$3,462
- Taxable income
- $782
- Est. tax owed @ 24.0%
- −$188
- After-tax cash flow
- $2,496/yr
For passive investors: Depreciation is non-cash, so a rental often shows a tax loss while cash-flowing — sheltering income. Rental losses are passive: they offset passive income freely, and up to $25,000/yr can offset ordinary (W-2) income if you actively participate and your MAGI is under $100k (phasing out to $0 by $150k); unused losses carry forward. On sale, claimed depreciation is recaptured at up to 25%, and gains may owe capital-gains tax (a 1031 exchange can defer both). Figures are a year-1 estimate at your 24.0% rate — not tax advice; consult a CPA.
Schools (NCES district)
- District
- Maryville R-II
- NCES district ID
- 2920490
- Math proficiency
- 42% ▼ -5.00%
- Reading proficiency
- 53% ▼ -2.00%
- Median HH income
- $35,045
- Composite
- 39.24/100
- National rank
- #4005
- State rank
- #79 of 324 in MO
Livability — Maryville
- Score
- 79/100
- State rank
- #23
- US rank
- #2122
Category grades
Schools grade is shown separately in the Schools card above.
Census & demographics
- Census place
- Maryville, MO
- City population
- 14,315
- Population (ZIP)
- 14,315
Population outlook (Nodaway County) Hauer SSP2
- Today (2025)
- 22,010 people
- By 2030
- 21,531 · -2.2%
- By 2040
- 20,360 · -7.5%
- By 2050
- 19,210 · -12.7%
- By 2075
- 17,711 · -19.5%
- By 2100
- 16,796 · -23.7%
Race, ethnicity, and origin ACS 2023
- Neighborhood character
- Predominantly White (90%)
- Race & ethnicity
- White 90% Black 3% Hispanic / Latino 3% Two or more races 2% Asian 2%
- Common ancestry
- Slovak 3% Italian 3% Lithuanian 2%
- Foreign-born
- 3% · Canada
- Languages at home
- 97% English-only · Spanish 1% Other Asian/Pacific 1% German/W. Germanic 0%
Political lean MEDSL · Nodaway
- 2024 margin
- Solid R (+43.7) · D 27.6% · R 71.4% · Other 1.0%
- 2008→2024 swing
- -33.2pp toward R · 2008: -10.5pp · 2024: -43.7pp
- All cycles
- 2024: R+43.7 2020: R+40.5 2016: R+40.8 2012: R+27.0 2008: R+10.5
Not yet ingested
- Civics
- —
Market trends
- HPI YoY
- ▼ -65.91%
- Current HPI
- 193.2735
- Rent YoY
- —
- Metro
- —
- State GDP YoY
- ▲ 1.84%
- F500 in state
- 20
Industry mix (Fortune 500 HQ in MO)
| Industry | F500 HQs | Revenue |
|---|---|---|
| Healthcare | 1 | $163B |
|
||
| Insurance | 1 | $21B |
|
||
| Industrial Technology | 1 | $17B |
|
||
| Retail | 1 | $16B |
|
||
| Industrial Distribution | 1 | $10B |
|
||
| Utilities | 1 | $9B |
|
||
Price history
+82.1% since first listed8 events — show timeline
- 2025-12-19 Price Changed $122,000 Heartland MLS as Distributed by MLS Grid
- 2025-10-13 Price Changed $129,000 Heartland MLS as Distributed by MLS Grid
- 2025-07-11 Price Changed $132,000 Heartland MLS as Distributed by MLS Grid
- 2025-06-10 Listed $139,000 Heartland MLS as Distributed by MLS Grid
- 2021-03-26 Sold (MLS) — Heartland MLS as Distributed by MLS Grid
- 2021-02-15 Listed $79,500 Heartland MLS as Distributed by MLS Grid
- 2019-02-11 Sold (MLS) — Heartland MLS as Distributed by MLS Grid
- 2018-11-02 Listed $67,000 Heartland MLS as Distributed by MLS Grid
Property tax history
+3.5%/yrLatest (2025): $888 · +3.4% YoY. Source: county tax records.
Cash-flow waterfall
monthlySold comps — $/sqft
last 12 mo · ≤1 miLoading sold comps…