105 N Pine St · Cole Camp, MO
Flood risk 1/10 · Minimal
- FEMA flood zone
- X (unshaded)
- Chance of flooding over 30 yrs
- 0.0%
- Est. flood insurance / yr
- $473 – $860
Fire risk 3/10 · Minor
- Est. fire insurance / yr
- $1,054 – $1,958
Heat risk 4/10 · Minor
- Hot days now (above 107°F)
- 7 days/yr
- Hot days in 30 yrs
- 18 days/yr
Wind risk 2/10 · Minimal
- Chance of severe wind over 30 yrs
- —
Air-quality risk 1/10 · Minimal
- Unhealthy air days now
- 0 days/yr
- Unhealthy air days in 30 yrs
- 0 days/yr
Risk factors via First Street. Map © Google.
Why this score? — see what drove the C+ grade
The composite is a weighted blend of 9 inputs, each scored 0–100. Each bar is that input's sub-score; the figure is the points it added to the 100-point composite (weight × sub-score).
- Cash flow +21.8/30.0
- Appreciation +10.0/10.0
- ARV discount +7.5/15.0
- DSCR +6.9/10.0
- 1% rule +4.4/10.0
- Schools +4.1/10.0
- Livability +3.5/5.0
- Rent growth +2.5/5.0
- Condition / age +2.5/5.0
$96,000
🖨 Deal sheet 📄 Offer letter ✓ Due diligence
Listing remarks
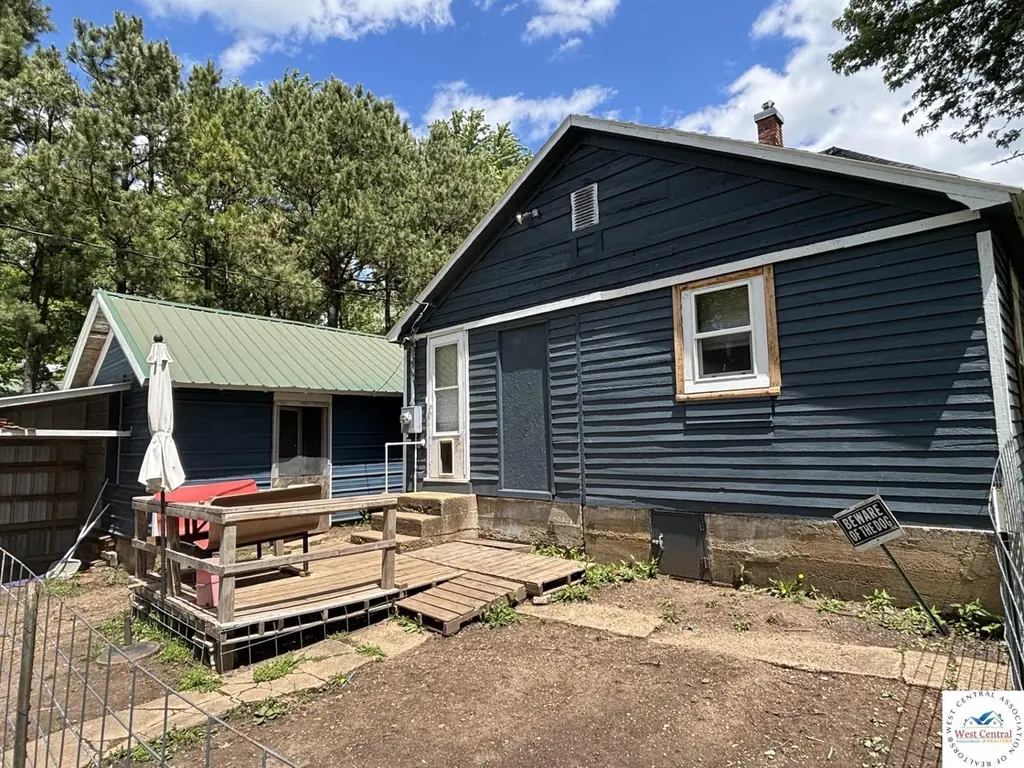
3-bedroom, 1-bath 1½-story home in the heart of Cole Camp! Tucked just off the main road on a quiet dead-end street, this property offers a peaceful setting with a convenient location close to town amenities. Situated on a spacious lot, the home features plenty of outdoor space to enjoy, including a backyard garden area and a great spot for entertaining family and friends. A storage shed provides extra room for tools, lawn equipment, or hobbies. Inside, you’ll find a comfortable layout with one bedroom located upstairs, adding character and flexibility for a bedroom, office, or bonus space. Whether you’re looking for a starter home, investment property, or a cozy place, t
Key facts
- Storage shed
- Backyard garden area
- 0.35 acre lot
Tags
Property features AI
Exterior
- Parking: Detached garage; 1 covered parking space (1 total parking space)
- Utilities: Public water; Public sewer; 220V electrical service (including 220V in laundry); Natural gas available
- Home design: Single-family residence; One and a half levels
- Construction: Wood siding
- Exterior features: Composition roof; Asphalt road access
Interior
- Bathrooms: 1 full bathroom
- Heating & cooling: Natural gas heating; Pellet stove; Electric cooling
- Interior features: Electric water heater; Crawl space basement
Neighborhood map
What this means for you Summary
Snapshot
- This is a 3-bed/1.0-bath other listed at $96k.
Deal economics
- At list price, monthly cash flow is $148 ($2k/yr) — positive.
- The deal already cash-flows at list — no discount required.
- To meet the 1% rule (rent ≥ 1% of price), the offer needs to be $91k (5.7% below list).
- Recommended offer: $91k (5.7% below list) — sets the bar for 1% rule.
Location & tenants
- Location reads 70/100 on livability (#123 in MO) — a middle-class / working-renter tenant base. Strengths: crime A+, cost of living A+, housing A+; Watch: employment D+, amenities F, commute F.
- Cole Camp R-I (rural): math 49% / reading 49% proficiency, ranked #61 of 324 in MO (top 19%) — families likely to look elsewhere, expect single-tenant / working-renter base with shorter leases.
- Market conditions: 18 active listings in the ZIP; 9 units permitted in Benton County in 2024 (0 in 5+ unit buildings).
Forward outlook
- In year one you build about $10k of equity ($664 loan paydown + $10k appreciation (10.0% local appreciation)).
- Benton County population projected at -21% by 2050 — secular population decline; favor cash flow + early exit over multi-decade hold.
- At projected returns (10.0% appreciation + 3.0% rent growth), your $27k cash investment doubles in ~3 years — after that, you're playing with house money.
- By year 4, paydown + projected appreciation supports a ~$36k cash-out refi (75% LTV) — recoverable capital for the next deal without selling this one.
Negotiation context
- It's been on market 23 days — a 2% lower offer ($95k) is reasonable based on typical stale-listing flexibility.
Risks & watch-outs
- Watch-outs: built in 1910 — expect roof / HVAC / electrical / plumbing capex.
Questions for the listing agent
- Built in 1910 — when were the roof, HVAC, electrical panel, plumbing, and water heater last replaced?
- Is there a deadline driving the sale (1031 exchange, divorce, estate, relocation)? That informs how much negotiation room exists.
- Schools are B-rated — typically a magnet for longer-tenancy family renters. What's the average tenant stay here, and is there a school-zone premium baked into asking?
- What's the average days-on-market for RENTAL listings here right now (not sales)? A rising rental-DOM trend means longer vacancies and softer asking-rent achievability than the comps imply.
- What's the recent tenant-quality profile in this submarket — average credit score on applications, eviction rate, late-payment / NSF rate, and stable-employment percentage? A property-management company in the area should have these aggregated.
- How much new for-sale + rental construction is in the pipeline within 1–3 miles? Heavy new supply typically softens prices + rents 12–24 months out; constrained supply supports both.
Investment metrics
- 1% rule
- 0.94% ✗
- Cap rate
- 8.15%
- Cash-on-cash
- 6.63%
- DSCR
- 1.29
- GRM
- 8.8
CMA / ARV
No comps found within radius.
Projected returns pro-forma
10.0% appreciation · 3.0% rent growth · sell at horizon
- IRR
- 29.1%
- Equity multiple
- 3.30×
- Total profit
- $61,695
- Equity at exit
- $86,484
- IRR
- 25.2%
- Equity multiple
- 7.48×
- Total profit
- $174,154
- Equity at exit
- $186,507
Cash invested: $26,880 (down + closing). Projections, not guarantees.
Landlord ↔ Tenant lean methodology
- Overall (STATE)
- 81 Strongly Landlord-Friendly
- State Missouri
- 81 Strongly Landlord-Friendly · R+10
- County
- — inherits STATE
- City
- — inherits STATE
ZIP-level market 65325
- Home prices YoY
- 14.5%
- Active inventory
- 18
- Price-to-rent
- 8.8×
Monthly cashflow live
- Estimated rent
- $906 medium interval (Pro) →
- Mortgage (P&I)
- −$503
- Tax from tax record
- −$24 /mo · $283/yr
- Insurance
- −$40
- HOA
- −$0
- Vacancy / Maint / Mgmt
- −$190
- Net cashflow
- $148
Break-even live
UW: 25.0% down · 7.5% · 30yr · 1.5% tax · 5.0% vac · 8.0% maint · 8.0% mgmt
Financing live
Cash to close
- Down payment
- $24,000
- Closing costs
- $2,880
- Reserves months
- —
- Total cash needed
- —
Loan-product check · same deal, 3 products live
Conventional
25% down · 7.5% · 30yr
- Down + closing
- —
- Monthly P&I
- —
- Monthly cashflow
- —
- DSCR
- —
- Eligible?
- —
Personal DTI + credit; lowest rate.
DSCR
20% down · 8.5% · 30yr
- Down + closing
- —
- Monthly P&I
- —
- Monthly cashflow
- —
- DSCR
- —
- Eligible?
- —
No personal income docs; deal must DSCR.
Hard money
10% down · 12.0% · 12mo
- Down + closing
- —
- Monthly P&I
- —
- Monthly cashflow
- —
- DSCR
- —
- Eligible?
- —
Short-term bridge; refi at stabilization.
Listing history 18 events
-
2026-06-19days on market $96,000 Active 23 DOM
-
2026-06-18days on market $96,000 Active 22 DOM
-
2026-06-17days on market $96,000 Active 21 DOM
-
2026-06-16days on market $96,000 Active 20 DOM
-
2026-06-15days on market $96,000 Active 19 DOM
-
2026-06-14days on market $96,000 Active 17 DOM
-
2026-06-12days on market $96,000 Active 16 DOM
-
2026-06-09days on market $96,000 Active 13 DOM
-
2026-06-08days on market $96,000 Active 12 DOM
-
2026-06-07days on market $96,000 Active 11 DOM
-
2026-06-05days on market $96,000 Active 8 DOM
-
2026-06-03days on market $96,000 Active 7 DOM
-
2026-06-02days on market $96,000 Active 6 DOM
-
2026-06-01days on market $96,000 Active 5 DOM
-
2026-05-31days on market $96,000 Active 4 DOM
-
2026-05-30days on market $96,000 Active 3 DOM
-
2026-05-27$96,000 Active
-
1996-02-01soldstatus
ⓘ Source: listings_history table (triggers on properties + properties_extension) + one-shot
backfill from property_details.listing_events for pre-trigger history.
Tax reassessment forecast MO · Resets to sale price
- Current annual tax
- $283 · $24/mo
- Projected year-2 tax
- $931 · $78/mo
- Expected delta
- +$648/yr (+$54/mo · 228.7%)
ⓘ Screening estimate from a state-policy table — verify with the county assessor before closing.
Climate risk First Street
- Flood 1/10 Low FEMA zone X (unshaded) · 0% chance over 30 yrs
- Wildfire 3/10 Moderate
- Heat 4/10 Moderate 7 d/yr ≥107°F today · 18 d/yr by 30 yrs out
- Wind 2/10 Low
- Air quality 1/10 Low 0 unhealthy d/yr today · 0 by 30 yrs out
Nearby sold comps map
Loading sold comps map…
Walkable amenities ~0.75 mi
Loading nearby amenities…
Taxation est. · year 1
- Rental income
- $10,869
- − Mortgage interest
- −$5,377
- − Property taxes
- −$283
- − Insurance
- −$480
- − Repairs & maintenance
- −$869
- − Management
- −$869
- − Depreciation
- −$2,793
- Taxable income
- $196
- Est. tax owed @ 24.0%
- −$47
- After-tax cash flow
- $1,735/yr
For passive investors: Depreciation is non-cash, so a rental often shows a tax loss while cash-flowing — sheltering income. Rental losses are passive: they offset passive income freely, and up to $25,000/yr can offset ordinary (W-2) income if you actively participate and your MAGI is under $100k (phasing out to $0 by $150k); unused losses carry forward. On sale, claimed depreciation is recaptured at up to 25%, and gains may owe capital-gains tax (a 1031 exchange can defer both). Figures are a year-1 estimate at your 24.0% rate — not tax advice; consult a CPA.
Schools (NCES district)
- District
- Cole Camp R-I
- NCES district ID
- 2909900
- Math proficiency
- 49% ▼ -10.00%
- Reading proficiency
- 49% ▼ -5.00%
- Median HH income
- $37,598
- Composite
- 40.78/100
- National rank
- #3641
- State rank
- #61 of 324 in MO
Livability — Cole Camp
- Score
- 70/100
- State rank
- #123
- US rank
- #7335
Category grades
Schools grade is shown separately in the Schools card above.
Census & demographics
- Census place
- Cole Camp, MO
- Population (ZIP)
- 3,134
Population outlook (Benton County) Hauer SSP2
- Today (2025)
- 17,355 people
- By 2030
- 16,513 · -4.9%
- By 2040
- 14,898 · -14.2%
- By 2050
- 13,662 · -21.3%
- By 2075
- 11,308 · -34.8%
- By 2100
- 8,755 · -49.6%
Race, ethnicity, and origin ACS 2023
- Neighborhood character
- Predominantly White (97%)
- Race & ethnicity
- White 97% Hispanic / Latino 1%
- Common ancestry
- Slovak 4% Serbian 1% Iranian 1%
- Foreign-born
- 0%
- Languages at home
- 98% English-only · German/W. Germanic 1% Spanish 1%
Political lean MEDSL · Benton
- 2024 margin
- Solid R (+59.1) · D 20.1% · R 79.2%
- 2008→2024 swing
- -36.8pp toward R · 2008: -22.3pp · 2024: -59.1pp
- All cycles
- 2024: R+59.1 2020: R+56.6 2016: R+54.1 2012: R+34.3 2008: R+22.3
Not yet ingested
- Civics
- —
Market trends
- HPI YoY
- ▲ 30.98%
- Current HPI
- 244.3929
- Rent YoY
- —
- Metro
- —
- State GDP YoY
- ▲ 1.84%
- F500 in state
- 20
Industry mix (Fortune 500 HQ in MO)
| Industry | F500 HQs | Revenue |
|---|---|---|
| Healthcare | 1 | $163B |
|
||
| Insurance | 1 | $21B |
|
||
| Industrial Technology | 1 | $17B |
|
||
| Retail | 1 | $16B |
|
||
| Industrial Distribution | 1 | $10B |
|
||
| Utilities | 1 | $9B |
|
||
Price history
2 events — show timeline
- 2026-05-27 Listed $96,000 WCAR
- 1996-02-01 Sold (Public Records) — Public Records
Property tax history
+5.8%/yrLatest (2025): $283 · +7.7% YoY. Source: county tax records.
Cash-flow waterfall
monthlySold comps — $/sqft
last 12 mo · ≤1 miLoading sold comps…