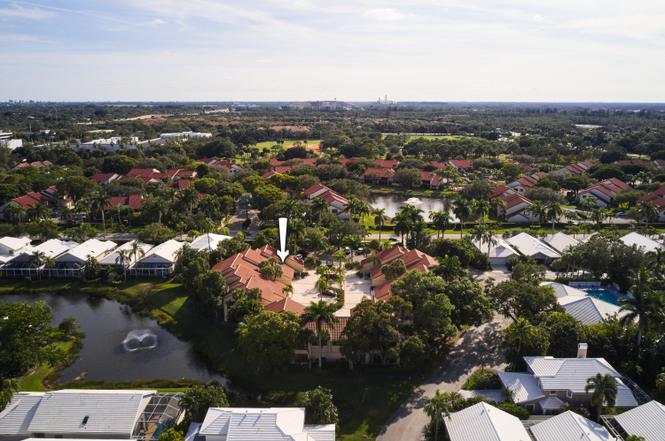
101 Waterview Dr Unit 101-1 · Palm Beach Gardens, FL
Flood risk 3/10 · Minor
- FEMA flood zone
- X (unshaded)
- Chance of flooding over 30 yrs
- 0.2%
- Est. flood insurance / yr
- $507 – $1,088
Fire risk 4/10 · Minor
- Est. fire insurance / yr
- $947 – $1,759
Heat risk 9/10 · Severe
- Hot days now (above 106°F)
- 6 days/yr
- Hot days in 30 yrs
- 21 days/yr
Wind risk 10/10 · Severe
- Chance of severe wind over 30 yrs
- 99.0%
Air-quality risk 2/10 · Minimal
- Unhealthy air days now
- 0 days/yr
- Unhealthy air days in 30 yrs
- 1 days/yr
Risk factors via First Street. Map © Google.
Why this score? — see what drove the C grade
The composite is a weighted blend of 9 inputs, each scored 0–100. Each bar is that input's sub-score; the figure is the points it added to the 100-point composite (weight × sub-score).
- Cash flow +21.7/30.0
- 1% rule +10.0/10.0
- ARV discount +7.5/15.0
- DSCR +6.9/10.0
- Schools +4.3/10.0
- Livability +3.5/5.0
- Rent growth +3.0/5.0
- Condition / age +2.5/5.0
- Appreciation +0.0/10.0
$250,000
🖨 Deal sheet 📄 Offer letter ✓ Due diligence
Listing remarks
Rare opportunity to own a delightful condo in the desirable Lakes at PGA National! This well-maintained 2-bedroom, 2-bathroom home spans 1,340 sq. ft. The interior boasts a functional split floor plan and ample natural light, creating a bright and inviting atmosphere. Residents can take advantage of the serene community setting and proximity to major highways, top-rated schools, and the world-class amenities of PGA National. Whether you're seeking a full-time residence or a peaceful Florida getaway, this property delivers. Don't miss this chance to customize your home in a fantastic location!
Key facts
- $937 HOA
- Garage
- Community pool
Neighborhood map
What this means for you Summary
Snapshot
- This is a 2-bed/2.0-bath condo listed at $250k.
Deal economics
- At list price, monthly cash flow is $386 ($5k/yr) — positive.
- The deal already cash-flows at list — no discount required.
- Meets the 1% rule at list price ($4k rent vs $250k).
- Recommended offer: $228k (9.0% below list) — sets the bar for market timing.
Location & tenants
- Location reads 69/100 on livability (#464 in FL) — a middle-class / working-renter tenant base. Strengths: crime A+, employment A+, housing A+; Watch: amenities F, commute F, cost of living F.
- Palm Beach (suburban): math 46% / reading 53% proficiency, ranked #34 of 73 in FL (top 47%) — families likely to look elsewhere, expect single-tenant / working-renter base with shorter leases.
- Zoned schools: Timber Trace Elementary School (math 76% / reading 79%, grade A, #163 of 2,144 statewide, top 8%, 825 students, 34% FRL); Watson B. Duncan Middle School (math 54% / reading 59%, grade B, #171 of 571 statewide, top 30%, 1,157 students, 41% FRL); Palm Beach Gardens High School (math 19% / reading 40%, grade F, #447 of 667 statewide, top 68%, 2,570 students, 61% FRL).
- Market conditions: Rents rising (+2.0%/yr); 532 active listings in the ZIP; 40 comparable units currently listed for rent nearby; rentals at typical pace (median 24d on market — plan ~3-4 weeks tenant-placement turnaround); high-income renter base; 3,974 units permitted in Palm Beach County in 2024 (1,012 in 5+ unit buildings).
- This rent runs 37% of the median local income ($125k/yr) — at the standard rent-burdened threshold; future hikes will face affordability resistance.
Forward outlook
- Local home prices are declining (-3.0%/yr); year-one equity from $2k of loan paydown is wiped out by about $8k of value loss. Plan a longer hold.
- Palm Beach County population projected at +30% by 2050 — long-run rental-demand tailwind backs the buy-and-hold thesis.
Negotiation context
- It's been on market 109 days — a 9% lower offer ($228k) is reasonable based on typical stale-listing flexibility.
Risks & watch-outs
- Watch-outs: HOA is 24% of rent.
- Climate carrying-cost: severe wind risk, 99% chance of damaging wind over 30y; extreme-heat days projected 6→21/yr by 2055 (HVAC capex compounding) — expect insurance premiums to compound above CPI over the hold.
Questions for the listing agent
- It's been on market 109 days. Have you received any prior offers? Is the seller open to a 9% concession, seller financing, or rate buy-down credit?
- What does the HOA fee cover, when was the last increase, and are there any pending special assessments or reserve-fund shortfalls?
- Any open or pending special assessments — roof, HVAC, plumbing, elevator, façade? What's the per-unit balance and payoff schedule, and is the seller paying it off at close or rolling it to the buyer?
- Why hasn't it sold? Are there any deal-killer items the seller is aware of (foundation, flood, title, zoning, code violations)?
- Is there a deadline driving the sale (1031 exchange, divorce, estate, relocation)? That informs how much negotiation room exists.
- Schools are B-rated — typically a magnet for longer-tenancy family renters. What's the average tenant stay here, and is there a school-zone premium baked into asking?
- What's the average days-on-market for RENTAL listings here right now (not sales)? A rising rental-DOM trend means longer vacancies and softer asking-rent achievability than the comps imply.
- What's the recent tenant-quality profile in this submarket — average credit score on applications, eviction rate, late-payment / NSF rate, and stable-employment percentage? A property-management company in the area should have these aggregated.
- How much new apartment / multifamily construction is in the pipeline within 1–3 miles? Heavy new supply (>2% of stock underway) typically softens rents 12–24 months out; light construction supports rent growth.
Investment metrics
- 1% rule
- 1.54% ✓
- Cap rate
- 8.15%
- Cash-on-cash
- 6.62%
- DSCR
- 1.29
- GRM
- 5.4
CMA / ARV
No comps found within radius.
Projected returns pro-forma
-3.0% appreciation · 2.0% rent growth · sell at horizon
- IRR
- -7.5%
- Equity multiple
- 0.73×
- Total profit
- $-19,146
- Equity at exit
- $37,276
- IRR
- 0.4%
- Equity multiple
- 1.03×
- Total profit
- $2,081
- Equity at exit
- $21,615
Cash invested: $70,000 (down + closing). Projections, not guarantees.
Landlord ↔ Tenant lean methodology
- Overall (STATE)
- 87 Strongly Landlord-Friendly
- State Florida
- 87 Strongly Landlord-Friendly · R+3
- County
- — inherits STATE
- City
- — inherits STATE
ZIP-level market 33418
- Home prices YoY
- -32.4%
- Rents YoY
- 2.0%
- Active inventory
- 532
- Price-to-rent
- 5.4×
Monthly cashflow live
- Estimated rent
- $3,862 high interval (Pro) →
- Mortgage (P&I)
- −$1,311
- Tax est. 1.5%
- −$312 /mo · $3,750/yr
- Insurance
- −$104
- HOA
- −$937
- Vacancy / Maint / Mgmt
- −$811
- Net cashflow
- $386
Break-even live
UW: 25.0% down · 7.5% · 30yr · 1.5% tax · 5.0% vac · 8.0% maint · 8.0% mgmt
Financing live
Cash to close
- Down payment
- $62,500
- Closing costs
- $7,500
- Reserves months
- —
- Total cash needed
- —
Loan-product check · same deal, 3 products live
Conventional
25% down · 7.5% · 30yr
- Down + closing
- —
- Monthly P&I
- —
- Monthly cashflow
- —
- DSCR
- —
- Eligible?
- —
Personal DTI + credit; lowest rate.
DSCR
20% down · 8.5% · 30yr
- Down + closing
- —
- Monthly P&I
- —
- Monthly cashflow
- —
- DSCR
- —
- Eligible?
- —
No personal income docs; deal must DSCR.
Hard money
10% down · 12.0% · 12mo
- Down + closing
- —
- Monthly P&I
- —
- Monthly cashflow
- —
- DSCR
- —
- Eligible?
- —
Short-term bridge; refi at stabilization.
Rent comps 40 comps
| Address | Beds | Baths | Sqft | Rent | $/sqft | DOM | Units | Dist |
|---|---|---|---|---|---|---|---|---|
| 23 Lexington Ln W Unit C Palm Beach Gardens, FL | 2.0 | 2.0 | 1275 | $2,895 | $2.27 | 24d | 1 | 0.11mi |
| 6 Lexington Ln E Unit D Palm Beach Gardens, FL | 2.0 | 2.0 | 1400 | $4,200 | $3.00 | 24d | 1 | 0.11mi |
| 4 Lexington Ln E Unit E Palm Beach Gardens, FL | 2.0 | 2.0 | 1275 | $2,700 | $2.12 | 3d | 1 | 0.12mi |
| 7 Lexington Ln E Palm Beach Gardens, FL | 2.0 | 2.0 | 1275 | $5,200 | $4.08 | 24d | 1 | 0.16mi |
| 39 Dorchester Cir Palm Beach Gardens, FL | 3.0 | 2.0 | 1571 | $11,500 | $7.32 | 24d | 1 | 0.16mi |
| 202 Cypress Point Dr #202 Palm Beach Gardens, FL | 2.0 | 2.0 | 1250 | $3,200 | $2.56 | 24d | 1 | 0.19mi |
| 717 Windermere Way Palm Beach Gardens, FL | 3.0 | 2.5 | 1869 | $3,100 | $1.66 | 3d | 1 | 0.33mi |
| 7 Wyndham Ln Palm Beach Gardens, FL | 3.0 | 2.0 | 1571 | $7,500 | $4.77 | 24d | 1 | 0.34mi |
| 32 Admirals Ct Palm Beach Gardens, FL | 3.0 | 2.0 | 1438 | $3,590 | $2.50 | 11d | 1 | 0.35mi |
| 32 Admirals Ct Palm Beach Gardens, FL | 3.0 | 2.0 | 1438 | $4,500 | $3.13 | 11d | 1 | 0.35mi |
| 605 Masters Way Palm Beach Gardens, FL | 3.0 | 3.0 | 1738 | $17,500 | $10.07 | 24d | 1 | 0.39mi |
| 77 Spyglass Way Palm Beach Gardens, FL | 3.0 | 2.5 | 1471 | $3,500 | $2.38 | 24d | 1 | 0.40mi |
| 36 Ironwood Way N Unit 36 Palm Beach Gardens, FL | 3.0 | 2.0 | 1480 | $6,500 | $4.39 | 24d | 1 | 0.56mi |
| 9016 Alister Blvd E Palm Beach Gardens, FL | 1.0–3.0 | 1.0–2.0 | 1136 | $2,452 | $2.16 | 2d | 47 | 0.57mi |
| 4 Ironwood Way N Palm Beach Gardens, FL | 3.0 | 2.0 | 1480 | $3,500 | $2.36 | 24d | 1 | 0.58mi |
| 127 Sunset Cove Ln Palm Beach Gardens, FL | 2.0 | 2.0 | 1677 | $17,000 | $10.14 | 20d | 1 | 0.63mi |
| 11 Ironwood Way N Palm Beach Gardens, FL | 3.0 | 2.0 | 1573 | $4,800 | $3.05 | 24d | 1 | 0.63mi |
| 26 Via Aurelia Palm Beach Gardens, FL | 3.0 | 2.5 | 1830 | $8,500 | $4.64 | 24d | 1 | 0.65mi |
| 8033 Murano Cir Palm Beach Gardens, FL | 3.0 | 2.5 | 1728 | $3,400 | $1.97 | 17d | 1 | 0.73mi |
| 293 Old Meadow Way Palm Beach Gardens, FL | 3.0 | 3.0 | 1694 | $6,000 | $3.54 | 24d | 1 | 0.77mi |
| 265 Old Meadow Way Palm Beach Gardens, FL | 2.0 | 2.0 | 1491 | $3,400 | $2.28 | 24d | 1 | 0.77mi |
| 204 Old Meadow Way Palm Beach Gardens, FL | 2.0 | 2.0 | 1491 | $4,100 | $2.75 | 24d | 1 | 0.80mi |
| 8050 Murano Cir Palm Beach Gardens, FL | 3.0 | 2.5 | 1728 | $3,100 | $1.79 | 24d | 1 | 0.81mi |
| 533 Prestwick Cir Palm Beach Gardens, FL | 2.0 | 2.0 | 1514 | $4,000 | $2.64 | 24d | 1 | 0.81mi |
| 150 Old Meadow Way Palm Beach Gardens, FL | 2.0 | 2.0 | 1418 | $6,999 | $4.94 | 20d | 1 | 0.83mi |
| 135 Old Meadow Way Palm Beach Gardens, FL | 2.0 | 2.0 | 1418 | $6,000 | $4.23 | 24d | 1 | 0.84mi |
| 229 Old Meadow Way Palm Beach Gardens, FL | 3.0 | 3.0 | 1694 | $4,500 | $2.66 | 24d | 1 | 0.85mi |
| 103 Old Meadow Way Palm Beach Gardens, FL | 2.0 | 2.0 | 1491 | $3,600 | $2.41 | 14d | 1 | 0.87mi |
| 364 Prestwick Cir #4 Palm Beach Gardens, FL | 2.0 | 2.5 | 1466 | $2,600 | $1.77 | 24d | 1 | 0.89mi |
| 505 Prestwick Cir Palm Beach Gardens, FL | 3.0 | 2.0 | 1850 | $3,250 | $1.76 | 3d | 1 | 0.89mi |
| 479 Prestwick Cir Palm Beach Gardens, FL | 3.0 | 2.0 | 1818 | $9,500 | $5.23 | 24d | 1 | 0.97mi |
| 352 Prestwick Cir #1 Palm Beach Gardens, FL | 2.0 | 3.0 | 1532 | $2,700 | $1.76 | 24d | 1 | 1.01mi |
| 359 Prestwick Cir #2 Palm Beach Gardens, FL | 2.0 | 3.0 | 1532 | $3,400 | $2.22 | 24d | 1 | 1.02mi |
| 401 Resort Ln Palm Beach Gardens, FL | 3.0 | 2.5 | 1710 | $9,600 | $5.61 | 24d | 1 | 1.04mi |
| 355 Prestwick Cir #4 Palm Beach Gardens, FL | 2.0 | 3.0 | 1532 | $3,500 | $2.28 | 24d | 1 | 1.06mi |
| 438 Brackenwood Ln S Palm Beach Gardens, FL | 2.0 | 2.0 | 1366 | $3,000 | $2.20 | 24d | 1 | 1.08mi |
| 428 Brackenwood Ln S Palm Beach Gardens, FL | 2.0 | 2.0 | 1366 | $2,500 | $1.83 | 24d | 1 | 1.08mi |
| 1802 Rosewood Way Palm Beach Gardens, FL | 2.0 | 2.0 | 1355 | $3,550 | $2.62 | 22d | 1 | 1.09mi |
| 1804 Rosewood Way Palm Beach Gardens, FL | 3.0 | 2.0 | 1615 | $8,000 | $4.95 | 24d | 1 | 1.09mi |
| 107 Resort Ln Palm Beach Gardens, FL | 3.0 | 2.5 | 1710 | $11,000 | $6.43 | 24d | 1 | 1.11mi |
HOA detail condo
- Monthly dues
- $937 · $11,244/yr
- Assessments
- None detected in remarks — confirm with the listing agent.
Listing history 11 events
-
2026-04-21status Pending
-
2026-03-31price $250,000
-
2026-03-31price $274,990
-
2026-03-15price $275,000
-
2026-03-03price $299,000
-
2026-02-27price $314,990
-
2026-02-11price $315,000
-
2026-01-30price $324,990
-
2026-01-20price $325,000
-
2026-01-02$350,000 Active
-
2025-12-29historical $350,000
ⓘ Source: listings_history table (triggers on properties + properties_extension) + one-shot
backfill from property_details.listing_events for pre-trigger history.
Climate risk First Street
- Flood 3/10 Moderate FEMA zone X (unshaded) · 20% chance over 30 yrs
- Wildfire 4/10 Moderate
- Heat 9/10 Extreme 6 d/yr ≥106°F today · 21 d/yr by 30 yrs out
- Wind 10/10 Extreme 99% chance of damaging wind over 30 yrs
- Air quality 2/10 Low 0 unhealthy d/yr today · 1 by 30 yrs out
Nearby sold comps map
Loading sold comps map…
Walkable amenities ~0.75 mi
Loading nearby amenities…
Taxation est. · year 1
- Rental income
- $46,338
- − Mortgage interest
- −$14,004
- − Property taxes
- −$3,750
- − Insurance
- −$1,250
- − Repairs & maintenance
- −$3,707
- − Management
- −$3,707
- − HOA
- −$11,244
- − Depreciation
- −$7,273
- Taxable income
- $1,403
- Est. tax owed @ 24.0%
- −$337
- After-tax cash flow
- $4,294/yr
For passive investors: Depreciation is non-cash, so a rental often shows a tax loss while cash-flowing — sheltering income. Rental losses are passive: they offset passive income freely, and up to $25,000/yr can offset ordinary (W-2) income if you actively participate and your MAGI is under $100k (phasing out to $0 by $150k); unused losses carry forward. On sale, claimed depreciation is recaptured at up to 25%, and gains may owe capital-gains tax (a 1031 exchange can defer both). Figures are a year-1 estimate at your 24.0% rate — not tax advice; consult a CPA.
Schools (NCES district)
- District
- Palm Beach
- NCES district ID
- 1201500
- Math proficiency
- 46% ▼ -16.00%
- Reading proficiency
- 53% ▼ -4.00%
- Median HH income
- $53,943
- Composite
- 42.72/100
- National rank
- #3160
- State rank
- #34 of 73 in FL
Livability — Palm Beach Gardens
- Score
- 69/100
- State rank
- #464
- US rank
- #8366
Category grades
Schools grade is shown separately in the Schools card above.
Census & demographics
- Census place
- Palm Beach Gardens, FL
- County
- Palm Beach County · 1,438,312 people
- City population
- 96,294
- Metro
- Miami-Fort Lauderdale-Pompano Beach, FL
- Population (ZIP)
- 43,676
- Household income
- $125,497
- Rent vs Own
- Severe rent burden
- 1339.0
Population outlook (Palm Beach County) Hauer SSP2
- Today (2025)
- 1,637,487 people
- By 2030
- 1,743,255 · +6.5%
- By 2040
- 1,948,712 · +19.0%
- By 2050
- 2,132,979 · +30.3%
- By 2075
- 2,530,027 · +54.5%
- By 2100
- 2,706,979 · +65.3%
Race, ethnicity, and origin ACS 2023
- Neighborhood character
- Predominantly White (75%)
- Race & ethnicity
- White 75% Hispanic / Latino 13% Two or more races 9% Black 5% Asian 4%
- Hispanic origin (detail)
- Mexican 2% Puerto Rican 2% Cuban 2%
- Common ancestry
- Romanian 5% Lithuanian 4% Scotch-Irish 4%
- Foreign-born
- 15% · Canada, China, Jamaica
- Languages at home
- 83% English-only · Spanish 8% German/W. Germanic 2% Other Indo-European 2%
Political lean MEDSL · Palm Beach
- 2024 margin
- Toss-up / Even · D 50.0% · R 49.2%
- 2008→2024 swing
- -22.1pp toward R · 2008: 22.9pp · 2024: 0.8pp
- All cycles
- 2024: D+0.8 2020: D+12.8 2016: D+15.3 2012: D+17.0 2008: D+22.9
Not yet ingested
- Civics
- —
Market trends
- HPI YoY
- ▼ -172.79%
- Current HPI
- 361.1997
- Rent YoY
- ▲ 2.00%
- Metro
- Miami-Fort Lauderdale-Pompano Beach, FL
- State GDP YoY
- ▲ 3.28%
- F500 in state
- 36
Industry mix (Fortune 500 HQ in FL)
| Industry | F500 HQs | Revenue |
|---|---|---|
| Industrial Technology | 2 | $29B |
|
||
| Insurance | 2 | $17B |
|
||
| Retail | 1 | $60B |
|
||
| Technology Distribution | 1 | $58B |
|
||
| Homebuilding | 1 | $35B |
|
||
| Technology Manufacturing | 1 | $35B |
|
||
Price history
-28.6% since first listed11 events — show timeline
- 2026-04-21 Pending — Beaches MLS
- 2026-03-31 Price Changed $250,000 Beaches MLS
- 2026-03-31 Price Changed $274,990 Beaches MLS
- 2026-03-15 Price Changed $275,000 Beaches MLS
- 2026-03-03 Price Changed $299,000 Beaches MLS
- 2026-02-27 Price Changed $314,990 Beaches MLS
- 2026-02-11 Price Changed $315,000 Beaches MLS
- 2026-01-30 Price Changed $324,990 Beaches MLS
- 2026-01-20 Price Changed $325,000 Beaches MLS
- 2026-01-02 Listed $350,000 Beaches MLS
- 2025-12-29 Coming Soon $350,000 Beaches MLS
Cash-flow waterfall
monthlySold comps — $/sqft
last 12 mo · ≤1 miLoading sold comps…