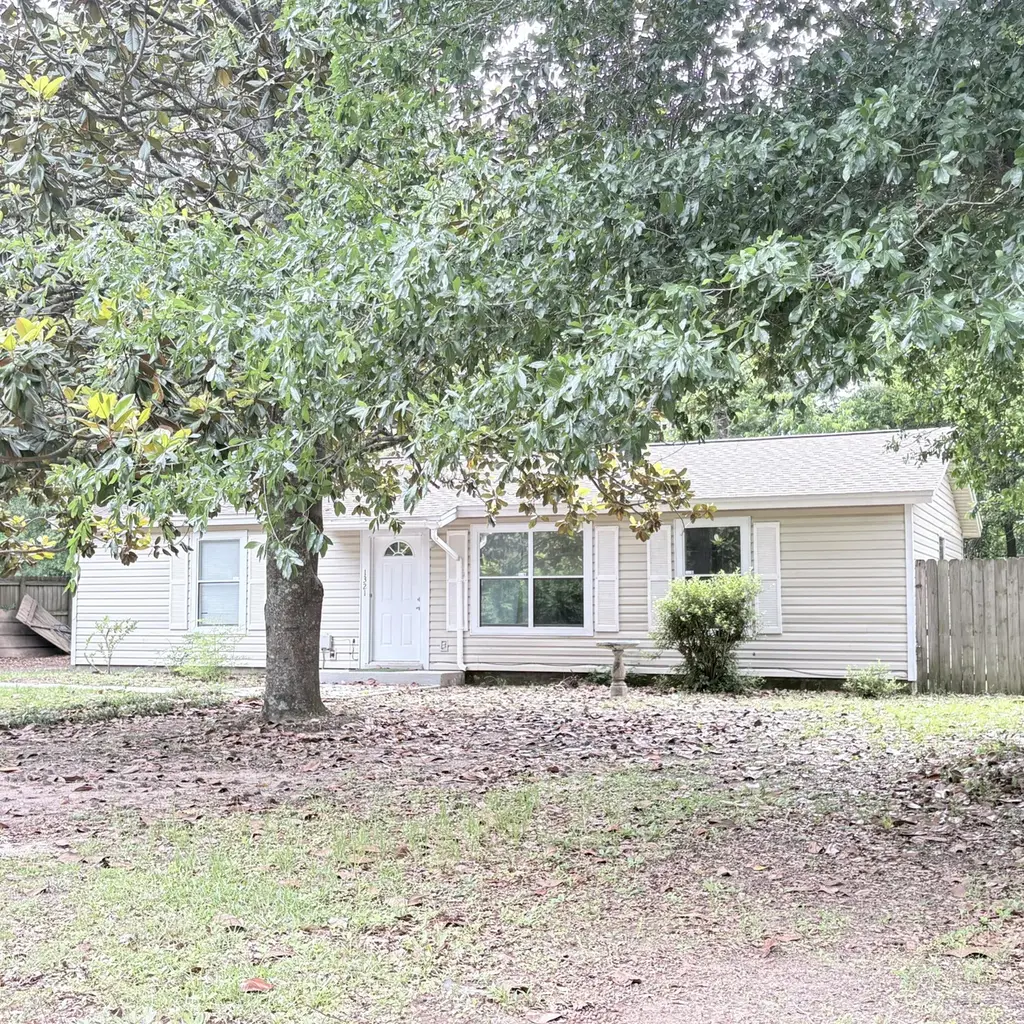
1321 Sunshine Dr · Crestview, FL
Flood risk 6/10 · Moderate
- FEMA flood zone
- X (unshaded)
- Chance of flooding over 30 yrs
- 0.94%
- Est. flood insurance / yr
- $507 – $1,088
Fire risk 4/10 · Minor
- Est. fire insurance / yr
- $947 – $1,759
Heat risk 9/10 · Severe
- Hot days now (above 107°F)
- 7 days/yr
- Hot days in 30 yrs
- 19 days/yr
Wind risk 9/10 · Severe
- Chance of severe wind over 30 yrs
- 99.0%
Air-quality risk 2/10 · Minimal
- Unhealthy air days now
- 1 days/yr
- Unhealthy air days in 30 yrs
- 1 days/yr
Risk factors via First Street. Map © Google.
Why this score? — see what drove the B grade
The composite is a weighted blend of 9 inputs, each scored 0–100. Each bar is that input's sub-score; the figure is the points it added to the 100-point composite (weight × sub-score).
- Cash flow +28.1/30.0
- ARV discount +15.0/15.0
- DSCR +10.0/10.0
- 1% rule +7.0/10.0
- Schools +5.2/10.0
- Livability +3.8/5.0
- Rent growth +2.5/5.0
- Condition / age +2.5/5.0
- Appreciation +0.0/10.0
$159,900
🖨 Deal sheet (PDF) 📄 Offer letter ✓ Due diligence
Listing remarks
Investment opportunity with major upside potential! This home was mostly remodeled prior to a pipe break over the winter, and much of the restoration work has already begun. Drywall has been demoed and partially replaced, and the property features brand-new flooring throughout. Situated on a super large lot with plenty of space and possibilities, this is a great opportunity for investors, flippers, or buyers looking to add their finishing touches and build equity.
Key facts
- Brand-new flooring
- Mostly remodeled
- Super large lot
Tags
Property features AI
Finance
- HOA & community: Subdivision: METES & BOUNDS
Exterior
- Parking: Paved road frontage
- Security: Smoke detector(s)
- Utilities: Community water; Septic tank; Electric service; Phone available; TV cable available
- Home design: Ranch style; 1 story; Entry level: first floor; Composite shingle roof
- Construction: Built in 1983; Frame construction with vinyl siding; Slab foundation
- Exterior features: Lot accessed by a paved county road; Lot dimensions approximately 85 x 185 x 85 x 185; Zoned for single-family residential
Interior
- Kitchen: Kitchen on the first floor; Dishwasher; Microwave; Refrigerator
- Bedrooms: 3 bedrooms; Master bedroom on the first floor with tile master bathroom
- Flooring: Tile
- Bathrooms: 2 full bathrooms
- Heating & cooling: Central heating; Central air conditioning; Electric heat control; Ridge vent
- Interior features: Tile flooring; Smoke detector(s); Ranch single-story layout
- Laundry & utility: Electric water heater
Neighborhood map
What this means for you Summary
Snapshot
- This is a 3-bed/2.0-bath single-family listed at $160k.
Deal economics
- At list price, monthly cash flow is $502 ($6k/yr) — positive.
- The deal already cash-flows at list — no discount required.
- Meets the 1% rule at list price ($2k rent vs $160k).
- Recommended offer: $155k (3.0% below list) — sets the bar for market timing.
- Cap rate 10.1% vs local median 4.4% in Crestview — top-decile yield for the area; either an underpriced asset or a hidden risk that comps aren't pricing in. Stress-test before assuming the spread holds.
Location & tenants
- Location reads 75/100 on livability (#252 in FL, #3,858 nationally) — a middle-class / working-renter tenant base. Strengths: cost of living A+, housing A+, health & safety A+; Watch: employment D, amenities F, commute F.
- Okaloosa (other): math 60% / reading 60% proficiency, ranked #12 of 73 in FL (top 16%) — acceptable for families but not a draw, mixed tenant base, ~2y average lease.
- Zoned schools: Walker Elementary School (math 52% / reading 55%, grade C, #949 of 2,144 statewide, top 45%, 864 students, 61% FRL); Crestview High School (math 49% / reading 54%, grade D+, #167 of 667 statewide, top 25%, 2,315 students, 42% FRL) — zoned schools average 52% FRL vs 36% district-wide (16 pts higher); higher-poverty schools than district average — tighter screening recommended.
- Market conditions: Rents flat; 526 active listings in the ZIP; 5 comparable units currently listed for rent nearby; rentals lingering (median 46d on market — plan ~5-8 weeks vacancy on turnover, expect pricing pressure); 60% of comp listings sitting > 30 days — soft ceiling on asking rent; 1,268 units permitted in Okaloosa County in 2024 (175 in 5+ unit buildings).
- This rent runs 31% of the median local income ($74k/yr) — at the standard rent-burdened threshold; future hikes will face affordability resistance.
Forward outlook
- Local home prices are declining (-3.0%/yr); year-one equity from $1k of loan paydown is wiped out by about $5k of value loss. Plan a longer hold.
- Okaloosa County population projected at +37% by 2050 — long-run rental-demand tailwind backs the buy-and-hold thesis.
Negotiation context
- It's been on market 41 days — a 3% lower offer ($155k) is reasonable based on typical stale-listing flexibility.
- 8 sale attempts since 29y ago with the ask held roughly flat each time — persistent listings suggest the price (not the market) is what's stuck; bring a comps-based counter.
- Current owner paid $82k; list at $160k implies a 95% gain — meaningful room to come down on a strong offer.
Risks & watch-outs
- Climate carrying-cost: major flood risk; severe wind risk, 99% chance of damaging wind over 30y; extreme-heat days projected 7→19/yr by 2055 (HVAC capex compounding) — expect insurance premiums to compound above CPI over the hold.
Questions for the listing agent
- It's been on market 41 days. Have you received any prior offers? Is the seller open to a 3% concession, seller financing, or rate buy-down credit?
- Is there a deadline driving the sale (1031 exchange, divorce, estate, relocation)? That informs how much negotiation room exists.
- Schools are B-rated — typically a magnet for longer-tenancy family renters. What's the average tenant stay here, and is there a school-zone premium baked into asking?
- What's the average days-on-market for RENTAL listings here right now (not sales)? A rising rental-DOM trend means longer vacancies and softer asking-rent achievability than the comps imply.
- What's the recent tenant-quality profile in this submarket — average credit score on applications, eviction rate, late-payment / NSF rate, and stable-employment percentage? A property-management company in the area should have these aggregated.
- How much new for-sale + rental construction is in the pipeline within 1–3 miles? Heavy new supply typically softens prices + rents 12–24 months out; constrained supply supports both.
Investment metrics
- 1% rule
- 1.20% ✓
- Cap rate
- 10.06%
- Cash-on-cash
- 13.46%
- DSCR
- 1.60
- GRM
- 6.9
CMA / ARV
- ARV (median comp)
- $227,843
- List price
- $159,900
- Delta
- -29.82%
- Verdict
- UNDERPRICED
- Comps
- 20 within 1.0 mi
Show comp detail 1 sale within ~0.75 mi
| Address | Dist | Beds/Ba | Sqft | Sold | Price | $/sf | Match |
|---|---|---|---|---|---|---|---|
| 2899 Wisteria Ave | 0.61mi | 3/2.0 | 1,025 (-9%) | 10mo | $220,000 | $215 | 48 |
Match score weights: distance 35% · size 25% · config 20% · recency 20%. Top-matched comps best support the ARV.
Projected returns pro-forma
-3.0% appreciation · 0.12% rent growth · sell at horizon
- IRR
- 0.4%
- Equity multiple
- 1.01×
- Total profit
- $627
- Equity at exit
- $23,842
- IRR
- 7.0%
- Equity multiple
- 1.46×
- Total profit
- $20,649
- Equity at exit
- $13,825
Cash invested: $44,772 (down + closing). Projections, not guarantees.
Landlord ↔ Tenant lean methodology
- Overall (STATE)
- 87 Strongly Landlord-Friendly
- State Florida
- 87 Strongly Landlord-Friendly · R+3
- County
- — inherits STATE
- City
- — inherits STATE
ZIP-level market 32539
- Home prices YoY
- -17.8%
- Rents YoY
- 0.1%
- Active inventory
- 526
- Price-to-rent
- 6.9×
Monthly cashflow live
- Estimated rent
- $1,922 high interval (Pro) →
- Mortgage (P&I)
- −$839
- Tax from tax record
- −$111 /mo · $1,331/yr
- Insurance
- −$67
- HOA
- −$0
- Vacancy / Maint / Mgmt
- −$404
- Net cashflow
- $502
Break-even live
Sensitivity live
| Price | -10% $593 | -5% $547 | +0% $502 | +5% $457 | +10% $412 |
|---|---|---|---|---|---|
| Rent | -10% $350 | -5% $426 | +0% $502 | +5% $578 | +10% $654 |
| Rate | -1.0pp $583 | -0.5pp $543 | base $502 | +0.5pp $461 | +1.0pp $418 |
UW: 25.0% down · 7.5% · 30yr · 1.5% tax · 5.0% vac · 8.0% maint · 8.0% mgmt
Financing live
Cash to close
- Down payment
- $39,975
- Closing costs
- $4,797
- Reserves months
- —
- Total cash needed
- —
Loan-product check · same deal, 3 products live
Conventional
25% down · 7.5% · 30yr
- Down + closing
- —
- Monthly P&I
- —
- Monthly cashflow
- —
- DSCR
- —
- Eligible?
- —
Personal DTI + credit; lowest rate.
DSCR
20% down · 8.5% · 30yr
- Down + closing
- —
- Monthly P&I
- —
- Monthly cashflow
- —
- DSCR
- —
- Eligible?
- —
No personal income docs; deal must DSCR.
Hard money
10% down · 12.0% · 12mo
- Down + closing
- —
- Monthly P&I
- —
- Monthly cashflow
- —
- DSCR
- —
- Eligible?
- —
Short-term bridge; refi at stabilization.
Rent comps 5 comps
| Address | Beds | Baths | Sqft | Rent | $/sqft | DOM | Units | Dist |
|---|---|---|---|---|---|---|---|---|
| 2942 Sholtz Ave Crestview, FL | 3.0 | 2.0 | 1266 | $1,600 | $1.26 | 45d | 1 | 0.82mi |
| 6260 Old Bethel Rd Crestview, FL | 1.0–3.0 | 1.0–2.0 | 1253 | $2,295 | $1.83 | 15d | 66 | 0.95mi |
| 502 Hyde Park Dr Crestview, FL | 3.0 | 2.0 | 1302 | $1,795 | $1.38 | 15d | 1 | 1.01mi |
| 815 Valley Rd Crestview, FL | 3.0 | 2.5 | 1373 | $1,550 | $1.13 | 45d | 1 | 1.05mi |
| 205 Powell Dr Crestview, FL | 3.0 | 1.5 | 1008 | $1,400 | $1.39 | 45d | 1 | 1.11mi |
Listing history 33 events
-
2026-06-21days on market $159,900 Active 41 DOM
-
2026-06-18days on market $159,900 Active 38 DOM
-
2026-06-17days on market $159,900 Active 37 DOM
-
2026-06-16days on market $159,900 Active 36 DOM
-
2026-06-15days on market $159,900 Active 35 DOM
-
2026-06-14days on market $159,900 Active 33 DOM
-
2026-06-13days on market $159,900 Active 32 DOM
-
2026-06-10days on market $159,900 Active 30 DOM
-
2026-06-09days on market $159,900 Active 29 DOM
-
2026-06-08days on market $159,900 Active 28 DOM
-
2026-06-07days on market $159,900 Active 27 DOM
-
2026-06-05days on market $159,900 Active 24 DOM
-
2026-06-02days on market $159,900 Active 22 DOM
-
2026-06-01days on market $159,900 Active 21 DOM
-
2026-05-31days on market $159,900 Active 20 DOM
-
2026-05-30days on market $159,900 Active 19 DOM
-
2026-05-11$159,900 Active 468-char remark
-
2012-12-31historical
-
2011-07-29$85,000
-
2011-07-29$85,000
-
2010-07-14historical
-
2010-05-03$99,500
-
2010-05-03$99,500
-
2008-06-03soldstatus $82,000
-
2008-06-02soldstatus $82,000
-
2008-06-02soldstatus $82,000
-
2008-04-11$89,900
-
2008-04-11$89,900
-
2003-12-30soldstatus $65,000
-
1998-06-24soldstatus $59,500
-
1998-06-23soldstatus $59,500
-
1997-08-10$59,500
-
1990-04-01soldstatus $32,000
ⓘ Source: listings_history table (triggers on properties + properties_extension) + one-shot
backfill from property_details.listing_events for pre-trigger history.
Tax reassessment forecast FL · Resets to sale price
- Current annual tax
- $1,331 · $111/mo
- Projected year-2 tax
- $1,331 · $111/mo
- Expected delta
- $0/yr ($0/mo · 0.0%)
ⓘ Screening estimate from a state-policy table — verify with the county assessor before closing.
Climate risk First Street
- Flood 6/10 Major FEMA zone X (unshaded) · 94% chance over 30 yrs
- Wildfire 4/10 Moderate
- Heat 9/10 Extreme 7 d/yr ≥107°F today · 19 d/yr by 30 yrs out
- Wind 9/10 Extreme 99% chance of damaging wind over 30 yrs
- Air quality 2/10 Low 1 unhealthy d/yr today · 1 by 30 yrs out
Nearby sold comps map
Loading sold comps map…
Walkable amenities ~0.75 mi
Loading nearby amenities…
Taxation est. · year 1
- Rental income
- $23,060
- − Mortgage interest
- −$8,957
- − Property taxes
- −$1,331
- − Insurance
- −$800
- − Repairs & maintenance
- −$1,845
- − Management
- −$1,845
- − Depreciation
- −$4,652
- Taxable income
- $3,632
- Est. tax owed @ 24.0%
- −$872
- After-tax cash flow
- $5,153/yr
For passive investors: Depreciation is non-cash, so a rental often shows a tax loss while cash-flowing — sheltering income. Rental losses are passive: they offset passive income freely, and up to $25,000/yr can offset ordinary (W-2) income if you actively participate and your MAGI is under $100k (phasing out to $0 by $150k); unused losses carry forward. On sale, claimed depreciation is recaptured at up to 25%, and gains may owe capital-gains tax (a 1031 exchange can defer both). Figures are a year-1 estimate at your 24.0% rate — not tax advice; consult a CPA.
Schools (NCES district)
- District
- Okaloosa
- NCES district ID
- 1201380
- Math proficiency
- 60% ▼ -12.00%
- Reading proficiency
- 60% ▼ -4.00%
- Median HH income
- $55,601
- Composite
- 51.62/100
- National rank
- #1705
- State rank
- #12 of 73 in FL
Livability — Crestview
- Score
- 75/100
- State rank
- #252
- US rank
- #3858
Category grades
Schools grade is shown separately in the Schools card above.
Census & demographics
- County
- Okaloosa County · 194,352 people
- City population
- 58,889
- Metro
- Crestview-Fort Walton Beach-Destin, FL
- Population (ZIP)
- 33,290
- Household income
- $74,369
- Rent vs Own
- Severe rent burden
- 371.0
Population outlook (Okaloosa County) Hauer SSP2
- Today (2025)
- 235,133 people
- By 2030
- 253,483 · +7.8%
- By 2040
- 289,537 · +23.1%
- By 2050
- 322,954 · +37.3%
- By 2075
- 399,624 · +70.0%
- By 2100
- 425,311 · +80.9%
Race, ethnicity, and origin ACS 2023
- Neighborhood character
- Predominantly White (73%)
- Race & ethnicity
- White 73% Black 12% Two or more races 8% Hispanic / Latino 7% Asian 1%
- Hispanic origin (detail)
- Mexican 3% Puerto Rican 2%
- Common ancestry
- Lithuanian 4% Iranian 2% Romanian 2%
- Foreign-born
- 3% · Canada
- Languages at home
- 94% English-only · Spanish 3% Russian/Polish/Slavic 1% Other Asian/Pacific 1%
Political lean MEDSL · Okaloosa
- 2024 margin
- Solid R (+42.4) · D 28.2% · R 70.7% · Other 1.1%
- 2008→2024 swing
- +2.5pp toward D · 2008: -44.9pp · 2024: -42.4pp
- All cycles
- 2024: R+42.4 2020: R+39.1 2016: R+47.8 2012: R+49.4 2008: R+44.9
Not yet ingested
- Civics
- —
Market trends
- HPI YoY
- ▼ -56.52%
- Current HPI
- 261.1557
- Rent YoY
- ▲ 0.12%
- Metro
- Crestview-Fort Walton Beach-Destin, FL
- State GDP YoY
- ▲ 3.28%
- F500 in state
- 36
Industry mix (Fortune 500 HQ in FL)
| Industry | F500 HQs | Revenue |
|---|---|---|
| Industrial Technology | 2 | $29B |
|
||
| Insurance | 2 | $17B |
|
||
| Retail | 1 | $60B |
|
||
| Technology Distribution | 1 | $58B |
|
||
| Homebuilding | 1 | $35B |
|
||
| Technology Manufacturing | 1 | $35B |
|
||
Price history
+399.7% since first listed17 events — show timeline
- 2026-05-11 Listed $159,900 ECAR
- 2012-12-31 Listing Removed — NAMLS
- 2011-07-29 Listed $85,000 NAMLS
- 2011-07-29 Listed $85,000 ECAR
- 2010-07-14 Listing Removed — NAMLS
- 2010-05-03 Listed $99,500 NAMLS
- 2010-05-03 Listed $99,500 ECAR
- 2008-06-03 Sold (Public Records) $82,000 Public Records
- 2008-06-02 Sold (MLS) $82,000 ECAR
- 2008-06-02 Sold (MLS) $82,000 NAMLS
- 2008-04-11 Listed $89,900 ECAR
- 2008-04-11 Listed $89,900 NAMLS
- 2003-12-30 Sold (Public Records) $65,000 Public Records
- 1998-06-24 Sold (Public Records) $59,500 Public Records
- 1998-06-23 Sold (MLS) $59,500 NAMLS
- 1997-08-10 Listed $59,500 NAMLS
- 1990-04-01 Sold (Public Records) $32,000 Public Records
Property tax history
+5.3%/yrLatest (2025): $1,331 · +3.6% YoY. Source: county tax records.
Cash-flow waterfall
monthlySold comps — $/sqft
last 12 mo · ≤1 miLoading sold comps…