2990 San Pablo Dam Rd #8 · San Pablo, CA
Flood risk 1/10 · Minimal
- FEMA flood zone
- X (unshaded)
- Chance of flooding over 30 yrs
- 0.0%
- Est. flood insurance / yr
- $507 – $1,088
Fire risk 4/10 · Minor
- Est. fire insurance / yr
- $659 – $1,223
Heat risk 3/10 · Minor
- Hot days now (above 87°F)
- 6 days/yr
- Hot days in 30 yrs
- 12 days/yr
Wind risk 1/10 · Minimal
- Chance of severe wind over 30 yrs
- —
Air-quality risk 8/10 · Major
- Unhealthy air days now
- 15 days/yr
- Unhealthy air days in 30 yrs
- 15 days/yr
Risk factors via First Street. Map © Google.
Why this score? — see what drove the B- grade
The composite is a weighted blend of 9 inputs, each scored 0–100. Each bar is that input's sub-score; the figure is the points it added to the 100-point composite (weight × sub-score).
- Cash flow +30.0/30.0
- 1% rule +10.0/10.0
- DSCR +10.0/10.0
- ARV discount +7.5/15.0
- Rent growth +3.3/5.0
- Schools +3.0/10.0
- Livability +2.9/5.0
- Condition / age +2.5/5.0
- Appreciation +0.0/10.0
$129,000
🖨 Deal sheet 📄 Offer letter ✓ Due diligence
Listing remarks MLS
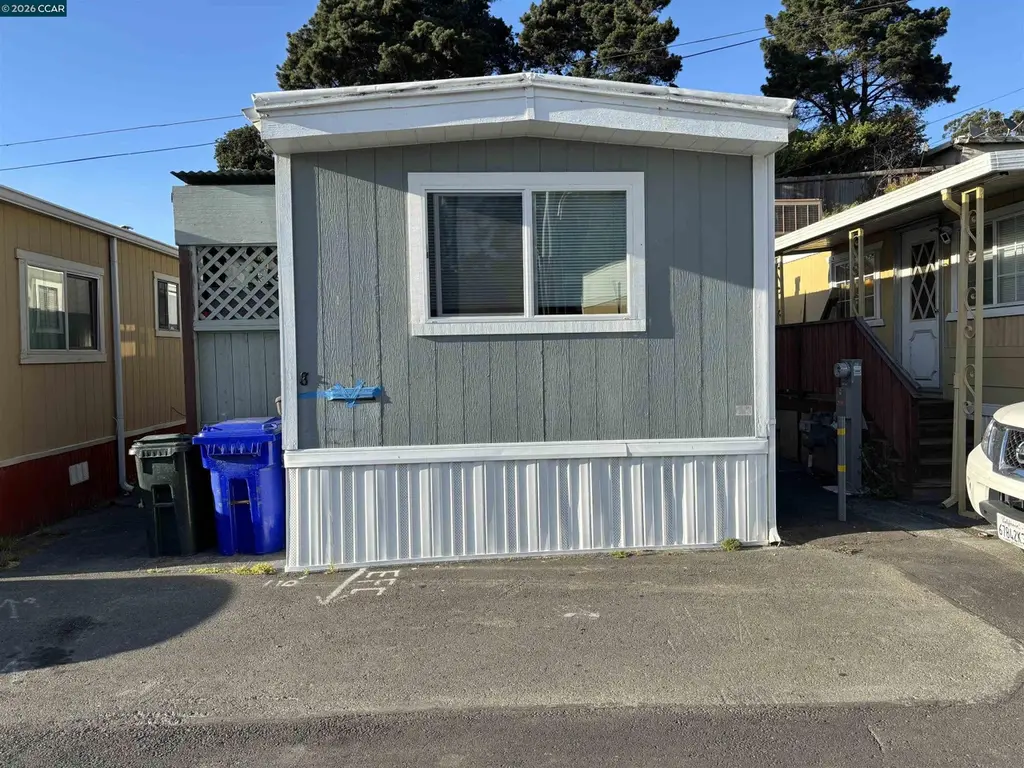
Super Clean and Updated Mobile in the Frontier Mobile Home Park. Special Features include Dual Pane Windows Side X Side Washer and Dryer in Laundry Area, and 2 Parking Spaces. The extra room could be used as a second bedroom with a closet addition. Schedule a Showing Appointment right away!!!
Key facts
- 2 parking spaces
- Dual pane windows
- Garage
Tags
Neighborhood map
What this means for you Summary
Snapshot
- This is a 2-bed/1.0-bath manufactured listed at $129k.
Deal economics
- At list price, monthly cash flow is $812 ($10k/yr) — positive.
- The deal already cash-flows at list — no discount required.
- Meets the 1% rule at list price ($2k rent vs $129k).
- Recommended offer: $121k (6.0% below list) — sets the bar for market timing.
- Cap rate 13.8% vs local median 2.9% in San Pablo — top-decile yield for the area; either an underpriced asset or a hidden risk that comps aren't pricing in. Stress-test before assuming the spread holds.
Location & tenants
- Location reads 58/100 on livability (#715 in CA) — a working-class tenant base; expect higher turnover. Strengths: commute A+, housing B+; Watch: schools F, crime F, amenities F.
- West Contra Costa Unified (suburban): math 24% / reading 35% proficiency, ranked #993 of 1,400 in CA (top 71%) — low school quality limits family demand, transient renter base, plan for 1-2y turnover.
- Market conditions: Rents rising (+3.1%/yr); 123 active listings in the ZIP; 19 comparable units currently listed for rent nearby; rentals at typical pace (median 24d on market — plan ~3-4 weeks tenant-placement turnaround); solid renter incomes; 2,169 units permitted in Contra Costa County in 2024 (896 in 5+ unit buildings).
- This rent runs 30% of the median local income ($86k/yr) — at the standard rent-burdened threshold; future hikes will face affordability resistance.
Forward outlook
- Local home prices are declining (-3.0%/yr); year-one equity from $892 of loan paydown is wiped out by about $4k of value loss. Plan a longer hold.
- Contra Costa County population projected at +26% by 2050 — long-run rental-demand tailwind backs the buy-and-hold thesis.
- At projected returns (-3.0% appreciation + 3.1% rent growth), your $36k cash investment doubles in ~5 years — after that, you're playing with house money.
Negotiation context
- It's been on market 71 days — a 6% lower offer ($121k) is reasonable based on typical stale-listing flexibility.
- 3 sale attempts since 8y ago with the ask held roughly flat each time — persistent listings suggest the price (not the market) is what's stuck; bring a comps-based counter.
- Current owner paid $60k; list at $129k implies a 115% gain — meaningful room to come down on a strong offer.
Questions for the listing agent
- It's been on market 71 days. Have you received any prior offers? Is the seller open to a 6% concession, seller financing, or rate buy-down credit?
- Why hasn't it sold? Are there any deal-killer items the seller is aware of (foundation, flood, title, zoning, code violations)?
- Is there a deadline driving the sale (1031 exchange, divorce, estate, relocation)? That informs how much negotiation room exists.
- Schools are F-rated, which usually means shorter tenancies and higher turnover. Who's the typical renter profile here, and what's been the actual vacancy rate?
- Crime grade is F in this area — have there been break-ins, vandalism, or insurance claims at this property in the last 3 years? What carrier currently insures it and at what premium?
- What's the average days-on-market for RENTAL listings here right now (not sales)? A rising rental-DOM trend means longer vacancies and softer asking-rent achievability than the comps imply.
- What's the recent tenant-quality profile in this submarket — average credit score on applications, eviction rate, late-payment / NSF rate, and stable-employment percentage? A property-management company in the area should have these aggregated.
- How much new for-sale + rental construction is in the pipeline within 1–3 miles? Heavy new supply typically softens prices + rents 12–24 months out; constrained supply supports both.
Investment metrics
- 1% rule
- 1.67% ✓
- Cap rate
- 13.84%
- Cash-on-cash
- 26.97%
- DSCR
- 2.20
- GRM
- 5.0
CMA / ARV
- ARV (median comp)
- $80,000
- List price
- $129,000
- Delta
- 61.25%
- Verdict
- OVERPRICED
- Comps
- 2 within 2.0 mi
Projected returns pro-forma
-3.0% appreciation · 3.06% rent growth · sell at horizon
- IRR
- 21.0%
- Equity multiple
- 1.86×
- Total profit
- $30,965
- Equity at exit
- $19,234
- IRR
- 29.2%
- Equity multiple
- 3.61×
- Total profit
- $94,210
- Equity at exit
- $11,154
Cash invested: $36,120 (down + closing). Projections, not guarantees.
Landlord ↔ Tenant lean methodology
- Overall (STATE)
- 18 Strongly Tenant-Friendly
- State California
- 18 Strongly Tenant-Friendly · D+13
- County
- — inherits STATE
- City
- — inherits STATE
ZIP-level market 94806
- Rents YoY
- 3.1%
- Active inventory
- 123
- Price-to-rent
- 5.0×
Monthly cashflow live
- Estimated rent
- $2,156 high interval (Pro) →
- Mortgage (P&I)
- −$676
- Tax est. 1.5%
- −$161 /mo · $1,935/yr
- Insurance
- −$54
- HOA
- −$0
- Vacancy / Maint / Mgmt
- −$453
- Net cashflow
- $812
Break-even live
UW: 25.0% down · 7.5% · 30yr · 1.5% tax · 5.0% vac · 8.0% maint · 8.0% mgmt
Financing live
Cash to close
- Down payment
- $32,250
- Closing costs
- $3,870
- Reserves months
- —
- Total cash needed
- —
Loan-product check · same deal, 3 products live
Conventional
25% down · 7.5% · 30yr
- Down + closing
- —
- Monthly P&I
- —
- Monthly cashflow
- —
- DSCR
- —
- Eligible?
- —
Personal DTI + credit; lowest rate.
DSCR
20% down · 8.5% · 30yr
- Down + closing
- —
- Monthly P&I
- —
- Monthly cashflow
- —
- DSCR
- —
- Eligible?
- —
No personal income docs; deal must DSCR.
Hard money
10% down · 12.0% · 12mo
- Down + closing
- —
- Monthly P&I
- —
- Monthly cashflow
- —
- DSCR
- —
- Eligible?
- —
Short-term bridge; refi at stabilization.
Rent comps 19 comps
| Address | Beds | Baths | Sqft | Rent | $/sqft | DOM | Units | Dist |
|---|---|---|---|---|---|---|---|---|
| 5405 Morrow Dr Unit 1 San Pablo, CA | 2.0 | 1.0 | 700 | $2,225 | $3.18 | 43d | 1 | 0.08mi |
| 6090 N Arlington Blvd Unit B San Pablo, CA | 1.0 | 1.0 | 400 | $1,650 | $4.12 | 43d | 1 | 0.44mi |
| 1330 Contra Costa Ave San Pablo, CA | 2.0 | 1.0–1.5 | 721 | $2,895 | $4.02 | 5d | 8 | 0.50mi |
| 13728 San Pablo Ave San Pablo, CA | 1.0 | 1.0 | 526 | $1,563 | $2.97 | 24d | 1 | 0.56mi |
| 3535 El Portal Dr El Sobrante, CA | 1.0–3.0 | 1.0–3.0 | 969 | $3,212 | $3.31 | 1d | 16 | 0.77mi |
| 1680 24th St San Pablo, CA | 2.0 | 1.0 | 636 | $1,895 | $2.98 | 1d | 1 | 0.91mi |
| 14349 San Pablo Ave San Pablo, CA | 1.0 | 1.0 | 750 | $1,700 | $2.27 | 43d | 1 | 0.98mi |
| 2014 22nd St San Pablo, CA | 1.0 | 1.0 | 500 | $1,800 | $3.60 | 24d | 1 | 0.99mi |
| 827 S 33rd St Unit 827 Richmond, CA | 2.0 | 1.0 | 731 | $2,150 | $2.94 | 12d | 1 | 1.09mi |
| 827 S 33rd St Unit 827 Richmond, CA | 2.0 | 1.0 | 731 | $2,150 | $2.94 | 43d | 1 | 1.09mi |
| 2031 Market Ave Unit private room San Pablo, CA | 2.0 | 1.0 | 700 | $1,200 | $1.71 | 43d | 1 | 1.12mi |
| 2031 Market Ave #124 San Pablo, CA | 2.0 | 1.0 | 691 | $1,000 | $1.45 | 18d | 1 | 1.12mi |
| 14761 San Pablo Ave Unit 6 San Pablo, CA | 2.0 | 1.0 | 750 | $2,550 | $3.40 | 43d | 1 | 1.17mi |
| 2300 Lancaster Dr Richmond, CA | 1.0 | 1.0 | 668 | $1,782 | $2.67 | 2d | 13 | 1.20mi |
| 649 El Centro Rd Unit 1546147P El Sobrante, CA | 1.0 | 1.0 | 592 | $1,879 | $3.17 | 14d | 1 | 1.31mi |
| 760 Alhambra Rd El Sobrante, CA | 2.0 | 1.0 | 725 | $2,150 | $2.97 | 24d | 1 | 1.43mi |
| 1333 Market Ave Unit 3 San Pablo, CA | 1.0 | 1.0 | 550 | $1,549 | $2.82 | 24d | 1 | 1.47mi |
| 1333 Market Ave Unit 2 San Pablo, CA | 1.0 | 1.0 | 550 | $1,549 | $2.82 | 43d | 1 | 1.47mi |
| 4481 Appian Way El Sobrante, CA | 1.0–2.0 | 1.0–1.5 | 750 | $3,033 | $4.04 | 24d | 2 | 1.48mi |
Listing history 20 events
-
2026-06-18days on market $129,000 Active 71 DOM
-
2026-06-17days on market $129,000 Active 70 DOM
-
2026-06-16days on market $129,000 Active 69 DOM
-
2026-06-15days on market $129,000 Active 68 DOM
-
2026-06-13days on market $129,000 Active 66 DOM
-
2026-06-13days on market $129,000 Active 65 DOM
-
2026-06-09days on market $129,000 Active 62 DOM
-
2026-06-08days on market $129,000 Active 61 DOM
-
2026-06-07days on market $129,000 Active 60 DOM
-
2026-06-04days on market $129,000 Active 57 DOM
-
2026-06-03days on market $129,000 Active 56 DOM
-
2026-06-02days on market $129,000 Active 55 DOM
-
2026-06-01days on market $129,000 Active 54 DOM
-
2026-05-31days on market $129,000 Active 53 DOM
-
2026-04-08$129,000 Active 293-char remark
Show marketing remark (293 chars)
Super Clean and Updated Mobile in the Frontier Mobile Home Park. Special Features include Dual Pane Windows Side X Side Washer and Dryer in Laundry Area, and 2 Parking Spaces. The extra room could be used as a second bedroom with a closet addition. Schedule a Showing Appointment right away!!!
-
2019-05-04historical
-
2019-03-12New
-
2018-06-06soldstatus $60,000 Sold
-
2018-05-25status Pending
-
2018-04-17$59,000 New
ⓘ Source: listings_history table (triggers on properties + properties_extension) + one-shot
backfill from property_details.listing_events for pre-trigger history.
Climate risk First Street
- Flood 1/10 Low FEMA zone X (unshaded) · 0% chance over 30 yrs
- Wildfire 4/10 Moderate
- Heat 3/10 Moderate 6 d/yr ≥87°F today · 12 d/yr by 30 yrs out
- Wind 1/10 Low
- Air quality 8/10 Severe 15 unhealthy d/yr today · 15 by 30 yrs out
Nearby sold comps map
Loading sold comps map…
Walkable amenities ~0.75 mi
Loading nearby amenities…
Taxation est. · year 1
- Rental income
- $25,873
- − Mortgage interest
- −$7,226
- − Property taxes
- −$1,935
- − Insurance
- −$645
- − Repairs & maintenance
- −$2,070
- − Management
- −$2,070
- − Depreciation
- −$3,753
- Taxable income
- $8,175
- Est. tax owed @ 24.0%
- −$1,962
- After-tax cash flow
- $7,780/yr
For passive investors: Depreciation is non-cash, so a rental often shows a tax loss while cash-flowing — sheltering income. Rental losses are passive: they offset passive income freely, and up to $25,000/yr can offset ordinary (W-2) income if you actively participate and your MAGI is under $100k (phasing out to $0 by $150k); unused losses carry forward. On sale, claimed depreciation is recaptured at up to 25%, and gains may owe capital-gains tax (a 1031 exchange can defer both). Figures are a year-1 estimate at your 24.0% rate — not tax advice; consult a CPA.
Schools (NCES district)
- District
- West Contra Costa Unified
- NCES district ID
- 0632550
- Math proficiency
- 24% ▲ 1.00%
- Reading proficiency
- 35% ▲ 1.00%
- Median HH income
- $64,837
- Composite
- 30.04/100
- National rank
- #11623
- State rank
- #993 of 1400 in CA
Livability — San Pablo
- Score
- 58/100
- State rank
- #715
- US rank
- #21354
Category grades
Schools grade is shown separately in the Schools card above.
Census & demographics
- Census place
- San Pablo, CA
- County
- Contra Costa County · 1,059,880 people
- Metro
- San Francisco-Oakland-Berkeley, CA
- Population (ZIP)
- 62,546
- Household income
- $86,034
- Rent vs Own
- Severe rent burden
- 2830.0
Population outlook (Contra Costa County) Hauer SSP2
- Today (2025)
- 1,287,720 people
- By 2030
- 1,364,937 · +6.0%
- By 2040
- 1,506,209 · +17.0%
- By 2050
- 1,624,373 · +26.1%
- By 2075
- 1,853,193 · +43.9%
- By 2100
- 1,901,231 · +47.6%
Race, ethnicity, and origin ACS 2023
- Neighborhood character
- Diverse neighborhood (Simpson 0.68)
- Race & ethnicity
- Hispanic / Latino 51% Two or more races 16% Asian 16% Black 13% White 12% Native American 1%
- Hispanic origin (detail)
- Mexican 34%
- Common ancestry
- Estonian 2% Italian 1% Russian 1%
- Foreign-born
- 38% · Canada, China, Vietnam
- Languages at home
- 39% English-only · Spanish 43% Other Indo-European 4% Tagalog/Filipino 3%
Political lean MEDSL · Contra Costa
- 2024 margin
- Solid D (+38.0) · D 67.3% · R 29.4% · Other 3.3%
- 2008→2024 swing
- +0.2pp no change · 2008: 37.8pp · 2024: 38.0pp
- All cycles
- 2024: D+38.0 2020: D+45.3 2016: D+43.5 2012: D+33.7 2008: D+37.8
Not yet ingested
- Civics
- —
Market trends
- HPI YoY
- ▼ -665.89%
- Current HPI
- 323.0082
- Rent YoY
- ▲ 3.06%
- Metro
- San Francisco-Oakland-Berkeley, CA
- State GDP YoY
- ▲ 3.21%
- F500 in state
- 116
Industry mix (Fortune 500 HQ in CA)
| Industry | F500 HQs | Revenue |
|---|---|---|
| Technology | 27 | $1,492B |
|
||
| Financial Services | 3 | $174B |
|
||
| Retail | 3 | $44B |
|
||
| Insurance | 3 | $26B |
|
||
| Media / Entertainment | 2 | $115B |
|
||
| Pharmaceuticals / Biotech | 2 | $62B |
|
||
Price history
+118.6% since first listed6 events — show timeline
- 2026-04-08 Listed $129,000 bridgeMLS, Bay East AOR, or Contra Costa AOR
- 2019-05-04 Listing Removed — bridgeMLS, Bay East AOR, or Contra Costa AOR
- 2019-03-12 Listed — bridgeMLS, Bay East AOR, or Contra Costa AOR
- 2018-06-06 Sold (MLS) $60,000 bridgeMLS, Bay East AOR, or Contra Costa AOR
- 2018-05-25 Pending — bridgeMLS, Bay East AOR, or Contra Costa AOR
- 2018-04-17 Listed $59,000 bridgeMLS, Bay East AOR, or Contra Costa AOR
Property tax history
+7.8%/yrLatest (2025): $110 · +2.4% YoY. Source: county tax records.
Cash-flow waterfall
monthlySold comps — $/sqft
last 12 mo · ≤1 miLoading sold comps…