5818 SE Windsong Ln #212 · Port Salerno, FL
Flood risk 1/10 · Minimal
- FEMA flood zone
- X (unshaded)
- Chance of flooding over 30 yrs
- 0.0%
- Est. flood insurance / yr
- $507 – $1,088
Fire risk 3/10 · Minor
- Est. fire insurance / yr
- $947 – $1,759
Heat risk 10/10 · Severe
- Hot days now (above 106°F)
- 7 days/yr
- Hot days in 30 yrs
- 24 days/yr
Wind risk 10/10 · Severe
- Chance of severe wind over 30 yrs
- 99.0%
Air-quality risk 2/10 · Minimal
- Unhealthy air days now
- 1 days/yr
- Unhealthy air days in 30 yrs
- 1 days/yr
Risk factors via First Street. Map © Google.
Why this score? — see what drove the C grade
The composite is a weighted blend of 9 inputs, each scored 0–100. Each bar is that input's sub-score; the figure is the points it added to the 100-point composite (weight × sub-score).
- Cash flow +16.9/30.0
- ARV discount +15.0/15.0
- 1% rule +6.1/10.0
- DSCR +5.2/10.0
- Schools +4.5/10.0
- Livability +3.5/5.0
- Rent growth +3.2/5.0
- Condition / age +2.2/5.0
- Appreciation +0.0/10.0
$210,000
🖨 Deal sheet 📄 Offer letter ✓ Due diligence
Listing remarks MLS
Tenant IUST Left VACANT EZ TO Show & Sell!!! WALK TO THE POOL FROM THIS GREAT LOCATION IN COURT 2! UNIT NEEDS TO BE UPDATED SOLD AS-IS! NEW A/C AND HWH 2021 AND NEW FENCE 2024. NEW METAL MANSARD IN 2019 AND NEW ROOF 2002 EMERALD LAKES IS A GATED COMMUNITY WITH 2 POOLS,TENNIS PICKLEBALL! WALK TO SHOPS AND EZ ACCESS TO BEACHES AND PORT SALERNO WATERFRONT RESTAURANTS!
Key facts
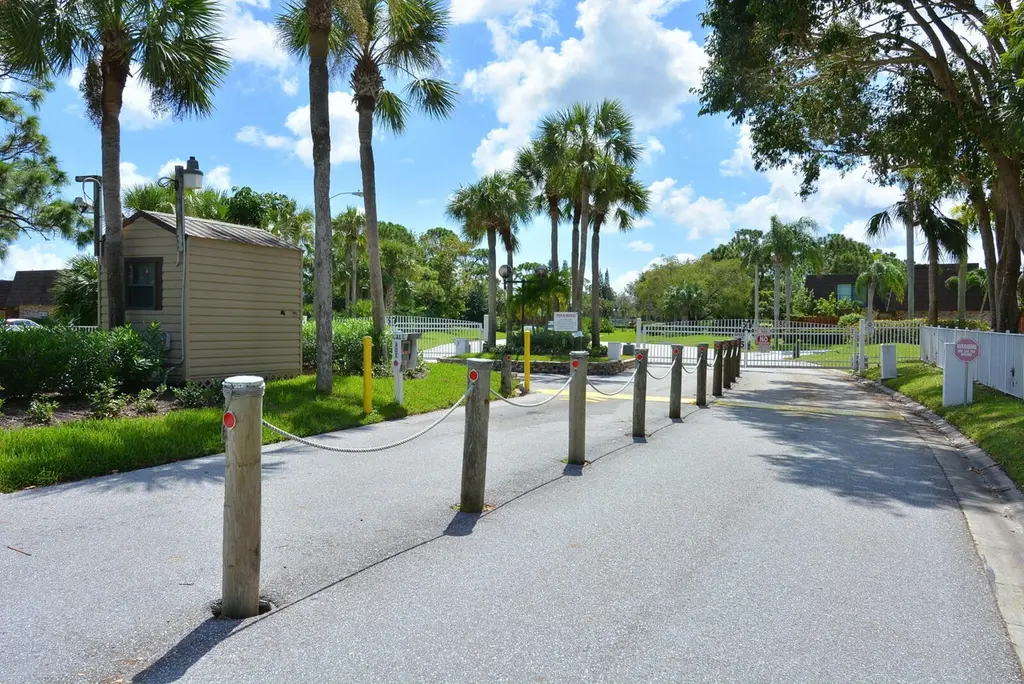
- Gated community
- Walk to shops
- Ez access to beaches
Tags
Neighborhood map
What this means for you Summary
Snapshot
- This is a 2-bed/2.5-bath townhouse listed at $210k. Condition is rated fair.
Deal economics
- At list price, monthly cash flow is $137 ($2k/yr) — positive.
- The deal already cash-flows at list — no discount required.
- Meets the 1% rule at list price ($2k rent vs $210k).
- Recommended offer: $185k (12.0% below list) — sets the bar for market timing.
- Cap rate 7.1% vs local median 3.1% in Port Salerno — top-decile yield for the area; either an underpriced asset or a hidden risk that comps aren't pricing in. Stress-test before assuming the spread holds.
Location & tenants
- Location reads 70/100 on livability (#440 in FL) — a middle-class / working-renter tenant base. Strengths: housing A+, crime A, health & safety A; Watch: schools D, amenities F, commute F.
- Martin (suburban): math 52% / reading 53% proficiency, ranked #24 of 73 in FL (top 33%) — acceptable for families but not a draw, mixed tenant base, ~2y average lease.
- Market conditions: Rents rising (+2.7%/yr); 588 active listings in the ZIP; 30 comparable units currently listed for rent nearby; rentals at typical pace (median 24d on market — plan ~3-4 weeks tenant-placement turnaround); solid renter incomes; 737 units permitted in Martin County in 2024 (167 in 5+ unit buildings).
- This rent runs 36% of the median local income ($78k/yr) — at the standard rent-burdened threshold; future hikes will face affordability resistance.
Forward outlook
- Local home prices are declining (-3.0%/yr); year-one equity from $1k of loan paydown is wiped out by about $6k of value loss. Plan a longer hold.
- Martin County population projected at +19% by 2050 — long-run rental-demand tailwind backs the buy-and-hold thesis.
Negotiation context
- It's been on market 254 days — a 12% lower offer ($185k) is reasonable based on typical stale-listing flexibility.
Risks & watch-outs
- Climate carrying-cost: severe wind risk, 99% chance of damaging wind over 30y; extreme-heat days projected 7→24/yr by 2055 (HVAC capex compounding) — expect insurance premiums to compound above CPI over the hold.
Questions for the listing agent
- It's been on market 254 days. Have you received any prior offers? Is the seller open to a 12% concession, seller financing, or rate buy-down credit?
- Have any recent inspections been done? Can we get a copy of the seller's disclosures and any deferred-maintenance estimates?
- What does the HOA fee cover, when was the last increase, and are there any pending special assessments or reserve-fund shortfalls?
- Why hasn't it sold? Are there any deal-killer items the seller is aware of (foundation, flood, title, zoning, code violations)?
- Is there a deadline driving the sale (1031 exchange, divorce, estate, relocation)? That informs how much negotiation room exists.
- Schools are D-rated, which usually means shorter tenancies and higher turnover. Who's the typical renter profile here, and what's been the actual vacancy rate?
- What's the average days-on-market for RENTAL listings here right now (not sales)? A rising rental-DOM trend means longer vacancies and softer asking-rent achievability than the comps imply.
- What's the recent tenant-quality profile in this submarket — average credit score on applications, eviction rate, late-payment / NSF rate, and stable-employment percentage? A property-management company in the area should have these aggregated.
- How much new for-sale + rental construction is in the pipeline within 1–3 miles? Heavy new supply typically softens prices + rents 12–24 months out; constrained supply supports both.
Investment metrics
- 1% rule
- 1.11% ✓
- Cap rate
- 7.07%
- Cash-on-cash
- 2.79%
- DSCR
- 1.12
- GRM
- 7.5
CMA / ARV
- ARV (on-the-fly)
- $261,464
- Comps found
- 12
Show comp detail 12 sales within ~0.75 mi
| Address | Dist | Beds/Ba | Sqft | Sold | Price | $/sf | Match |
|---|---|---|---|---|---|---|---|
| 5720 SE Windsong Ln #326 | 0.08mi | 2/2.5 | 1,288 (0%) | 1mo | $240,000 | $186 | 96 |
| 5773 SE Windsong Ln #603 | 0.07mi | 2/2.5 | 1,288 (0%) | 1mo | $289,000 | $224 | 96 |
| 5738 SE Windsong Ln #315 | 0.06mi | 2/2.5 | 1,288 (0%) | 3mo | $260,000 | $202 | 95 |
| 5806 SE Windsong Ln #217 | 0.03mi | 2/2.5 | 1,288 (0%) | 6mo | $230,000 | $179 | 94 |
| 6435 SE Windsong Ln #114 | 0.12mi | 2/2.5 | 1,288 (0%) | 2mo | $275,000 | $214 | 93 |
| 5675 SE Windsong Ln | 0.13mi | 2/2.5 | 1,288 (0%) | 2mo | $280,000 | $217 | 92 |
| 5662 SE Windsong Ln #408 | 0.12mi | 2/2.5 | 1,288 (0%) | 4mo | $232,000 | $180 | 91 |
| 5627 SE Windsong Ln #514 | 0.19mi | 2/2.5 | 1,288 (0%) | 2mo | $242,500 | $188 | 90 |
| 6451 SE Windsong Ln | 0.11mi | 2/2.5 | 1,288 (0%) | 7mo | $295,000 | $229 | 89 |
| 5693 SE Windsong Ln #545 | 0.14mi | 2/2.5 | 1,288 (0%) | 6mo | $262,000 | $203 | 88 |
| 5609 SE Windsong Ln | 0.17mi | 2/2.5 | 1,288 (0%) | 8mo | $245,000 | $190 | 85 |
| 4500 SE Salvatori Rd | 0.57mi | 3/2.0 (+1) | 1,140 (-12%) | 3mo | $250,000 | $219 | 45 |
Match score weights: distance 35% · size 25% · config 20% · recency 20%. Top-matched comps best support the ARV.
Projected returns pro-forma
-3.0% appreciation · 2.71% rent growth · sell at horizon
- IRR
- -12.2%
- Equity multiple
- 0.56×
- Total profit
- $-25,812
- Equity at exit
- $31,312
- IRR
- -3.4%
- Equity multiple
- 0.77×
- Total profit
- $-13,259
- Equity at exit
- $18,157
Cash invested: $58,800 (down + closing). Projections, not guarantees.
Landlord ↔ Tenant lean methodology
- Overall (STATE)
- 87 Strongly Landlord-Friendly
- State Florida
- 87 Strongly Landlord-Friendly · R+3
- County
- — inherits STATE
- City
- — inherits STATE
ZIP-level market 34997
- Rents YoY
- 2.7%
- Active inventory
- 588
- Price-to-rent
- 7.5×
Monthly cashflow live
- Estimated rent
- $2,329 high interval (Pro) →
- Mortgage (P&I)
- −$1,101
- Tax est. 1.5%
- −$262 /mo · $3,150/yr
- Insurance
- −$88
- HOA
- −$252
- Vacancy / Maint / Mgmt
- −$489
- Net cashflow
- $137
Break-even live
UW: 25.0% down · 7.5% · 30yr · 1.5% tax · 5.0% vac · 8.0% maint · 8.0% mgmt
Financing live
Cash to close
- Down payment
- $52,500
- Closing costs
- $6,300
- Reserves months
- —
- Total cash needed
- —
Loan-product check · same deal, 3 products live
Conventional
25% down · 7.5% · 30yr
- Down + closing
- —
- Monthly P&I
- —
- Monthly cashflow
- —
- DSCR
- —
- Eligible?
- —
Personal DTI + credit; lowest rate.
DSCR
20% down · 8.5% · 30yr
- Down + closing
- —
- Monthly P&I
- —
- Monthly cashflow
- —
- DSCR
- —
- Eligible?
- —
No personal income docs; deal must DSCR.
Hard money
10% down · 12.0% · 12mo
- Down + closing
- —
- Monthly P&I
- —
- Monthly cashflow
- —
- DSCR
- —
- Eligible?
- —
Short-term bridge; refi at stabilization.
Rent comps 30 comps
| Address | Beds | Baths | Sqft | Rent | $/sqft | DOM | Units | Dist |
|---|---|---|---|---|---|---|---|---|
| 5881 SE Windsong Ln Stuart, FL | 2.0 | 2.5 | 1288 | $2,100 | $1.63 | 14d | 1 | 0.24mi |
| 4421 SE Village Rd Stuart, FL | 2.0 | 2.0 | 1080 | $2,100 | $1.94 | 23d | 1 | 0.45mi |
| 5688 SE Pine Ave Stuart, FL | 3.0 | 2.0 | 1255 | $2,510 | $2.00 | 14d | 1 | 0.51mi |
| 5601 SE Laguna Ave Stuart, FL | 2.0 | 1.0 | 1080 | $2,200 | $2.04 | 14d | 1 | 0.59mi |
| 4939 SE Salvatori Rd Stuart, FL | 3.0 | 2.0 | 1334 | $2,500 | $1.87 | 23d | 1 | 0.60mi |
| 3882 SE Canvas Back Pl Stuart, FL | 3.0 | 2.0 | 1575 | $2,200 | $1.40 | 23d | 1 | 0.70mi |
| 6535 SE Federal Hwy Stuart, FL | 2.0 | 2.0 | 967 | $1,750 | $1.81 | 23d | 1 | 0.79mi |
| 6551 SE Federal Hwy #104 Stuart, FL | 2.0 | 2.0 | 969 | $2,000 | $2.06 | 14d | 1 | 0.84mi |
| 6551 SE Federal Hwy Stuart, FL | 2.0 | 2.0 | 969 | $1,825 | $1.88 | 21d | 2 | 0.84mi |
| 6537 SE Federal Hwy #102 Stuart, FL | 2.0 | 2.0 | 969 | $1,845 | $1.90 | 14d | 1 | 0.84mi |
| 6553 SE Federal Hwy Unit 10-102 Stuart, FL | 2.0 | 2.0 | 969 | $1,750 | $1.81 | 23d | 1 | 0.84mi |
| 4606 SE Binnacle Way Unit 1 Stuart, FL | 2.0 | 1.0 | 928 | $1,850 | $1.99 | 14d | 1 | 0.87mi |
| 6531 SE Federal Hwy Stuart, FL | 2.0 | 2.0 | 1100 | $1,725 | $1.57 | 14d | 2 | 0.87mi |
| 5968 SE Avalon Dr Stuart, FL | 2.0 | 2.0 | 1176 | $2,800 | $2.38 | 14d | 1 | 0.89mi |
| 7073 SE Birchwood Ln Stuart, FL | 2.0 | 2.0 | 1150 | $1,750 | $1.52 | 14d | 1 | 0.99mi |
| 4885 SE Capstan Ave #27 Stuart, FL | 2.0 | 2.0 | 1273 | $2,500 | $1.96 | 23d | 1 | 1.04mi |
| 3257 SE Brook St Unit 3234 Stuart, FL | 2.0 | 2.0 | 1400 | $2,119 | $1.51 | 23d | 1 | 1.04mi |
| 4650 SE Manatee Way Stuart, FL | 3.0 | 2.5 | 1764 | $5,900 | $3.34 | 23d | 1 | 1.05mi |
| 5795 SE Mitzi Ln Stuart, FL | 3.0 | 2.0 | 1315 | $3,000 | $2.28 | 23d | 1 | 1.06mi |
| 5359 SE Dell St Stuart, FL | 3.0 | 2.0 | 1272 | $2,800 | $2.20 | 23d | 1 | 1.14mi |
| 4107 SE Barcelona St Stuart, FL | 2.0 | 1.0 | 1224 | $2,500 | $2.04 | 23d | 1 | 1.21mi |
| 5152 SE Club Way #104 Stuart, FL | 2.0 | 2.0 | 1358 | $7,500 | $5.52 | 14d | 1 | 1.21mi |
| 4987 SE Mariner Garden Cir Stuart, FL | 3.0 | 2.5 | 1434 | $2,650 | $1.85 | 23d | 1 | 1.27mi |
| 5176 SE Mariner Garden Cir Stuart, FL | 3.0 | 2.5 | 1554 | $2,400 | $1.54 | 23d | 1 | 1.28mi |
| 5156 SE Mariner Garden Cir Stuart, FL | 3.0 | 2.5 | 1434 | $2,400 | $1.67 | 23d | 1 | 1.29mi |
| 5636 SE Foxcross Pl Stuart, FL | 2.0 | 2.0 | 1598 | $9,000 | $5.63 | 14d | 1 | 1.30mi |
| 5064 SE Mariner Garden Cir Stuart, FL | 3.0 | 2.5 | 1530 | $2,400 | $1.57 | 23d | 1 | 1.34mi |
| 4585 SE Federal Hwy Stuart, FL | 1.0–3.0 | 1.0–2.0 | 1015 | $2,326 | $2.29 | 14d | 27 | 1.40mi |
| 4189 SE Saint Lucie Blvd Stuart, FL | 2.0 | 2.5 | 1760 | $5,500 | $3.12 | 23d | 1 | 1.43mi |
| 4710 SE Glenridge Trl Stuart, FL | 3.0 | 2.0 | 1442 | $3,300 | $2.29 | 14d | 1 | 1.49mi |
HOA detail
- Monthly dues
- $252 · $3,024/yr
- Likely covers
- waterpoolsecurity
Listing history 6 events
-
2026-05-31days on market $210,000 Active 254 DOM
-
2026-05-31days on market $210,000 Active 253 DOM
-
2026-05-06price $210,000 373-char remark
Show marketing remark (373 chars)
Tenant IUST Left VACANT EZ TO Show & Sell!!! WALK TO THE POOL FROM THIS GREAT LOCATION IN COURT 2! UNIT NEEDS TO BE UPDATED SOLD AS-IS! NEW A/C AND HWH 2021 AND NEW FENCE 2024. NEW METAL MANSARD IN 2019 AND NEW ROOF 2002 EMERALD LAKES IS A GATED COMMUNITY WITH 2 POOLS,TENNIS PICKLEBALL! WALK TO SHOPS AND EZ ACCESS TO BEACHES AND PORT SALERNO WATERFRONT RESTAURANTS!
-
2025-11-20price $220,000 373-char remark
Show marketing remark (373 chars)
Tenant IUST Left VACANT EZ TO Show & Sell!!! WALK TO THE POOL FROM THIS GREAT LOCATION IN COURT 2! UNIT NEEDS TO BE UPDATED SOLD AS-IS! NEW A/C AND HWH 2021 AND NEW FENCE 2024. NEW METAL MANSARD IN 2019 AND NEW ROOF 2002 EMERALD LAKES IS A GATED COMMUNITY WITH 2 POOLS,TENNIS PICKLEBALL! WALK TO SHOPS AND EZ ACCESS TO BEACHES AND PORT SALERNO WATERFRONT RESTAURANTS!
-
2025-11-02price $235,000 373-char remark
Show marketing remark (373 chars)
Tenant IUST Left VACANT EZ TO Show & Sell!!! WALK TO THE POOL FROM THIS GREAT LOCATION IN COURT 2! UNIT NEEDS TO BE UPDATED SOLD AS-IS! NEW A/C AND HWH 2021 AND NEW FENCE 2024. NEW METAL MANSARD IN 2019 AND NEW ROOF 2002 EMERALD LAKES IS A GATED COMMUNITY WITH 2 POOLS,TENNIS PICKLEBALL! WALK TO SHOPS AND EZ ACCESS TO BEACHES AND PORT SALERNO WATERFRONT RESTAURANTS!
-
2025-09-19$245,000 Active 373-char remark
Show marketing remark (373 chars)
Tenant IUST Left VACANT EZ TO Show & Sell!!! WALK TO THE POOL FROM THIS GREAT LOCATION IN COURT 2! UNIT NEEDS TO BE UPDATED SOLD AS-IS! NEW A/C AND HWH 2021 AND NEW FENCE 2024. NEW METAL MANSARD IN 2019 AND NEW ROOF 2002 EMERALD LAKES IS A GATED COMMUNITY WITH 2 POOLS,TENNIS PICKLEBALL! WALK TO SHOPS AND EZ ACCESS TO BEACHES AND PORT SALERNO WATERFRONT RESTAURANTS!
ⓘ Source: listings_history table (triggers on properties + properties_extension) + one-shot
backfill from property_details.listing_events for pre-trigger history.
Climate risk First Street
- Flood 1/10 Low FEMA zone X (unshaded) · 0% chance over 30 yrs
- Wildfire 3/10 Moderate
- Heat 10/10 Extreme 7 d/yr ≥106°F today · 24 d/yr by 30 yrs out
- Wind 10/10 Extreme 99% chance of damaging wind over 30 yrs
- Air quality 2/10 Low 1 unhealthy d/yr today · 1 by 30 yrs out
Nearby sold comps map
Loading sold comps map…
Walkable amenities ~0.75 mi
Loading nearby amenities…
Taxation est. · year 1
- Rental income
- $27,948
- − Mortgage interest
- −$11,763
- − Property taxes
- −$3,150
- − Insurance
- −$1,050
- − Repairs & maintenance
- −$2,236
- − Management
- −$2,236
- − HOA
- −$3,024
- − Depreciation
- −$6,109
- Taxable loss
- −$1,620
- Est. tax savings @ 24.0%
- +$389
- After-tax cash flow
- $2,029/yr
For passive investors: Depreciation is non-cash, so a rental often shows a tax loss while cash-flowing — sheltering income. Rental losses are passive: they offset passive income freely, and up to $25,000/yr can offset ordinary (W-2) income if you actively participate and your MAGI is under $100k (phasing out to $0 by $150k); unused losses carry forward. On sale, claimed depreciation is recaptured at up to 25%, and gains may owe capital-gains tax (a 1031 exchange can defer both). Figures are a year-1 estimate at your 24.0% rate — not tax advice; consult a CPA.
Condition & rehab AI · 12 photos
This property requires moderate renovations to update the kitchen and bathrooms, and replace worn flooring and cabinets. The location is desirable with access to amenities and a gated community.
Repairs flagged
- Major kitchen cabinets — dated and worn
- Major bathroom fixtures — dated and worn
- Major flooring — carpeted stairs and worn tiles
- Minor interior walls — light discoloration
Value-add opportunities
- Both paint interior walls — enhances curb appeal and interior aesthetics
- Both replace kitchen cabinets — modernizes the space and increases value
- Both replace bathroom fixtures — modernizes the space and increases value
- Both replace flooring — modernizes the space and increases value
Renovation cost estimate screening
| Repair item | Severity | Est. cost |
|---|---|---|
| kitchen cabinets · dated and worn | Major | $15,000–50,000 |
| bathroom fixtures · dated and worn | Major | $15,000–50,000 |
| flooring · carpeted stairs and worn tiles | Major | $15,000–50,000 |
| interior walls · light discoloration | Minor | $500–3,000 |
| Total estimated repair cost · 4 items | $45,500–153,000 |
Value-add ROI direction
- Both paint interior walls — enhances curb appeal and interior aesthetics ↑
- Both replace kitchen cabinets — modernizes the space and increases value ↑
- Both replace bathroom fixtures — modernizes the space and increases value ↑
- Both replace flooring — modernizes the space and increases value ↑
ⓘ Cost ranges are severity-bucket heuristics (US national rule-of-thumb). Get contractor quotes + a written scope before underwriting a rehab budget.
Schools (NCES district)
- District
- Martin
- NCES district ID
- 1201290
- Math proficiency
- 52% ▼ -14.00%
- Reading proficiency
- 53% ▼ -4.00%
- Median HH income
- $52,482
- Composite
- 45.1/100
- National rank
- #2690
- State rank
- #24 of 73 in FL
Livability — Port Salerno
- Score
- 70/100
- State rank
- #440
- US rank
- #7873
Category grades
Schools grade is shown separately in the Schools card above.
Census & demographics
- Census place
- Port Salerno, FL
- County
- Martin County · 165,223 people
- Metro
- Port St. Lucie, FL
- Population (ZIP)
- 47,075
- Household income
- $78,136
- Rent vs Own
- Severe rent burden
- 1323.0
Population outlook (Martin County) Hauer SSP2
- Today (2025)
- 172,383 people
- By 2030
- 180,192 · +4.5%
- By 2040
- 194,114 · +12.6%
- By 2050
- 204,992 · +18.9%
- By 2075
- 229,641 · +33.2%
- By 2100
- 232,146 · +34.7%
Race, ethnicity, and origin ACS 2023
- Neighborhood character
- Predominantly White (74%)
- Race & ethnicity
- White 74% Hispanic / Latino 19% Two or more races 9% Black 3% Asian 1%
- Hispanic origin (detail)
- Mexican 4% Puerto Rican 2% Cuban 3%
- Common ancestry
- Romanian 3% Lithuanian 3% Slovak 2%
- Foreign-born
- 14% · Canada, Jamaica, China
- Languages at home
- 81% English-only · Spanish 14% French/Haitian/Cajun 2% Other Indo-European 1%
Political lean MEDSL · Martin
- 2024 margin
- Solid R (+31.1) · D 34.1% · R 65.2%
- 2008→2024 swing
- -17.5pp toward R · 2008: -13.6pp · 2024: -31.1pp
- All cycles
- 2024: R+31.1 2020: R+24.6 2016: R+26.9 2012: R+22.9 2008: R+13.6
Not yet ingested
- Civics
- —
Market trends
- HPI YoY
- ▼ -319.78%
- Current HPI
- 336.7717
- Rent YoY
- ▲ 2.71%
- Metro
- Port St. Lucie, FL
- State GDP YoY
- ▲ 3.28%
- F500 in state
- 36
Industry mix (Fortune 500 HQ in FL)
| Industry | F500 HQs | Revenue |
|---|---|---|
| Industrial Technology | 2 | $29B |
|
||
| Insurance | 2 | $17B |
|
||
| Retail | 1 | $60B |
|
||
| Technology Distribution | 1 | $58B |
|
||
| Homebuilding | 1 | $35B |
|
||
| Technology Manufacturing | 1 | $35B |
|
||
Price history
-14.3% since first listed4 events — show timeline
- 2026-05-06 Price Changed $210,000 Beaches MLS
- 2025-11-20 Price Changed $220,000 Beaches MLS
- 2025-11-02 Price Changed $235,000 Beaches MLS
- 2025-09-19 Listed $245,000 Beaches MLS
Cash-flow waterfall
monthlySold comps — $/sqft
last 12 mo · ≤1 miLoading sold comps…