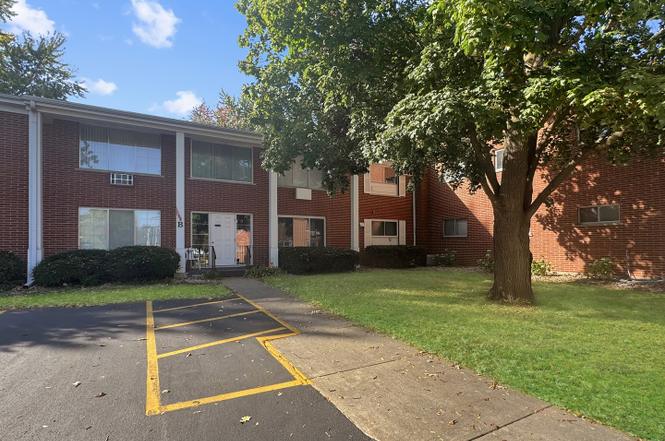
124 N Whistler Ave Unit B8 · Freeport, IL
Flood risk 1/10 · Minimal
- FEMA flood zone
- X (unshaded)
- Chance of flooding over 30 yrs
- 0.0%
- Est. flood insurance / yr
- $507 – $1,088
Fire risk 1/10 · Minimal
- Est. fire insurance / yr
- $804 – $1,492
Heat risk 2/10 · Minimal
- Hot days now (above 101°F)
- 7 days/yr
- Hot days in 30 yrs
- 15 days/yr
Wind risk 2/10 · Minimal
- Chance of severe wind over 30 yrs
- —
Air-quality risk 2/10 · Minimal
- Unhealthy air days now
- 1 days/yr
- Unhealthy air days in 30 yrs
- 2 days/yr
Risk factors via First Street. Map © Google.
Why this score? — see what drove the D grade
The composite is a weighted blend of 9 inputs, each scored 0–100. Each bar is that input's sub-score; the figure is the points it added to the 100-point composite (weight × sub-score).
- Cash flow +14.9/30.0
- 1% rule +8.4/10.0
- DSCR +4.6/10.0
- ARV discount +4.2/15.0
- Condition / age +4.0/5.0
- Livability +3.6/5.0
- Rent growth +2.5/5.0
- Schools +1.0/10.0
- Appreciation +0.0/10.0
$75,900
🖨 Deal sheet (PDF) 📄 Offer letter ✓ Due diligence
Listing remarks
Brand NEW Kitchen with lovely brass/gold hardware, high end quartz countertops, beautiful large stainless steel sink with accessories, new arched black kitchen faucet with sprayer, undercounter trash and recyclable rollout bins, brand new slim line microwave, and stove. Updated bathroom Including painted Bead board, new white oak vanity with quartz top and mirror, new hardware, professionally refurbished cast iron tub and shower tile, and mod tile flooring. Large bathroom closet area for linens, towels and laundry baskets. Further, new updated light fixtures throughout unit, brand new high end carpeting and luxury vinyl wood look flooring. Entire condo freshly painted. Living room has a spe
Key facts
- Updated bath
- Generous storage
- Updated kitchen
Tags
Property features AI
Finance
- Other: Manager on-site; Directions: US RT 20 W to IL RT 26 S to Galena Ave to Whistler Ave
- HOA & community: Monthly association fee of $255; Association fee includes heat, water, lawn care, snow removal and other services; On-site manager; No pets allowed
Exterior
- Parking: Assigned parking (asphalt); One parking space; Other designated parking
- Utilities: Public water; Public sewer
- Home design: Attached single condo; Entry on second level
- Construction: Brick construction; Asphalt roof; Built 51–60 years ago; Built before 1978
- Exterior features: Condo lot/setting
Interior
- Kitchen: Kitchen (second level, 7 x 7)
- Bedrooms: Master bedroom (second level, 13 x 12); Bedroom (second level, 12 x 10); Additional bedrooms
- Bathrooms: One full bathroom
- Heating & cooling: Steam heat; Wall unit air conditioning
- Interior features: Five total rooms; Family room; Living room
- Laundry & utility: Laundry in common area
Neighborhood map
What this means for you Summary
Snapshot
- This is a 2-bed/1.0-bath condo listed at $76k. Condition is rated good.
Deal economics
- At list price, monthly cash flow is $23 ($272/yr) — positive.
- The deal already cash-flows at list — no discount required.
- Meets the 1% rule at list price ($1k rent vs $76k).
Location & tenants
- Location reads 72/100 on livability (#302 in IL) — a middle-class / working-renter tenant base. Strengths: cost of living A+, health & safety A+, housing A-; Watch: commute F, employment F.
- Freeport SD 145 (town): math 11% / reading 12% proficiency, ranked #565 of 620 in IL (top 91%) — low school quality limits family demand, transient renter base, plan for 1-2y turnover; 65% free/reduced lunch — lower-income household profile, screen leases tightly.
- Zoned schools: Empire Elem School (math 12% / reading 12%, grade F, #1,403 of 2,056 statewide, top 71%, 325 students, 0% FRL); Carl Sandburg Middle Sch (math 10% / reading 10%, grade F, #583 of 665 statewide, top 89%, 397 students, 0% FRL); Freeport High School (math 11% / reading 18%, grade F, #479 of 693 statewide, top 71%, 1,080 students, 0% FRL) — zoned schools average 0% FRL vs 65% district-wide (65 pts lower); this property's tenant base skews higher-income than the district average.
- Market conditions: 206 active listings in the ZIP; 8 comparable units currently listed for rent nearby; rentals lingering (median 46d on market — plan ~5-8 weeks vacancy on turnover, expect pricing pressure); 88% of comp listings sitting > 30 days — soft ceiling on asking rent; 7 units permitted in Stephenson County in 2024 (0 in 5+ unit buildings).
Forward outlook
- Local home prices are declining (-3.0%/yr); year-one equity from $525 of loan paydown is wiped out by about $2k of value loss. Plan a longer hold.
- Stephenson County population projected at -29% by 2050 — secular population decline; favor cash flow + early exit over multi-decade hold.
Negotiation context
- Only 3 days on market — expect competitive offers; lowballing is unlikely to land.
- 6 sale attempts since 2y ago with the ask held roughly flat each time — persistent listings suggest the price (not the market) is what's stuck; bring a comps-based counter.
Risks & watch-outs
- Watch-outs: HOA is 25% of rent.
Questions for the listing agent
- Built in 1974 — when were the roof, HVAC, electrical panel, plumbing, and water heater last replaced?
- What does the HOA fee cover, when was the last increase, and are there any pending special assessments or reserve-fund shortfalls?
- Any open or pending special assessments — roof, HVAC, plumbing, elevator, façade? What's the per-unit balance and payoff schedule, and is the seller paying it off at close or rolling it to the buyer?
- Is there a deadline driving the sale (1031 exchange, divorce, estate, relocation)? That informs how much negotiation room exists.
- Schools are F-rated, which usually means shorter tenancies and higher turnover. Who's the typical renter profile here, and what's been the actual vacancy rate?
- The area grade is low — what's the realistic commute time and amenity access for the typical tenant pool here? Any planned neighborhood developments (good or bad) we should know about?
- What's the average days-on-market for RENTAL listings here right now (not sales)? A rising rental-DOM trend means longer vacancies and softer asking-rent achievability than the comps imply.
- What's the recent tenant-quality profile in this submarket — average credit score on applications, eviction rate, late-payment / NSF rate, and stable-employment percentage? A property-management company in the area should have these aggregated.
- How much new apartment / multifamily construction is in the pipeline within 1–3 miles? Heavy new supply (>2% of stock underway) typically softens rents 12–24 months out; light construction supports rent growth.
Investment metrics
- 1% rule
- 1.34% ✓
- Cap rate
- 6.65%
- Cash-on-cash
- 1.28%
- DSCR
- 1.06
- GRM
- 6.2
CMA / ARV
- ARV (median comp)
- $70,663
- List price
- $75,900
- Delta
- 10.38%
- Verdict
- OVERPRICED
- Comps
- 9 within 1.0 mi
Projected returns pro-forma
-3.0% appreciation · 3.0% rent growth · sell at horizon
- IRR
- -14.0%
- Equity multiple
- 0.50×
- Total profit
- $-10,681
- Equity at exit
- $11,317
- IRR
- -4.8%
- Equity multiple
- 0.68×
- Total profit
- $-6,740
- Equity at exit
- $6,562
Cash invested: $21,252 (down + closing). Projections, not guarantees.
Landlord ↔ Tenant lean methodology
- Overall (STATE)
- 43 Moderately Tenant-Leaning
- State Illinois
- 43 Moderately Tenant-Leaning · D+7
- County
- — inherits STATE
- City
- — inherits STATE
ZIP-level market 61032
- Home prices YoY
- -19.5%
- Active inventory
- 206
- Price-to-rent
- 6.2×
Monthly cashflow live
- Estimated rent
- $1,015 high interval (Pro) →
- Mortgage (P&I)
- −$398
- Tax est. 1.5%
- −$95 /mo · $1,138/yr
- Insurance
- −$32
- HOA
- −$255
- Vacancy / Maint / Mgmt
- −$213
- Net cashflow
- $23
Break-even live
Sensitivity live
| Price | -10% $75 | -5% $49 | +0% $23 | +5% $-4 | +10% $-30 |
|---|---|---|---|---|---|
| Rent | -10% $-58 | -5% $-17 | +0% $23 | +5% $63 | +10% $103 |
| Rate | -1.0pp $61 | -0.5pp $42 | base $23 | +0.5pp $3 | +1.0pp $-17 |
UW: 25.0% down · 7.5% · 30yr · 1.5% tax · 5.0% vac · 8.0% maint · 8.0% mgmt
Financing live
Cash to close
- Down payment
- $18,975
- Closing costs
- $2,277
- Reserves months
- —
- Total cash needed
- —
Loan-product check · same deal, 3 products live
Conventional
25% down · 7.5% · 30yr
- Down + closing
- —
- Monthly P&I
- —
- Monthly cashflow
- —
- DSCR
- —
- Eligible?
- —
Personal DTI + credit; lowest rate.
DSCR
20% down · 8.5% · 30yr
- Down + closing
- —
- Monthly P&I
- —
- Monthly cashflow
- —
- DSCR
- —
- Eligible?
- —
No personal income docs; deal must DSCR.
Hard money
10% down · 12.0% · 12mo
- Down + closing
- —
- Monthly P&I
- —
- Monthly cashflow
- —
- DSCR
- —
- Eligible?
- —
Short-term bridge; refi at stabilization.
Rent comps 8 comps
| Address | Beds | Baths | Sqft | Rent | $/sqft | DOM | Units | Dist |
|---|---|---|---|---|---|---|---|---|
| 1436 W American St Freeport, IL | 2.0 | 1.0 | 714 | $1,100 | $1.54 | 45d | 1 | 0.77mi |
| 601 N Winnebago Ave Freeport, IL | 3.0 | 1.0 | 784 | $1,225 | $1.56 | 45d | 1 | 0.84mi |
| 11 1/2 N Van Buren Ave Apt 301 Freeport, IL | 1.0 | 1.0 | 600 | $650 | $1.08 | 45d | 1 | 0.86mi |
| 2284 W Galena Ave Unit WRE 027H Freeport, IL | 2.0 | 1.0 | 684 | $800 | $1.17 | 45d | 1 | 1.06mi |
| 1645 Hilltop Pl Freeport, IL | 3.0 | 1.0 | 1008 | $1,000 | $0.99 | 45d | 1 | 1.26mi |
| 1645 Hilltop Pl Unit 2 Freeport, IL | 3.0 | 1.5 | 1008 | $1,000 | $0.99 | 45d | 1 | 1.26mi |
| 316 E Winslow St Freeport, IL | 2.0 | 1.0 | 812 | $1,295 | $1.59 | 23d | 1 | 1.28mi |
| 1763 S Hance Dr Unit 6 Freeport, IL | 2.0 | 1.0 | 800 | $950 | $1.19 | 45d | 1 | 1.44mi |
HOA detail condo
- Monthly dues
- $255 · $3,060/yr
- Likely covers
- trash
- Assessments
- None detected in remarks — confirm with the listing agent.
Listing history 26 events
-
2026-06-22days on market $75,900 Active 3 DOM
-
2026-06-21days on market $75,900 Active 2 DOM
-
2026-06-21pricedays on market $75,900 Active 1 DOM
-
2026-06-15days on market $78,000 Active 207 DOM
-
2026-06-13days on market $78,000 Active 205 DOM
-
2026-06-12days on market $78,000 Active 204 DOM
-
2026-06-09days on market $78,000 Active 201 DOM
-
2026-06-08days on market $78,000 Active 200 DOM
-
2026-06-07days on market $78,000 Active 199 DOM
-
2026-06-07days on market $78,000 Active 198 DOM
-
2026-06-04days on market $78,000 Active 195 DOM
-
2026-06-02days on market $78,000 Active 194 DOM
-
2026-06-01days on market $78,000 Active 193 DOM
-
2026-05-31days on market $78,000 Active 192 DOM
-
2026-05-31days on market $78,000 Active 191 DOM
-
2026-05-12status Active 1123-char remark
-
2026-05-10historical 1123-char remark
-
2026-03-14status Active 1123-char remark
-
2026-03-10historical 1123-char remark
-
2026-01-15price $78,000 1123-char remark
-
2025-11-13$82,900 Active 1123-char remark
-
2025-08-14historical
-
2025-04-21price
-
2025-04-11Active
-
2025-04-11historical
-
2024-10-14Active
ⓘ Source: listings_history table (triggers on properties + properties_extension) + one-shot
backfill from property_details.listing_events for pre-trigger history.
Climate risk First Street
- Flood 1/10 Low FEMA zone X (unshaded) · 0% chance over 30 yrs
- Wildfire 1/10 Low
- Heat 2/10 Low 7 d/yr ≥101°F today · 15 d/yr by 30 yrs out
- Wind 2/10 Low
- Air quality 2/10 Low 1 unhealthy d/yr today · 2 by 30 yrs out
Nearby sold comps map
Loading sold comps map…
Walkable amenities ~0.75 mi
Loading nearby amenities…
Taxation est. · year 1
- Rental income
- $12,186
- − Mortgage interest
- −$4,252
- − Property taxes
- −$1,138
- − Insurance
- −$380
- − Repairs & maintenance
- −$975
- − Management
- −$975
- − HOA
- −$3,060
- − Depreciation
- −$2,208
- Taxable loss
- −$802
- Est. tax savings @ 24.0%
- +$192
- After-tax cash flow
- $465/yr
For passive investors: Depreciation is non-cash, so a rental often shows a tax loss while cash-flowing — sheltering income. Rental losses are passive: they offset passive income freely, and up to $25,000/yr can offset ordinary (W-2) income if you actively participate and your MAGI is under $100k (phasing out to $0 by $150k); unused losses carry forward. On sale, claimed depreciation is recaptured at up to 25%, and gains may owe capital-gains tax (a 1031 exchange can defer both). Figures are a year-1 estimate at your 24.0% rate — not tax advice; consult a CPA.
Condition & rehab AI · 12 photos
This condo is in excellent condition with recent updates, including a new kitchen and bathroom. It is move-in ready and has a good curb appeal.
Value-add opportunities
- Both Painting exterior brick — Enhances curb appeal and value.
- Both Landscaping improvements — Enhances curb appeal and value.
- Both New window treatments — Enhances curb appeal and value.
- Both New flooring in kitchen and bathrooms — Enhances functionality and value.
- Both New lighting fixtures — Enhances functionality and value.
Renovation cost estimate screening
Value-add ROI direction
- Both Painting exterior brick — Enhances curb appeal and value. ↑
- Both Landscaping improvements — Enhances curb appeal and value. ↑
- Both New window treatments — Enhances curb appeal and value. ↑
- Both New flooring in kitchen and bathrooms — Enhances functionality and value. ↑
- Both New lighting fixtures — Enhances functionality and value. ↑
ⓘ Cost ranges are severity-bucket heuristics (US national rule-of-thumb). Get contractor quotes + a written scope before underwriting a rehab budget.
Schools (NCES district)
- District
- Freeport SD 145
- NCES district ID
- 1715900
- Math proficiency
- 11% ▼ -3.00%
- Reading proficiency
- 12% ▼ -5.00%
- Median HH income
- $39,803
- Composite
- 9.89/100
- National rank
- #9821
- State rank
- #565 of 620 in IL
Livability — Freeport
- Score
- 72/100
- State rank
- #302
- US rank
- #5927
Category grades
Schools grade is shown separately in the Schools card above.
Census & demographics
- Census place
- Freeport, IL
- Population (ZIP)
- 29,072
Population outlook (Stephenson County) Hauer SSP2
- Today (2025)
- 41,802 people
- By 2030
- 39,487 · -5.5%
- By 2040
- 34,534 · -17.4%
- By 2050
- 29,693 · -29.0%
- By 2075
- 21,196 · -49.3%
- By 2100
- 14,596 · -65.1%
Race, ethnicity, and origin ACS 2023
- Neighborhood character
- Predominantly White (73%)
- Race & ethnicity
- White 73% Black 12% Two or more races 10% Hispanic / Latino 6% Asian 1%
- Hispanic origin (detail)
- Mexican 4% Puerto Rican 1%
- Common ancestry
- Iranian 3% Romanian 2% Lithuanian 2%
- Foreign-born
- 3% · Canada
- Languages at home
- 96% English-only · Spanish 3% Other Indo-European 1%
Political lean MEDSL · Stephenson
- 2024 margin
- R (+19.4) · D 39.5% · R 58.9% · Other 1.6%
- 2008→2024 swing
- -26.1pp toward R · 2008: 6.7pp · 2024: -19.4pp
- All cycles
- 2024: R+19.4 2020: R+15.7 2016: R+17.0 2012: R+4.6 2008: D+6.7
Not yet ingested
- Civics
- —
Market trends
- HPI YoY
- ▼ -39.75%
- Current HPI
- 163.677
- Rent YoY
- —
- Metro
- —
- State GDP YoY
- ▲ 1.59%
- F500 in state
- 60
Industry mix (Fortune 500 HQ in IL)
| Industry | F500 HQs | Revenue |
|---|---|---|
| Insurance | 4 | $201B |
|
||
| Consumer Goods | 4 | $87B |
|
||
| Industrial Machinery | 3 | $64B |
|
||
| Healthcare | 2 | $55B |
|
||
| Retail / Pharmacy | 1 | $148B |
|
||
| Agriculture / Food | 1 | $86B |
|
||
Price history
13 events — show timeline
- 2026-06-19 Listed $75,900 MRED as Distributed by MLS Grid
- 2026-06-15 Listing Removed — MRED as Distributed by MLS Grid
- 2026-05-12 Relisted — MRED as Distributed by MLS Grid
- 2026-05-10 Listing Removed — MRED as Distributed by MLS Grid
- 2026-03-14 Relisted — MRED as Distributed by MLS Grid
- 2026-03-10 Listing Removed — MRED as Distributed by MLS Grid
- 2026-01-15 Price Changed — MRED as Distributed by MLS Grid
- 2025-11-13 Listed — MRED as Distributed by MLS Grid
- 2025-08-14 Listing Removed — MRED as Distributed by MLS Grid
- 2025-04-21 Price Changed — MRED as Distributed by MLS Grid
- 2025-04-11 Listing Removed — MRED as Distributed by MLS Grid
- 2025-04-11 Listed — MRED as Distributed by MLS Grid
- 2024-10-14 Listed — MRED as Distributed by MLS Grid
Cash-flow waterfall
monthlySold comps — $/sqft
last 12 mo · ≤1 miLoading sold comps…