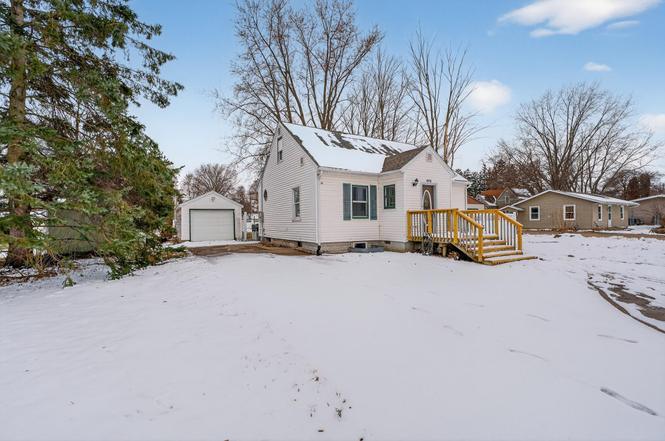
440 W 1st St · Rush City, MN
Flood risk 1/10 · Minimal
- FEMA flood zone
- X (unshaded)
- Chance of flooding over 30 yrs
- 0.0%
- Est. flood insurance / yr
- $507 – $1,088
Fire risk 1/10 · Minimal
- Est. fire insurance / yr
- $888 – $1,650
Heat risk 2/10 · Minimal
- Hot days now (above 98°F)
- 7 days/yr
- Hot days in 30 yrs
- 13 days/yr
Wind risk 1/10 · Minimal
- Chance of severe wind over 30 yrs
- —
Air-quality risk 2/10 · Minimal
- Unhealthy air days now
- 1 days/yr
- Unhealthy air days in 30 yrs
- 1 days/yr
Risk factors via First Street. Map © Google.
Why this score? — see what drove the C- grade
The composite is a weighted blend of 9 inputs, each scored 0–100. Each bar is that input's sub-score; the figure is the points it added to the 100-point composite (weight × sub-score).
- Cash flow +19.3/30.0
- ARV discount +7.5/15.0
- DSCR +6.1/10.0
- 1% rule +4.5/10.0
- Schools +3.7/10.0
- Livability +3.5/5.0
- Rent growth +2.5/5.0
- Condition / age +2.5/5.0
- Appreciation +1.3/10.0
$289,000
🖨 Deal sheet (PDF) 📄 Offer letter ✓ Due diligence
Listing remarks MLS
A smart purchase for the first time homebuyer. All maintenance free siding. Newer roof, natural gas and updated electric on a large, deep city lot, make this a great starter home. A lot of home for the money!
Key facts
- 0.3 acre lot
- Garage
- Built 1950
Neighborhood map
What this means for you Summary
Snapshot
- This is a 3-bed/2.0-bath single-family listed at $289k.
Deal economics
- At list price, monthly cash flow is $316 ($4k/yr) — positive.
- The deal already cash-flows at list — no discount required.
- To meet the 1% rule (rent ≥ 1% of price), the offer needs to be $274k (5.3% below list).
- Recommended offer: $274k (5.3% below list) — sets the bar for 1% rule.
Location & tenants
- Location reads 69/100 on livability (#355 in MN) — a middle-class / working-renter tenant base. Strengths: cost of living A+, housing A+, crime A; Watch: employment C-, amenities F, commute F.
- Rush City Public School District (rural): math 37% / reading 47% proficiency, ranked #195 of 301 in MN (top 65%) — families likely to look elsewhere, expect single-tenant / working-renter base with shorter leases.
- Market conditions: 50 active listings in the ZIP; 362 units permitted in Chisago County in 2024 (121 in 5+ unit buildings).
Forward outlook
- Local home prices are declining (-3.0%/yr); year-one equity from $2k of loan paydown is wiped out by about $9k of value loss. Plan a longer hold.
- Chisago County population projected at -11% by 2050 — secular population decline; favor cash flow + early exit over multi-decade hold.
Negotiation context
- It's been on market 17 days — a 2% lower offer ($285k) is reasonable based on typical stale-listing flexibility.
- 3 sale attempts since 22y ago with the ask held roughly flat each time — persistent listings suggest the price (not the market) is what's stuck; bring a comps-based counter.
- Current owner paid $120k; list at $289k implies a 141% gain — meaningful room to come down on a strong offer.
Risks & watch-outs
- Watch-outs: built in 1950 — expect roof / HVAC / electrical / plumbing capex.
Questions for the listing agent
- Built in 1950 — when were the roof, HVAC, electrical panel, plumbing, and water heater last replaced?
- Is there a deadline driving the sale (1031 exchange, divorce, estate, relocation)? That informs how much negotiation room exists.
- What's the average days-on-market for RENTAL listings here right now (not sales)? A rising rental-DOM trend means longer vacancies and softer asking-rent achievability than the comps imply.
- What's the recent tenant-quality profile in this submarket — average credit score on applications, eviction rate, late-payment / NSF rate, and stable-employment percentage? A property-management company in the area should have these aggregated.
- How much new for-sale + rental construction is in the pipeline within 1–3 miles? Heavy new supply typically softens prices + rents 12–24 months out; constrained supply supports both.
Investment metrics
- 1% rule
- 0.95% ✗
- Cap rate
- 7.60%
- Cash-on-cash
- 4.68%
- DSCR
- 1.21
- GRM
- 8.8
CMA / ARV
No comps found within radius.
Projected returns pro-forma
-3.0% appreciation · 3.0% rent growth · sell at horizon
- IRR
- -9.0%
- Equity multiple
- 0.67×
- Total profit
- $-26,769
- Equity at exit
- $43,091
- IRR
- 0.4%
- Equity multiple
- 1.03×
- Total profit
- $2,377
- Equity at exit
- $24,987
Cash invested: $80,920 (down + closing). Projections, not guarantees.
Landlord ↔ Tenant lean methodology
- Overall (STATE)
- 46 Balanced
- State Minnesota
- 46 Balanced · D+2
- County
- — inherits STATE
- City
- — inherits STATE
ZIP-level market 55069
- Home prices YoY
- -1.7%
- Active inventory
- 50
- Price-to-rent
- 8.8×
Monthly cashflow live
- Estimated rent
- $2,736 medium interval (Pro) →
- Mortgage (P&I)
- −$1,516
- Tax from tax record
- −$210 /mo · $2,514/yr
- Insurance
- −$120
- HOA
- −$0
- Vacancy / Maint / Mgmt
- −$575
- Net cashflow
- $316
Break-even live
Sensitivity live
| Price | -10% $479 | -5% $398 | +0% $316 | +5% $234 | +10% $152 |
|---|---|---|---|---|---|
| Rent | -10% $100 | -5% $208 | +0% $316 | +5% $424 | +10% $532 |
| Rate | -1.0pp $461 | -0.5pp $389 | base $316 | +0.5pp $241 | +1.0pp $165 |
UW: 25.0% down · 7.5% · 30yr · 1.5% tax · 5.0% vac · 8.0% maint · 8.0% mgmt
Financing live
Cash to close
- Down payment
- $72,250
- Closing costs
- $8,670
- Reserves months
- —
- Total cash needed
- —
Loan-product check · same deal, 3 products live
Conventional
25% down · 7.5% · 30yr
- Down + closing
- —
- Monthly P&I
- —
- Monthly cashflow
- —
- DSCR
- —
- Eligible?
- —
Personal DTI + credit; lowest rate.
DSCR
20% down · 8.5% · 30yr
- Down + closing
- —
- Monthly P&I
- —
- Monthly cashflow
- —
- DSCR
- —
- Eligible?
- —
No personal income docs; deal must DSCR.
Hard money
10% down · 12.0% · 12mo
- Down + closing
- —
- Monthly P&I
- —
- Monthly cashflow
- —
- DSCR
- —
- Eligible?
- —
Short-term bridge; refi at stabilization.
Listing history 10 events
-
2026-04-03status Pending
-
2026-03-23historical Contingent - Inspection
-
2026-03-17$289,000 Active
-
2026-03-13historical $289,000
-
2008-02-06historical
-
2007-07-06$169,900
-
2004-09-16soldstatus $120,000
-
2004-08-19soldstatus $120,000 210-char remark
Show marketing remark (210 chars)
A smart purchase for the first time homebuyer. All maintenance free siding. Newer roof, natural gas and updated electric on a large, deep city lot, make this a great starter home. A lot of home for the money!
-
2004-08-05historical 210-char remark
Show marketing remark (210 chars)
A smart purchase for the first time homebuyer. All maintenance free siding. Newer roof, natural gas and updated electric on a large, deep city lot, make this a great starter home. A lot of home for the money!
-
2004-07-22$125,000 210-char remark
Show marketing remark (210 chars)
A smart purchase for the first time homebuyer. All maintenance free siding. Newer roof, natural gas and updated electric on a large, deep city lot, make this a great starter home. A lot of home for the money!
ⓘ Source: listings_history table (triggers on properties + properties_extension) + one-shot
backfill from property_details.listing_events for pre-trigger history.
Tax reassessment forecast MN · Partial reset (capped growth)
- Current annual tax
- $2,514 · $210/mo
- Projected year-2 tax
- $2,875 · $240/mo
- Expected delta
- +$361/yr (+$30/mo · 14.4%)
ⓘ Screening estimate from a state-policy table — verify with the county assessor before closing.
Climate risk First Street
- Flood 1/10 Low FEMA zone X (unshaded) · 0% chance over 30 yrs
- Wildfire 1/10 Low
- Heat 2/10 Low 7 d/yr ≥98°F today · 13 d/yr by 30 yrs out
- Wind 1/10 Low
- Air quality 2/10 Low 1 unhealthy d/yr today · 1 by 30 yrs out
Nearby sold comps map
Loading sold comps map…
Walkable amenities ~0.75 mi
Loading nearby amenities…
Taxation est. · year 1
- Rental income
- $32,829
- − Mortgage interest
- −$16,188
- − Property taxes
- −$2,514
- − Insurance
- −$1,445
- − Repairs & maintenance
- −$2,626
- − Management
- −$2,626
- − Depreciation
- −$8,407
- Taxable loss
- −$978
- Est. tax savings @ 24.0%
- +$235
- After-tax cash flow
- $4,024/yr
For passive investors: Depreciation is non-cash, so a rental often shows a tax loss while cash-flowing — sheltering income. Rental losses are passive: they offset passive income freely, and up to $25,000/yr can offset ordinary (W-2) income if you actively participate and your MAGI is under $100k (phasing out to $0 by $150k); unused losses carry forward. On sale, claimed depreciation is recaptured at up to 25%, and gains may owe capital-gains tax (a 1031 exchange can defer both). Figures are a year-1 estimate at your 24.0% rate — not tax advice; consult a CPA.
Schools (NCES district)
- District
- Rush City Public School District
- NCES district ID
- 2732550
- Math proficiency
- 37% ▼ -26.00%
- Reading proficiency
- 47% ▼ -20.00%
- Median HH income
- $60,045
- Composite
- 37.08/100
- National rank
- #4499
- State rank
- #195 of 301 in MN
Livability — Rush City
- Score
- 69/100
- State rank
- #355
- US rank
- #8328
Category grades
Schools grade is shown separately in the Schools card above.
Census & demographics
- Census place
- Rush City, MN
- Population (ZIP)
- 5,936
Population outlook (Chisago County) Hauer SSP2
- Today (2025)
- 55,187 people
- By 2030
- 55,036 · -0.3%
- By 2040
- 53,293 · -3.4%
- By 2050
- 49,157 · -10.9%
- By 2075
- 38,399 · -30.4%
- By 2100
- 24,646 · -55.3%
Race, ethnicity, and origin ACS 2023
- Neighborhood character
- Predominantly White (86%)
- Race & ethnicity
- White 86% Black 8% Two or more races 3% Asian 2% Native American 1%
- Common ancestry
- Portuguese 10% Romanian 3% Lithuanian 2%
- Foreign-born
- 2% · Canada
- Languages at home
- 98% English-only · Spanish 1% Other Asian/Pacific 1% Tagalog/Filipino 1%
Political lean MEDSL · Chisago
- 2024 margin
- Solid R (+31.4) · D 33.5% · R 64.9% · Other 1.6%
- 2008→2024 swing
- -21.2pp toward R · 2008: -10.3pp · 2024: -31.4pp
- All cycles
- 2024: R+31.4 2020: R+29.2 2016: R+30.5 2012: R+12.6 2008: R+10.3
Not yet ingested
- Civics
- —
Market trends
- HPI YoY
- ▼ -7.49%
- Current HPI
- 428.9296
- Rent YoY
- —
- Metro
- —
- State GDP YoY
- ▲ 2.41%
- F500 in state
- 34
Industry mix (Fortune 500 HQ in MN)
| Industry | F500 HQs | Revenue |
|---|---|---|
| Healthcare | 2 | $407B |
|
||
| Retail | 2 | $150B |
|
||
| Consumer Goods | 2 | $32B |
|
||
| Industrial Machinery | 2 | $6B |
|
||
| Agriculture | 1 | $40B |
|
||
| Healthcare / Medical Devices | 1 | $32B |
|
||
Price history
+131.2% since first listed10 events — show timeline
- 2026-04-03 Pending — NORTHSTARMLS as Distributed by MLS Grid
- 2026-03-23 Contingent — NORTHSTARMLS as Distributed by MLS Grid
- 2026-03-17 Listed $289,000 NORTHSTARMLS as Distributed by MLS Grid
- 2026-03-13 Coming Soon $289,000 NORTHSTARMLS as Distributed by MLS Grid
- 2008-02-06 Listing Removed — NORTHSTARMLS as Distributed by MLS Grid
- 2007-07-06 Listed $169,900 NORTHSTARMLS as Distributed by MLS Grid
- 2004-09-16 Sold (Public Records) $120,000 Public Records
- 2004-08-19 Sold (MLS) $120,000 NORTHSTARMLS as Distributed by MLS Grid
- 2004-08-05 Listing Removed — NORTHSTARMLS as Distributed by MLS Grid
- 2004-07-22 Listed $125,000 NORTHSTARMLS as Distributed by MLS Grid
Property tax history
+4.6%/yrLatest (2025): $2,514 · +4.7% YoY. Source: county tax records.
Cash-flow waterfall
monthlySold comps — $/sqft
last 12 mo · ≤1 miLoading sold comps…