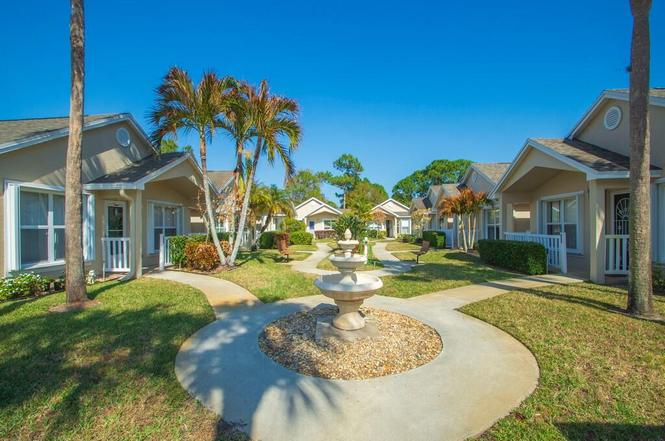
612 NW San Remo Cir · Port St. Lucie, FL
Flood risk 1/10 · Minimal
- FEMA flood zone
- X (unshaded)
- Chance of flooding over 30 yrs
- 0.0%
- Est. flood insurance / yr
- $507 – $1,088
Fire risk 1/10 · Minimal
- Est. fire insurance / yr
- $947 – $1,759
Heat risk 10/10 · Severe
- Hot days now (above 106°F)
- 7 days/yr
- Hot days in 30 yrs
- 24 days/yr
Wind risk 10/10 · Severe
- Chance of severe wind over 30 yrs
- 99.0%
Air-quality risk 1/10 · Minimal
- Unhealthy air days now
- 0 days/yr
- Unhealthy air days in 30 yrs
- 0 days/yr
Risk factors via First Street. Map © Google.
Why this score? — see what drove the D grade
The composite is a weighted blend of 9 inputs, each scored 0–100. Each bar is that input's sub-score; the figure is the points it added to the 100-point composite (weight × sub-score).
- Cash flow +12.6/30.0
- ARV discount +10.3/15.0
- 1% rule +5.4/10.0
- DSCR +3.8/10.0
- Schools +3.7/10.0
- Rent growth +2.9/5.0
- Livability +2.5/5.0
- Condition / age +2.5/5.0
- Appreciation +0.0/10.0
$202,500
🖨 Deal sheet 📄 Offer letter ✓ Due diligence
Listing remarks MLS
Charming 2-Bd. , 2-Bth. , villa in park-like setting. Enclosed, private lanai, laundry room. Fabulous clubhouse, pool, spa, tennis, fitness ctr. , organized activities, 24 hour man-gated.
Key facts
- Quartz countertops
- Beautiful backsplash
- Title flooring
Tags
Property features AI
Finance
- Other: Senior community; Pets allowed (restrictions on number and size)
- HOA & community: Association with monthly HOA fee; Association amenities include: clubhouse, fitness center, game room, billiard room, library, management/manager on site, jogging path, sidewalks, street lights, tennis courts, pickleball courts, shuffleboard court, bocce ball, recreation facilities, internet included
Exterior
- Parking: Detached carport (1 covered space)
- Security: Gated community with guard
- Utilities: Public water; Public sewer; Electric service: Three phase; Cable available
- Home design: Villa; Single-story; Resale; Faces south
- Construction: Built by Lennar (model: BOUGENVILLA); CBS construction; Composition/shingle roof; One-story structure
- Exterior features: Covered patio; Screened patio; Patio
Interior
- Kitchen: Dishwasher; Electric range; Refrigerator; Water purifier (owned)
- Bedrooms: 2 bedrooms on the main level
- Flooring: Ceramic tile
- Bathrooms: 2 full bathrooms on the main level
- Heating & cooling: Central electric heating; Central air conditioning (electric)
- Interior features: Cathedral and vaulted ceilings; Walk-in closet(s)
- Laundry & utility: Laundry inside
Neighborhood map
What this means for you Summary
Snapshot
- This is a 2-bed/2.0-bath single-family listed at $202k.
Deal economics
- At list price, monthly cash flow is $-26 ($-311/yr) — negative.
- To cash-flow at today's rent, offer at most $198k (2.3% below list).
- Meets the 1% rule at list price ($2k rent vs $202k).
- Recommended offer: $178k (12.0% below list) — sets the bar for market timing.
- Cap rate 6.1% vs local median 3.9% in Port St. Lucie — top-decile yield for the area; either an underpriced asset or a hidden risk that comps aren't pricing in. Stress-test before assuming the spread holds.
Location & tenants
- Location reads: area grade D — affects rentability + tenant quality, not the cash-flow math above.
- St. Lucie (urban): math 40% / reading 48% proficiency, ranked #51 of 73 in FL (top 70%) — families likely to look elsewhere, expect single-tenant / working-renter base with shorter leases.
- Zoned schools: Windmill Point Elementary School (math 49% / reading 51%, grade D+, #1,070 of 2,144 statewide, top 51%, 1,006 students, 68% FRL); Fort Pierce Central High School (math 15% / reading 45%, grade F, #441 of 667 statewide, top 67%, 3,091 students, 62% FRL).
- Market conditions: Rents rising (+1.6%/yr); 491 active listings in the ZIP; 11 comparable units currently listed for rent nearby; rentals at typical pace (median 24d on market — plan ~3-4 weeks tenant-placement turnaround); solid renter incomes; 4,868 units permitted in St. Lucie County in 2024 (268 in 5+ unit buildings).
- This rent runs 32% of the median local income ($80k/yr) — at the standard rent-burdened threshold; future hikes will face affordability resistance.
Forward outlook
- Local home prices are declining (-3.0%/yr); year-one equity from $1k of loan paydown is wiped out by about $6k of value loss. Plan a longer hold.
- St. Lucie County population projected at +20% by 2050 — long-run rental-demand tailwind backs the buy-and-hold thesis.
Negotiation context
- It's been on market 122 days — a 12% lower offer ($178k) is reasonable based on typical stale-listing flexibility.
- 4 sale attempts since 16y ago with the ask held roughly flat each time — persistent listings suggest the price (not the market) is what's stuck; bring a comps-based counter.
- Current owner paid $62k; list at $202k implies a 224% gain — meaningful room to come down on a strong offer.
Risks & watch-outs
- Watch-outs: HOA is 23% of rent.
- Climate carrying-cost: severe wind risk, 99% chance of damaging wind over 30y; extreme-heat days projected 7→24/yr by 2055 (HVAC capex compounding) — expect insurance premiums to compound above CPI over the hold.
Questions for the listing agent
- What do current leases actually rent for vs. the listed asking? Can we see a recent rent roll and the last 12 months of T-12 income?
- It's been on market 122 days. Have you received any prior offers? Is the seller open to a 12% concession, seller financing, or rate buy-down credit?
- What does the HOA fee cover, when was the last increase, and are there any pending special assessments or reserve-fund shortfalls?
- Why hasn't it sold? Are there any deal-killer items the seller is aware of (foundation, flood, title, zoning, code violations)?
- Is there a deadline driving the sale (1031 exchange, divorce, estate, relocation)? That informs how much negotiation room exists.
- The area grade is low — what's the realistic commute time and amenity access for the typical tenant pool here? Any planned neighborhood developments (good or bad) we should know about?
- What's the average days-on-market for RENTAL listings here right now (not sales)? A rising rental-DOM trend means longer vacancies and softer asking-rent achievability than the comps imply.
- What's the recent tenant-quality profile in this submarket — average credit score on applications, eviction rate, late-payment / NSF rate, and stable-employment percentage? A property-management company in the area should have these aggregated.
- How much new for-sale + rental construction is in the pipeline within 1–3 miles? Heavy new supply typically softens prices + rents 12–24 months out; constrained supply supports both.
Investment metrics
- 1% rule
- 1.04% ✓
- Cap rate
- 6.14%
- Cash-on-cash
- -0.55%
- DSCR
- 0.98
- GRM
- 8.0
CMA / ARV
- ARV (on-the-fly)
- $216,094
- Comps found
- 9
Show comp detail 9 sales within ~0.75 mi
| Address | Dist | Beds/Ba | Sqft | Sold | Price | $/sf | Match |
|---|---|---|---|---|---|---|---|
| 719 NW San Remo Cir | 0.10mi | 2/2.0 | 1,037 (-1%) | 2mo | $180,325 | $174 | 92 |
| 1128 NW Lombardy Dr | 0.25mi | 2/2.0 | 1,037 (-1%) | 6mo | $198,000 | $191 | 82 |
| 697 NW San Remo Cir | 0.11mi | 2/2.0 | 1,037 (-1%) | 14mo | $215,000 | $207 | 82 |
| 541 NW San Remo Cir | 0.06mi | 2/2.0 | 1,066 (+2%) | 21mo | $220,000 | $206 | 78 |
| 557 NW San Remo Cir | 0.08mi | 2/2.0 | 1,190 (+13%) | 18mo | $200,000 | $168 | 59 |
| 451 NW Gibraltar Ct | 0.32mi | 2/2.0 | 1,145 (+9%) | 14mo | $235,000 | $205 | 59 |
| 1215 NW Sun Terrace Cir Unit C | 0.40mi | 2/2.0 | 1,152 (+10%) | 15mo | $250,000 | $217 | 52 |
| 1249 NW Sun Terrace Cir Unit 10D | 0.28mi | 2/2.0 | 1,152 (+10%) | 23mo | $280,000 | $243 | 52 |
| 537 NW Portofino Ln | 0.45mi | 2/2.0 | 1,176 (+12%) | 22mo | $257,500 | $219 | 40 |
Match score weights: distance 35% · size 25% · config 20% · recency 20%. Top-matched comps best support the ARV.
Projected returns pro-forma
-3.0% appreciation · 1.57% rent growth · sell at horizon
- IRR
- -19.0%
- Equity multiple
- 0.34×
- Total profit
- $-37,249
- Equity at exit
- $30,193
- IRR
- -15.3%
- Equity multiple
- 0.19×
- Total profit
- $-45,649
- Equity at exit
- $17,508
Cash invested: $56,700 (down + closing). Projections, not guarantees.
Landlord ↔ Tenant lean methodology
- Overall (STATE)
- 87 Strongly Landlord-Friendly
- State Florida
- 87 Strongly Landlord-Friendly · R+3
- County
- — inherits STATE
- City
- — inherits STATE
ZIP-level market 34986
- Home prices YoY
- -7.2%
- Rents YoY
- 1.6%
- Active inventory
- 491
- Price-to-rent
- 8.0×
Monthly cashflow live
- Estimated rent
- $2,114 high interval (Pro) →
- Mortgage (P&I)
- −$1,062
- Tax from tax record
- −$74 /mo · $888/yr
- Insurance
- −$84
- HOA
- −$476
- Vacancy / Maint / Mgmt
- −$444
- Net cashflow
- $-26
Break-even live
UW: 25.0% down · 7.5% · 30yr · 1.5% tax · 5.0% vac · 8.0% maint · 8.0% mgmt
Financing live
Cash to close
- Down payment
- $50,625
- Closing costs
- $6,075
- Reserves months
- —
- Total cash needed
- —
Loan-product check · same deal, 3 products live
Conventional
25% down · 7.5% · 30yr
- Down + closing
- —
- Monthly P&I
- —
- Monthly cashflow
- —
- DSCR
- —
- Eligible?
- —
Personal DTI + credit; lowest rate.
DSCR
20% down · 8.5% · 30yr
- Down + closing
- —
- Monthly P&I
- —
- Monthly cashflow
- —
- DSCR
- —
- Eligible?
- —
No personal income docs; deal must DSCR.
Hard money
10% down · 12.0% · 12mo
- Down + closing
- —
- Monthly P&I
- —
- Monthly cashflow
- —
- DSCR
- —
- Eligible?
- —
Short-term bridge; refi at stabilization.
Rent comps 11 comps
| Address | Beds | Baths | Sqft | Rent | $/sqft | DOM | Units | Dist |
|---|---|---|---|---|---|---|---|---|
| 271 SW Palm Dr #304 Port Saint Lucie, FL | 2.0 | 2.0 | 1033 | $2,000 | $1.94 | 14d | 1 | 0.76mi |
| 221 SW Palm Dr #108 Port Saint Lucie, FL | 2.0 | 2.0 | 960 | $2,000 | $2.08 | 14d | 1 | 0.78mi |
| 131 SW Palm Dr #201 Port Saint Lucie, FL | 1.0 | 1.0 | 868 | $1,650 | $1.90 | 23d | 1 | 0.82mi |
| 141 SW Palm Dr #306 Port Saint Lucie, FL | 2.0 | 2.0 | 960 | $1,850 | $1.93 | 23d | 1 | 0.86mi |
| 181 SW Palm Dr #203 Port Saint Lucie, FL | 2.0 | 2.0 | 1033 | $1,800 | $1.74 | 23d | 1 | 0.88mi |
| 161 SW Palm Dr #107 Port Saint Lucie, FL | 3.0 | 2.0 | 1321 | $1,999 | $1.51 | 23d | 1 | 0.88mi |
| 367 NW Aurora St Port Saint Lucie, FL | 2.0 | 1.0 | 940 | $2,050 | $2.18 | 14d | 1 | 1.08mi |
| 702 NW Orchid St Port Saint Lucie, FL | 3.0 | 2.0 | 1499 | $3,500 | $2.33 | 23d | 1 | 1.11mi |
| 581 NW Cornell Ave Port Saint Lucie, FL | 3.0 | 2.0 | 1035 | $2,600 | $2.51 | 23d | 1 | 1.34mi |
| 458 SW Talquin Ln Port Saint Lucie, FL | 3.0 | 2.0 | 1370 | $2,400 | $1.75 | 14d | 1 | 1.48mi |
| 507 NW Billiar Ave Port St Lucie, FL | 3.0 | 2.0 | 1249 | $2,350 | $1.88 | 21d | 1 | 1.49mi |
HOA detail
- Monthly dues
- $476 · $5,712/yr
- Likely covers
- poolsecurity
Listing history 25 events
-
2026-06-18days on market $202,500 Active 122 DOM
-
2026-06-17days on market $202,500 Active 121 DOM
-
2026-06-16days on market $202,500 Active 120 DOM
-
2026-06-15days on market $202,500 Active 119 DOM
-
2026-06-14days on market $202,500 Active 117 DOM
-
2026-06-13days on market $202,500 Active 116 DOM
-
2026-06-10days on market $202,500 Active 114 DOM
-
2026-06-09days on market $202,500 Active 113 DOM
-
2026-06-08days on market $202,500 Active 112 DOM
-
2026-06-07days on market $202,500 Active 111 DOM
-
2026-06-05days on market $202,500 Active 108 DOM
-
2026-06-03days on market $202,500 Active 107 DOM
-
2026-06-02days on market $202,500 Active 106 DOM
-
2026-06-01days on market $202,500 Active 105 DOM
-
2026-05-31days on market $202,500 Active 104 DOM
-
2026-05-30days on market $202,500 Active 103 DOM
-
2026-03-26status Active
-
2026-03-23historical Active Under Contract
-
2026-03-12status Active
-
2026-03-12price $202,500
-
2026-03-01historical Active Under Contract
-
2026-02-16$199,900 Active
-
2010-12-23soldstatus $62,500 187-char remark
Show marketing remark (187 chars)
Charming 2-Bd. , 2-Bth. , villa in park-like setting. Enclosed, private lanai, laundry room. Fabulous clubhouse, pool, spa, tennis, fitness ctr. , organized activities, 24 hour man-gated.
-
2010-11-09historical 187-char remark
Show marketing remark (187 chars)
Charming 2-Bd. , 2-Bth. , villa in park-like setting. Enclosed, private lanai, laundry room. Fabulous clubhouse, pool, spa, tennis, fitness ctr. , organized activities, 24 hour man-gated.
-
2010-05-24$79,900 187-char remark
Show marketing remark (187 chars)
Charming 2-Bd. , 2-Bth. , villa in park-like setting. Enclosed, private lanai, laundry room. Fabulous clubhouse, pool, spa, tennis, fitness ctr. , organized activities, 24 hour man-gated.
ⓘ Source: listings_history table (triggers on properties + properties_extension) + one-shot
backfill from property_details.listing_events for pre-trigger history.
Tax reassessment forecast FL · Resets to sale price
- Current annual tax
- $888 · $74/mo
- Projected year-2 tax
- $1,681 · $140/mo
- Expected delta
- +$793/yr (+$66/mo · 89.3%)
ⓘ Screening estimate from a state-policy table — verify with the county assessor before closing.
Climate risk First Street
- Flood 1/10 Low FEMA zone X (unshaded) · 0% chance over 30 yrs
- Wildfire 1/10 Low
- Heat 10/10 Extreme 7 d/yr ≥106°F today · 24 d/yr by 30 yrs out
- Wind 10/10 Extreme 99% chance of damaging wind over 30 yrs
- Air quality 1/10 Low 0 unhealthy d/yr today · 0 by 30 yrs out
Nearby sold comps map
Loading sold comps map…
Walkable amenities ~0.75 mi
Loading nearby amenities…
Taxation est. · year 1
- Rental income
- $25,373
- − Mortgage interest
- −$11,343
- − Property taxes
- −$888
- − Insurance
- −$1,012
- − Repairs & maintenance
- −$2,030
- − Management
- −$2,030
- − HOA
- −$5,712
- − Depreciation
- −$5,891
- Taxable loss
- −$3,533
- Est. tax savings @ 24.0%
- +$848
- After-tax cash flow
- $537/yr
For passive investors: Depreciation is non-cash, so a rental often shows a tax loss while cash-flowing — sheltering income. Rental losses are passive: they offset passive income freely, and up to $25,000/yr can offset ordinary (W-2) income if you actively participate and your MAGI is under $100k (phasing out to $0 by $150k); unused losses carry forward. On sale, claimed depreciation is recaptured at up to 25%, and gains may owe capital-gains tax (a 1031 exchange can defer both). Figures are a year-1 estimate at your 24.0% rate — not tax advice; consult a CPA.
Schools (NCES district)
- District
- St. Lucie
- NCES district ID
- 1201770
- Math proficiency
- 40% ▼ -11.00%
- Reading proficiency
- 48% ▼ -4.00%
- Median HH income
- $44,737
- Composite
- 37.28/100
- National rank
- #4449
- State rank
- #51 of 73 in FL
Livability — Port St. Lucie
No livability data for this city. (Only ~50 U.S. cities are tracked.)
Census & demographics
- Census place
- Port St. Lucie, FL
- County
- Saint Lucie County · 337,150 people
- City population
- 221,051
- Metro
- Port St. Lucie, FL
- Population (ZIP)
- 30,715
- Household income
- $80,047
- Rent vs Own
- Severe rent burden
- 253.0
Population outlook (St. Lucie County) Hauer SSP2
- Today (2025)
- 338,016 people
- By 2030
- 355,687 · +5.2%
- By 2040
- 385,521 · +14.1%
- By 2050
- 406,106 · +20.1%
- By 2075
- 441,054 · +30.5%
- By 2100
- 436,885 · +29.2%
Race, ethnicity, and origin ACS 2023
- Neighborhood character
- Diverse neighborhood (Simpson 0.57)
- Race & ethnicity
- White 62% Hispanic / Latino 19% Black 13% Two or more races 11% Asian 2%
- Hispanic origin (detail)
- Mexican 3% Puerto Rican 4% Cuban 3% Dominican 3%
- Common ancestry
- Romanian 4% Lithuanian 1% Scotch-Irish 1%
- Foreign-born
- 15% · Canada, Jamaica
- Languages at home
- 82% English-only · Spanish 14% Other Indo-European 2% French/Haitian/Cajun 1%
Political lean MEDSL · St. Lucie
- 2024 margin
- Lean R (+9.1) · D 45.1% · R 54.2%
- 2008→2024 swing
- -21.2pp toward R · 2008: 12.1pp · 2024: -9.1pp
- All cycles
- 2024: R+9.1 2020: R+1.6 2016: R+2.5 2012: D+7.9 2008: D+12.1
Not yet ingested
- Civics
- —
Market trends
- HPI YoY
- ▼ -19.55%
- Current HPI
- 251.4856
- Rent YoY
- ▲ 1.57%
- Metro
- Port St. Lucie, FL
- State GDP YoY
- ▲ 3.28%
- F500 in state
- 36
Industry mix (Fortune 500 HQ in FL)
| Industry | F500 HQs | Revenue |
|---|---|---|
| Industrial Technology | 2 | $29B |
|
||
| Insurance | 2 | $17B |
|
||
| Retail | 1 | $60B |
|
||
| Technology Distribution | 1 | $58B |
|
||
| Homebuilding | 1 | $35B |
|
||
| Technology Manufacturing | 1 | $35B |
|
||
Price history
+153.4% since first listed9 events — show timeline
- 2026-03-26 Relisted — Beaches MLS
- 2026-03-23 Contingent — Beaches MLS
- 2026-03-12 Relisted — Beaches MLS
- 2026-03-12 Price Changed $202,500 Beaches MLS
- 2026-03-01 Contingent — Beaches MLS
- 2026-02-16 Listed $199,900 Beaches MLS
- 2010-12-23 Sold (MLS) $62,500 Beaches MLS
- 2010-11-09 Listing Removed — Beaches MLS
- 2010-05-24 Listed $79,900 Beaches MLS
Property tax history
-1.8%/yrLatest (2025): $888 · -3.0% YoY. Source: county tax records.
Cash-flow waterfall
monthlySold comps — $/sqft
last 12 mo · ≤1 miLoading sold comps…