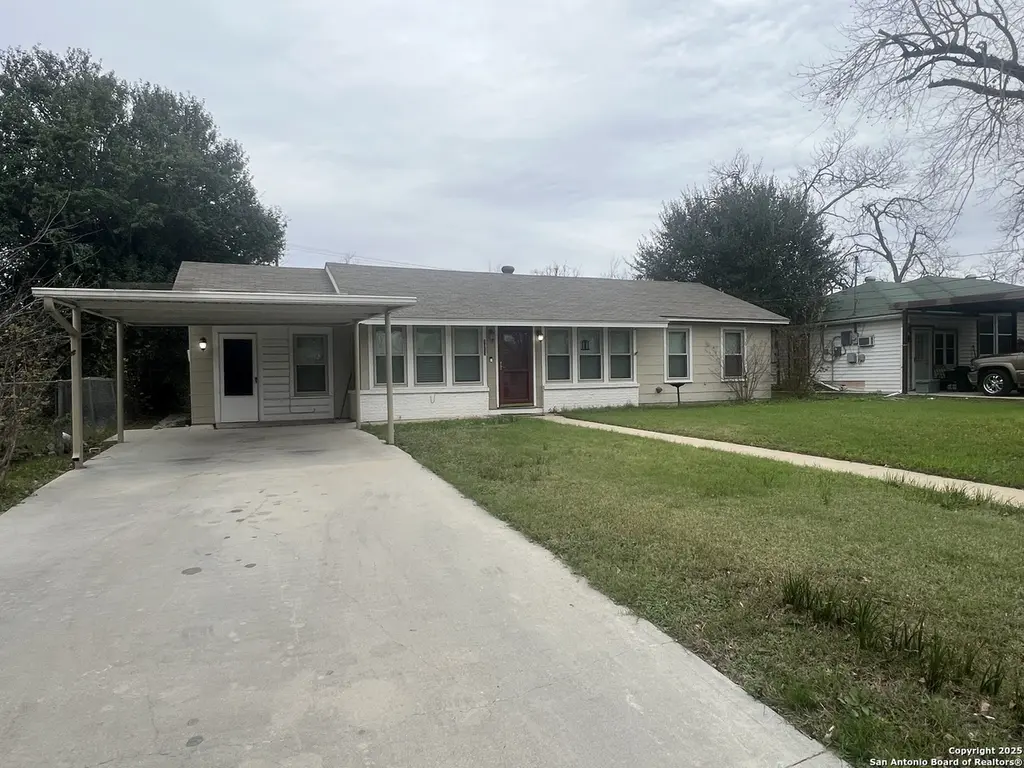
1012 E Walnut · Seguin, TX
Flood risk 1/10 · Minimal
- FEMA flood zone
- X (unshaded)
- Chance of flooding over 30 yrs
- 0.0%
- Est. flood insurance / yr
- $507 – $1,088
Fire risk 3/10 · Minor
- Est. fire insurance / yr
- $1,222 – $2,270
Heat risk 8/10 · Major
- Hot days now (above 108°F)
- 7 days/yr
- Hot days in 30 yrs
- 21 days/yr
Wind risk 8/10 · Major
- Chance of severe wind over 30 yrs
- 80.0%
Air-quality risk 1/10 · Minimal
- Unhealthy air days now
- 0 days/yr
- Unhealthy air days in 30 yrs
- 0 days/yr
Risk factors via First Street. Map © Google.
Why this score? — see what drove the D grade
The composite is a weighted blend of 9 inputs, each scored 0–100. Each bar is that input's sub-score; the figure is the points it added to the 100-point composite (weight × sub-score).
- ARV discount +12.9/15.0
- Cash flow +10.6/30.0
- Livability +3.3/5.0
- 1% rule +3.0/10.0
- DSCR +3.0/10.0
- Rent growth +3.0/5.0
- Condition / age +2.5/5.0
- Schools +2.4/10.0
- Appreciation +0.0/10.0
$199,990
🖨 Deal sheet 📄 Offer letter ✓ Due diligence
Listing remarks MLS
Welcome to 1012 E Walnut St in Seguin, TX! This move-in-ready 1,604 sq ft home features 3 bedrooms, 1 full bath, and 2 half baths with beautiful wood floors throughout. In addition to the converted garage providing flexible living space, the home offers an extra living area at the rear of the house overlooking the backyard-perfect for a family room, game room, or home office. Two carports, including one in front and an oversized covered carport in the back, provide excellent parking and storage. A versatile and functional home ready to sell! OWNER FINANCE AVAILABLE
Key facts
- Extra living area
- Wood floors
- Two carports
Tags
Neighborhood map
What this means for you Summary
Snapshot
- This is a 3-bed/2.5-bath single-family listed at $200k.
Deal economics
- At list price, monthly cash flow is $-100 ($-1k/yr) — negative.
- To cash-flow at today's rent, offer at most $182k (8.9% below list).
- To meet the 1% rule (rent ≥ 1% of price), the offer needs to be $159k (20.5% below list).
- Recommended offer: $159k (20.5% below list) — sets the bar for 1% rule.
- Cap rate 5.7% vs local median 3.7% in Seguin — top-decile yield for the area; either an underpriced asset or a hidden risk that comps aren't pricing in. Stress-test before assuming the spread holds.
Location & tenants
- Location reads 66/100 on livability (#592 in TX) — a middle-class / working-renter tenant base. Strengths: cost of living A+, housing A+; Watch: employment D, schools F, amenities F.
- Seguin ISD (town): math 26% / reading 30% proficiency, ranked #663 of 826 in TX (top 80%) — low school quality limits family demand, transient renter base, plan for 1-2y turnover; 63% free/reduced lunch — lower-income household profile, screen leases tightly.
- Market conditions: Rents rising (+2.0%/yr); 1342 active listings in the ZIP; 34 comparable units currently listed for rent nearby; rentals leasing fast (median 13d on market — plan ~1-2 weeks tenant-placement turnaround); 2,064 units permitted in Guadalupe County in 2024 (133 in 5+ unit buildings).
Forward outlook
- Local home prices are declining (-3.0%/yr); year-one equity from $1k of loan paydown is wiped out by about $6k of value loss. Plan a longer hold.
- Guadalupe County population projected at +61% by 2050 — long-run rental-demand tailwind backs the buy-and-hold thesis.
Negotiation context
- It's been on market 148 days — a 12% lower offer ($176k) is reasonable based on typical stale-listing flexibility.
Risks & watch-outs
- Watch-outs: built in 1950 — expect roof / HVAC / electrical / plumbing capex.
- Climate carrying-cost: severe wind risk, 80% chance of damaging wind over 30y; extreme-heat days projected 7→21/yr by 2055 (HVAC capex compounding) — expect insurance premiums to compound above CPI over the hold.
Questions for the listing agent
- What do current leases actually rent for vs. the listed asking? Can we see a recent rent roll and the last 12 months of T-12 income?
- It's been on market 148 days. Have you received any prior offers? Is the seller open to a 20% concession, seller financing, or rate buy-down credit?
- Built in 1950 — when were the roof, HVAC, electrical panel, plumbing, and water heater last replaced?
- Why hasn't it sold? Are there any deal-killer items the seller is aware of (foundation, flood, title, zoning, code violations)?
- Is there a deadline driving the sale (1031 exchange, divorce, estate, relocation)? That informs how much negotiation room exists.
- Schools are F-rated, which usually means shorter tenancies and higher turnover. Who's the typical renter profile here, and what's been the actual vacancy rate?
- The area grade is low — what's the realistic commute time and amenity access for the typical tenant pool here? Any planned neighborhood developments (good or bad) we should know about?
- What's the average days-on-market for RENTAL listings here right now (not sales)? A rising rental-DOM trend means longer vacancies and softer asking-rent achievability than the comps imply.
- What's the recent tenant-quality profile in this submarket — average credit score on applications, eviction rate, late-payment / NSF rate, and stable-employment percentage? A property-management company in the area should have these aggregated.
- How much new for-sale + rental construction is in the pipeline within 1–3 miles? Heavy new supply typically softens prices + rents 12–24 months out; constrained supply supports both.
Investment metrics
- 1% rule
- 0.80% ✗
- Cap rate
- 5.69%
- Cash-on-cash
- -2.15%
- DSCR
- 0.90
- GRM
- 10.5
CMA / ARV
- ARV (median comp)
- $226,991
- List price
- $199,990
- Delta
- -11.90%
- Verdict
- UNDERPRICED
- Comps
- 20 within 1.0 mi
Show comp detail 12 sales within ~0.75 mi
| Address | Dist | Beds/Ba | Sqft | Sold | Price | $/sf | Match |
|---|---|---|---|---|---|---|---|
| 1008 E College St | 0.21mi | 3/2.0 | 1,618 (+1%) | 6mo | $350,000 | $216 | 82 |
| 964 E Mountain | 0.09mi | 3/1.0 | 1,448 (-10%) | 3mo | $229,900 | $159 | 71 |
| 714 Cedar Pkwy | 0.42mi | 3/2.0 | 1,659 (+3%) | 5mo | $272,000 | $164 | 69 |
| 704 E Krezdorn St | 0.47mi | 3/2.0 | 1,631 (+2%) | 6mo | $209,900 | $129 | 68 |
| 105 N Moss | 0.27mi | 3/2.0 | 1,480 (-8%) | 5mo | $100,000 | $68 | 68 |
| 808 College | 0.33mi | 4/2.0 (+1) | 1,698 (+6%) | 2mo | $289,500 | $170 | 66 |
| 227 E College St | 0.67mi | 3/2.0 | 1,658 (+3%) | 0mo | $249,900 | $151 | 61 |
| 1124 E Kingsbury St Unit B | 0.70mi | 3/1.5 | 1,596 (-0%) | 6mo | $170,000 | $107 | 57 |
| 1124#B E Kingsbury St | 0.73mi | 3/1.5 | 1,596 (-0%) | 6mo | $170,000 | $107 | 56 |
| 925 E Humphreys St | 0.35mi | 3/2.0 | 1,840 (+15%) | 7mo | $349,000 | $190 | 52 |
| 223 E Elm St | 0.66mi | 2/1.0 (-1) | 1,694 (+6%) | 6mo | $220,000 | $130 | 44 |
| 625 Kathy Dr | 0.70mi | 3/2.0 | 1,772 (+10%) | 6mo | $329,990 | $186 | 43 |
Match score weights: distance 35% · size 25% · config 20% · recency 20%. Top-matched comps best support the ARV.
Projected returns pro-forma
-3.0% appreciation · 2.04% rent growth · sell at horizon
- IRR
- -20.9%
- Equity multiple
- 0.28×
- Total profit
- $-40,315
- Equity at exit
- $29,819
- IRR
- -16.6%
- Equity multiple
- 0.12×
- Total profit
- $-49,430
- Equity at exit
- $17,291
Cash invested: $55,997 (down + closing). Projections, not guarantees.
Landlord ↔ Tenant lean methodology
- Overall (STATE)
- 87 Strongly Landlord-Friendly
- State Texas
- 87 Strongly Landlord-Friendly · R+5
- County
- — inherits STATE
- City
- — inherits STATE
ZIP-level market 78155
- Rents YoY
- 2.0%
- Active inventory
- 1342
- Price-to-rent
- 10.5×
Monthly cashflow live
- Estimated rent
- $1,591 high interval (Pro) →
- Mortgage (P&I)
- −$1,049
- Tax from tax record
- −$225 /mo · $2,700/yr
- Insurance
- −$83
- HOA
- −$0
- Vacancy / Maint / Mgmt
- −$334
- Net cashflow
- $-100
Break-even live
UW: 25.0% down · 7.5% · 30yr · 1.5% tax · 5.0% vac · 8.0% maint · 8.0% mgmt
Financing live
Cash to close
- Down payment
- $49,998
- Closing costs
- $6,000
- Reserves months
- —
- Total cash needed
- —
Loan-product check · same deal, 3 products live
Conventional
25% down · 7.5% · 30yr
- Down + closing
- —
- Monthly P&I
- —
- Monthly cashflow
- —
- DSCR
- —
- Eligible?
- —
Personal DTI + credit; lowest rate.
DSCR
20% down · 8.5% · 30yr
- Down + closing
- —
- Monthly P&I
- —
- Monthly cashflow
- —
- DSCR
- —
- Eligible?
- —
No personal income docs; deal must DSCR.
Hard money
10% down · 12.0% · 12mo
- Down + closing
- —
- Monthly P&I
- —
- Monthly cashflow
- —
- DSCR
- —
- Eligible?
- —
Short-term bridge; refi at stabilization.
Rent comps 34 comps
| Address | Beds | Baths | Sqft | Rent | $/sqft | DOM | Units | Dist |
|---|---|---|---|---|---|---|---|---|
| 726 E Humphreys St Seguin, TX | 3.0 | 2.0 | 1248 | $1,500 | $1.20 | 24d | 1 | 0.46mi |
| 1386 E Walnut St Seguin, TX | 2.0 | 2.0 | 1107 | $1,270 | $1.15 | 43d | 1 | 0.50mi |
| 1400 E Walnut St Seguin, TX | 1.0–3.0 | 1.0–2.0 | 1042 | $1,775 | $1.70 | 1d | 10 | 0.52mi |
| 1302 Canary Ln Seguin, TX | 3.0 | 2.0 | 1300 | $1,850 | $1.42 | 2d | 1 | 0.71mi |
| 1107 Renee Way Seguin, TX | 3.0 | 2.0 | 1372 | $1,395 | $1.02 | 3d | 1 | 0.76mi |
| 1107 Renee Way Seguin, TX | 3.0 | 2.0 | 1372 | $1,445 | $1.05 | 20d | 1 | 0.76mi |
| 1131 Renee Way Seguin, TX | 3.0 | 2.0 | 1372 | $1,450 | $1.06 | 43d | 1 | 0.77mi |
| 1102 Renee Way Seguin, TX | 3.0 | 2.0 | 1372 | $1,395 | $1.02 | 12d | 1 | 0.78mi |
| 1114 Renee Way Seguin, TX | 3.0 | 2.0 | 1372 | $1,449 | $1.06 | 43d | 1 | 0.78mi |
| 1112 Renee Way Seguin, TX | 3.0 | 2.0 | 1372 | $1,494 | $1.09 | 12d | 1 | 0.79mi |
| 1116 Renee Way Seguin, TX | 3.0 | 2.0 | 1372 | $1,395 | $1.02 | 4d | 1 | 0.79mi |
| 1128 Renee Way Seguin, TX | 3.0 | 2.0 | 1372 | $1,395 | $1.02 | 4d | 1 | 0.79mi |
| 1339 Mockingbird Ln Seguin, TX | 3.0 | 2.0 | 1452 | $1,975 | $1.36 | 43d | 1 | 0.82mi |
| 1119 Burek Cross Seguin, TX | 3.0 | 2.0 | 1372 | $1,395 | $1.02 | 4d | 1 | 0.82mi |
| 301 Westbend Cir Seguin, TX | 3.0 | 2.0 | 1634 | $1,750 | $1.07 | 12d | 1 | 0.83mi |
| 1516 Lucille St Seguin, TX | 3.0 | 2.5 | 1372 | $1,445 | $1.05 | 15d | 1 | 0.88mi |
| 227 Lopez St Seguin, TX | 3.0 | 2.0 | 1298 | $1,249 | $0.96 | 12d | 1 | 0.90mi |
| 1143 Stanley Way Seguin, TX | 3.0 | 2.0 | 1372 | $1,450 | $1.06 | 15d | 1 | 0.90mi |
| 1155 Stanley Way Seguin, TX | 3.0 | 2.0 | 1372 | $1,450 | $1.06 | 24d | 1 | 0.91mi |
| 228 Garcia St Seguin, TX | 3.0 | 2.0 | 1298 | $1,275 | $0.98 | 4d | 1 | 0.92mi |
| 1128 Stanley Way Seguin, TX | 3.0 | 2.0 | 1372 | $1,600 | $1.17 | 43d | 1 | 0.92mi |
| 222 Garcia St Seguin, TX | 3.0 | 2.0 | 1298 | $1,215 | $0.94 | 2d | 1 | 0.92mi |
| 1152 Stanley Way Seguin, TX | 3.0 | 2.5 | 1372 | $1,395 | $1.02 | 4d | 1 | 0.93mi |
| 527 Elley St Seguin, TX | 3.0 | 3.0 | 1090 | $1,325 | $1.22 | 24d | 1 | 0.93mi |
| 219 Garcia St Seguin, TX | 3.0 | 2.0 | 1298 | $1,449 | $1.12 | 4d | 1 | 0.94mi |
| 1441 Robin Ln Seguin, TX | 3.0 | 2.0 | 2097 | $1,800 | $0.86 | 1d | 1 | 1.09mi |
| 745 Harry Miller Pass Seguin, TX | 1.0–3.0 | 1.0–2.5 | 1063 | $1,950 | $1.83 | 1d | 40 | 1.14mi |
| 1601 Hays St Seguin, TX | 3.0 | 2.0 | 1090 | $1,275 | $1.17 | 4d | 1 | 1.14mi |
| 651 Purple Sage Dr Seguin, TX | 3.0 | 2.0 | 1464 | $1,575 | $1.08 | 15d | 1 | 1.29mi |
| 1439 Barnes Dr Seguin, TX | 3.0 | 1.0–2.0 | 801 | $1,465 | $1.83 | 1d | 43 | 1.30mi |
| 526 E Baxter St Seguin, TX | 3.0 | 2.0 | 1255 | $1,350 | $1.08 | 24d | 1 | 1.30mi |
| 1512 Doncaster Dr Seguin, TX | 3.0 | 2.0 | 1314 | $1,695 | $1.29 | 43d | 1 | 1.41mi |
| 772 Mitchell Ave Seguin, TX | 3.0 | 2.0 | 1298 | $1,560 | $1.20 | 4d | 1 | 1.44mi |
| 223 W Baxter St Seguin, TX | 3.0 | 2.0 | 1298 | $1,664 | $1.28 | 2d | 1 | 1.47mi |
Listing history 1 events
-
2025-12-29$199,990 New 571-char remark
Show marketing remark (571 chars)
Welcome to 1012 E Walnut St in Seguin, TX! This move-in-ready 1,604 sq ft home features 3 bedrooms, 1 full bath, and 2 half baths with beautiful wood floors throughout. In addition to the converted garage providing flexible living space, the home offers an extra living area at the rear of the house overlooking the backyard-perfect for a family room, game room, or home office. Two carports, including one in front and an oversized covered carport in the back, provide excellent parking and storage. A versatile and functional home ready to sell! OWNER FINANCE AVAILABLE
ⓘ Source: listings_history table (triggers on properties + properties_extension) + one-shot
backfill from property_details.listing_events for pre-trigger history.
Tax reassessment forecast TX · Resets to sale price
- Current annual tax
- $2,700 · $225/mo
- Projected year-2 tax
- $3,660 · $305/mo
- Expected delta
- +$960/yr (+$80/mo · 35.6%)
ⓘ Screening estimate from a state-policy table — verify with the county assessor before closing.
Climate risk First Street
- Flood 1/10 Low FEMA zone X (unshaded) · 0% chance over 30 yrs
- Wildfire 3/10 Moderate
- Heat 8/10 Severe 7 d/yr ≥108°F today · 21 d/yr by 30 yrs out
- Wind 8/10 Severe 80% chance of damaging wind over 30 yrs
- Air quality 1/10 Low 0 unhealthy d/yr today · 0 by 30 yrs out
Nearby sold comps map
Loading sold comps map…
Walkable amenities ~0.75 mi
Loading nearby amenities…
Taxation est. · year 1
- Rental income
- $19,089
- − Mortgage interest
- −$11,203
- − Property taxes
- −$2,700
- − Insurance
- −$1,000
- − Repairs & maintenance
- −$1,527
- − Management
- −$1,527
- − Depreciation
- −$5,818
- Taxable loss
- −$4,686
- Est. tax savings @ 24.0%
- +$1,125
- After-tax cash flow
- $-80/yr
For passive investors: Depreciation is non-cash, so a rental often shows a tax loss while cash-flowing — sheltering income. Rental losses are passive: they offset passive income freely, and up to $25,000/yr can offset ordinary (W-2) income if you actively participate and your MAGI is under $100k (phasing out to $0 by $150k); unused losses carry forward. On sale, claimed depreciation is recaptured at up to 25%, and gains may owe capital-gains tax (a 1031 exchange can defer both). Figures are a year-1 estimate at your 24.0% rate — not tax advice; consult a CPA.
Schools (NCES district)
- District
- Seguin ISD
- NCES district ID
- 4839690
- Math proficiency
- 26% ▼ -8.00%
- Reading proficiency
- 30% ▼ -5.00%
- Median HH income
- $46,210
- Composite
- 24.17/100
- National rank
- #7738
- State rank
- #663 of 826 in TX
Livability — Seguin
- Score
- 66/100
- State rank
- #592
- US rank
- #11298
Category grades
Schools grade is shown separately in the Schools card above.
Census & demographics
- Census place
- Seguin, TX
- County
- Guadalupe County · 147,291 people
- City population
- 55,600
- Metro
- San Antonio-New Braunfels, TX
- Population (ZIP)
- 55,600
- Household income
- $71,039
- Rent vs Own
- Severe rent burden
- 1053.0
Population outlook (Guadalupe County) Hauer SSP2
- Today (2025)
- 196,854 people
- By 2030
- 220,210 · +11.9%
- By 2040
- 268,004 · +36.1%
- By 2050
- 316,333 · +60.7%
- By 2075
- 434,747 · +120.8%
- By 2100
- 520,447 · +164.4%
Race, ethnicity, and origin ACS 2023
- Neighborhood character
- Diverse neighborhood (Simpson 0.58)
- Race & ethnicity
- Hispanic / Latino 49% White 43% Two or more races 26% Black 5%
- Hispanic origin (detail)
- Mexican 41%
- Common ancestry
- Lithuanian 2% Slovak 1% Romanian 1%
- Foreign-born
- 8% · Canada
- Languages at home
- 74% English-only · Spanish 24% German/W. Germanic 1%
Political lean MEDSL · Guadalupe
- 2024 margin
- Strong R (+29.5) · D 34.8% · R 64.3%
- 2008→2024 swing
- +1.5pp toward D · 2008: -31.0pp · 2024: -29.5pp
- All cycles
- 2024: R+29.5 2020: R+24.2 2016: R+31.8 2012: R+35.1 2008: R+31.0
Not yet ingested
- Civics
- —
Market trends
- HPI YoY
- ▼ -147.43%
- Current HPI
- 160.5435
- Rent YoY
- ▲ 2.04%
- Metro
- San Antonio-New Braunfels, TX
- State GDP YoY
- ▲ 3.95%
- F500 in state
- 110
Industry mix (Fortune 500 HQ in TX)
| Industry | F500 HQs | Revenue |
|---|---|---|
| Energy | 16 | $1,198B |
|
||
| Technology | 5 | $198B |
|
||
| Engineering / Construction | 4 | $72B |
|
||
| Energy Services | 3 | $60B |
|
||
| Utilities | 3 | $41B |
|
||
| Healthcare | 2 | $330B |
|
||
Price history
1 event — show timeline
- 2025-12-29 Listed $199,990 LERA
Property tax history
-0.5%/yrLatest (2026): $2,700 · -15.9% YoY. Source: county tax records.
Cash-flow waterfall
monthlySold comps — $/sqft
last 12 mo · ≤1 miLoading sold comps…