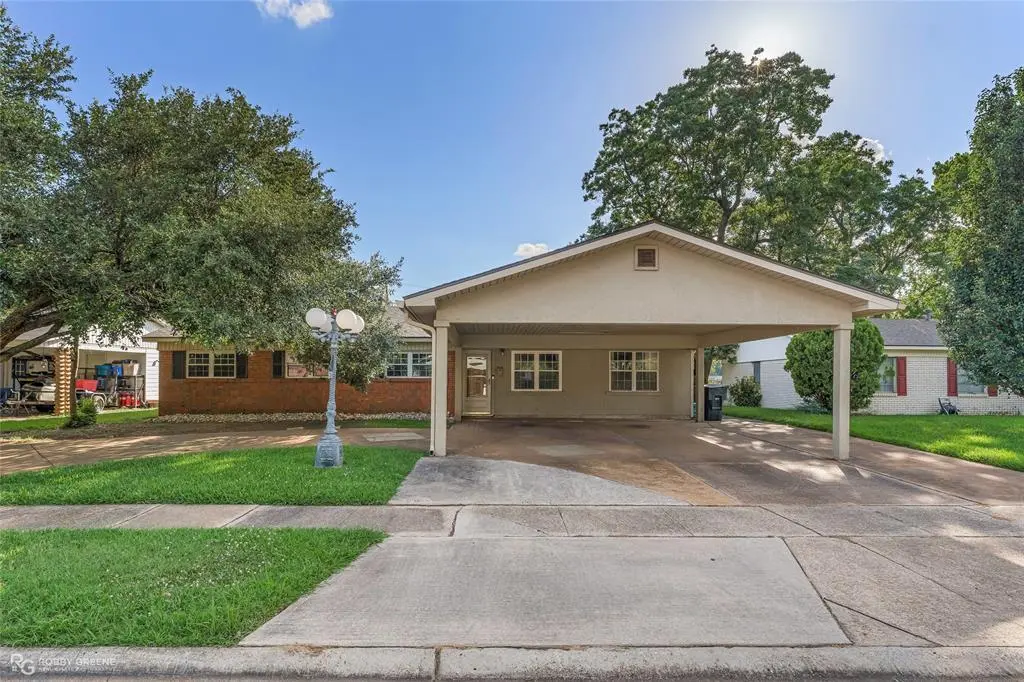
1603 Bistineau Dr · Bossier City, LA
Flood risk 6/10 · Moderate
- FEMA flood zone
- X (unshaded)
- Chance of flooding over 30 yrs
- 0.74%
- Est. flood insurance / yr
- $507 – $1,088
Fire risk 1/10 · Minimal
- Est. fire insurance / yr
- $1,269 – $2,357
Heat risk 7/10 · Major
- Hot days now (above 111°F)
- 7 days/yr
- Hot days in 30 yrs
- 22 days/yr
Wind risk 6/10 · Moderate
- Chance of severe wind over 30 yrs
- 66.0%
Air-quality risk 2/10 · Minimal
- Unhealthy air days now
- 1 days/yr
- Unhealthy air days in 30 yrs
- 2 days/yr
Risk factors via First Street. Map © Google.
Why this score? — see what drove the C+ grade
The composite is a weighted blend of 9 inputs, each scored 0–100. Each bar is that input's sub-score; the figure is the points it added to the 100-point composite (weight × sub-score).
- Cash flow +23.1/30.0
- ARV discount +15.0/15.0
- DSCR +7.4/10.0
- 1% rule +5.2/10.0
- Schools +3.8/10.0
- Livability +3.6/5.0
- Rent growth +3.4/5.0
- Condition / age +2.5/5.0
- Appreciation +0.0/10.0
$160,000
🖨 Deal sheet 📄 Offer letter ✓ Due diligence
Listing remarks
Welcome to Coleman Park in South Bossier, conveniently located just minutes from Barksdale Air Force Base, I-20, shopping, dining, and more! This spacious home offers nearly 2,000 square feet of living space with 4 oversized bedrooms, 2 full bathrooms, and a flexible floor plan designed to fit a variety of needs. Inside, you’ll find a cozy wood-burning fireplace, ample cabinet space, a large primary suite featuring a jetted tub, and plenty of room to spread out. Step outside to enjoy the covered back patio complete with an outdoor kitchen, perfect for entertaining. The property also includes a large storage building with the potential to be converted into a mother-in-law suite, works
Key facts
- Covered back patio
- Jetted tub
- Large primary suite
Tags
Property features AI
Finance
- Other: County: Bossier; Country: United States
- Financial info: Treat as clear loan type; No second mortgage
- HOA & community: No homeowners association
Exterior
- Parking: Covered carport for 2 vehicles; Driveway parking
- Utilities: City water; City sewer; Not in a municipal utility district
- Home design: Single family residence; One story; Residential property
- Construction: Built in 1962
- Exterior features: Lot under 0.5 acre (approx. 0.19 acre); Subdivision: Coleman Park 11
Interior
- Kitchen: Electric cooktop; Electric oven; Eat-in kitchen
- Bedrooms: 4 bedrooms (primary bedroom on main level)
- Bathrooms: 2 full bathrooms
- Interior features: Cable TV available; Eat-in kitchen; One living area; One dining area; Fireplace (wood burning)
Neighborhood map
What this means for you Summary
Snapshot
- This is a 4-bed/2.0-bath single-family listed at $160k.
Deal economics
- At list price, monthly cash flow is $286 ($3k/yr) — positive.
- The deal already cash-flows at list — no discount required.
- Meets the 1% rule at list price ($2k rent vs $160k).
- Cap rate 8.4% vs local median 4.7% in Bossier City — top-decile yield for the area; either an underpriced asset or a hidden risk that comps aren't pricing in. Stress-test before assuming the spread holds.
Location & tenants
- Location reads 71/100 on livability (#47 in LA) — a middle-class / working-renter tenant base. Strengths: commute A+, cost of living A+, housing A+; Watch: employment D+, crime F, amenities F.
- Bossier Parish (urban): math 40% / reading 47% proficiency, ranked #17 of 98 in LA (top 17%) — families likely to look elsewhere, expect single-tenant / working-renter base with shorter leases.
- Market conditions: Rents rising (+3.6%/yr); 145 active listings in the ZIP; 9 comparable units currently listed for rent nearby; rentals at typical pace (median 22d on market — plan ~3-4 weeks tenant-placement turnaround); 716 units permitted in Bossier Parish in 2024 (0 in 5+ unit buildings).
- This rent runs 32% of the median local income ($62k/yr) — at the standard rent-burdened threshold; future hikes will face affordability resistance.
Forward outlook
- Local home prices are declining (-3.0%/yr); year-one equity from $1k of loan paydown is wiped out by about $5k of value loss. Plan a longer hold.
- Bossier County population projected at +28% by 2050 — long-run rental-demand tailwind backs the buy-and-hold thesis.
Negotiation context
- Only 6 days on market — expect competitive offers; lowballing is unlikely to land.
Risks & watch-outs
- Climate carrying-cost: major flood risk; major wind risk, 66% chance of damaging wind over 30y; extreme-heat days projected 7→22/yr by 2055 (HVAC capex compounding) — expect insurance premiums to compound above CPI over the hold.
Questions for the listing agent
- Built in 1962 — when were the roof, HVAC, electrical panel, plumbing, and water heater last replaced?
- Is there a deadline driving the sale (1031 exchange, divorce, estate, relocation)? That informs how much negotiation room exists.
- Schools are B-rated — typically a magnet for longer-tenancy family renters. What's the average tenant stay here, and is there a school-zone premium baked into asking?
- Crime grade is F in this area — have there been break-ins, vandalism, or insurance claims at this property in the last 3 years? What carrier currently insures it and at what premium?
- What's the average days-on-market for RENTAL listings here right now (not sales)? A rising rental-DOM trend means longer vacancies and softer asking-rent achievability than the comps imply.
- What's the recent tenant-quality profile in this submarket — average credit score on applications, eviction rate, late-payment / NSF rate, and stable-employment percentage? A property-management company in the area should have these aggregated.
- How much new for-sale + rental construction is in the pipeline within 1–3 miles? Heavy new supply typically softens prices + rents 12–24 months out; constrained supply supports both.
Investment metrics
- 1% rule
- 1.02% ✓
- Cap rate
- 8.44%
- Cash-on-cash
- 7.66%
- DSCR
- 1.34
- GRM
- 8.1
CMA / ARV
- ARV (on-the-fly)
- $196,936
- Comps found
- 12
Show comp detail 12 sales within ~0.75 mi
| Address | Dist | Beds/Ba | Sqft | Sold | Price | $/sf | Match |
|---|---|---|---|---|---|---|---|
| 1502 Mark Ave | 0.09mi | 4/2.0 | 1,856 (-3%) | 11mo | $209,000 | $113 | 82 |
| 1509 Anita | 0.23mi | 4/2.0 | 1,846 (-4%) | 2mo | $206,000 | $112 | 81 |
| 2917 Bobbie St | 0.39mi | 4/2.0 | 1,923 (+1%) | 3mo | $199,000 | $103 | 78 |
| 2810 Eugene St | 0.38mi | 3/2.0 (-1) | 1,891 (-1%) | 1mo | $185,000 | $98 | 75 |
| 1620 Anita St | 0.19mi | 4/2.0 | 1,773 (-7%) | 6mo | $212,000 | $120 | 74 |
| 3203 Bistineau Dr | 0.21mi | 3/2.0 (-1) | 1,765 (-8%) | 5mo | $179,900 | $102 | 68 |
| 2916 Eugene | 0.32mi | 3/2.0 (-1) | 1,786 (-7%) | 6mo | $160,000 | $90 | 64 |
| 1358 Anita St | 0.42mi | 4/2.0 | 2,081 (+9%) | 3mo | $205,000 | $99 | 63 |
| 1620 Patricia Dr | 0.58mi | 3/2.0 (-1) | 1,870 (-2%) | 2mo | $205,000 | $110 | 63 |
| 3305 Jefferson Pl | 0.61mi | 4/2.0 | 1,646 (-14%) | 6mo | $249,999 | $152 | 43 |
| 1625 Patricia Dr | 0.61mi | 3/1.0 (-1) | 1,642 (-14%) | 1mo | $169,900 | $103 | 38 |
| 1163 Gilbert Dr | 0.72mi | 3/3.5 (-1) | 2,100 (+10%) | 6mo | $210,000 | $100 | 34 |
Match score weights: distance 35% · size 25% · config 20% · recency 20%. Top-matched comps best support the ARV.
Projected returns pro-forma
-3.0% appreciation · 3.6% rent growth · sell at horizon
- IRR
- -4.0%
- Equity multiple
- 0.85×
- Total profit
- $-6,745
- Equity at exit
- $23,857
- IRR
- 6.3%
- Equity multiple
- 1.48×
- Total profit
- $21,578
- Equity at exit
- $13,834
Cash invested: $44,800 (down + closing). Projections, not guarantees.
Landlord ↔ Tenant lean methodology
- Overall (STATE)
- 90 Strongly Landlord-Friendly
- State Louisiana
- 90 Strongly Landlord-Friendly · R+12
- County
- — inherits STATE
- City
- — inherits STATE
ZIP-level market 71112
- Rents YoY
- 3.6%
- Active inventory
- 145
- Price-to-rent
- 8.1×
Monthly cashflow live
- Estimated rent
- $1,638 high interval (Pro) →
- Mortgage (P&I)
- −$839
- Tax from tax record
- −$102 /mo · $1,223/yr
- Insurance
- −$67
- HOA
- −$0
- Vacancy / Maint / Mgmt
- −$344
- Net cashflow
- $286
Break-even live
UW: 25.0% down · 7.5% · 30yr · 1.5% tax · 5.0% vac · 8.0% maint · 8.0% mgmt
Financing live
Cash to close
- Down payment
- $40,000
- Closing costs
- $4,800
- Reserves months
- —
- Total cash needed
- —
Loan-product check · same deal, 3 products live
Conventional
25% down · 7.5% · 30yr
- Down + closing
- —
- Monthly P&I
- —
- Monthly cashflow
- —
- DSCR
- —
- Eligible?
- —
Personal DTI + credit; lowest rate.
DSCR
20% down · 8.5% · 30yr
- Down + closing
- —
- Monthly P&I
- —
- Monthly cashflow
- —
- DSCR
- —
- Eligible?
- —
No personal income docs; deal must DSCR.
Hard money
10% down · 12.0% · 12mo
- Down + closing
- —
- Monthly P&I
- —
- Monthly cashflow
- —
- DSCR
- —
- Eligible?
- —
Short-term bridge; refi at stabilization.
Rent comps 9 comps
| Address | Beds | Baths | Sqft | Rent | $/sqft | DOM | Units | Dist |
|---|---|---|---|---|---|---|---|---|
| 3202 Jana Pl Bossier City, LA | 3.0 | 1.0 | 1258 | $1,250 | $0.99 | 44d | 1 | 0.29mi |
| 1610 Dudley Ln Bossier City, LA | 4.0 | 2.0 | 1588 | $1,850 | $1.16 | 21d | 1 | 0.33mi |
| 3406 Black Lake Cir Bossier City, LA | 3.0 | 1.0 | 1400 | $1,200 | $0.86 | 21d | 1 | 0.36mi |
| 1301 Williamsburg Dr Bossier City, LA | 1.0–3.0 | 1.0–2.0 | 1025 | $1,655 | $1.61 | 14d | 28 | 0.47mi |
| 1302 Williamsburg Dr Bossier City, LA | 1.0–3.0 | 1.0–2.0 | 1050 | $1,720 | $1.64 | 21d | 14 | 0.50mi |
| 1231 Waller Ave Bossier City, LA | 3.0 | 1.0 | 1500 | $1,100 | $0.73 | 44d | 1 | 0.51mi |
| 1140 Schex Dr Bossier City, LA | 3.0 | 1.0 | 1346 | $1,500 | $1.11 | 21d | 1 | 0.52mi |
| 1204 Waller Ave Bossier City, LA | 4.0 | 2.0 | 1796 | $1,175 | $0.65 | 44d | 1 | 0.53mi |
| 4056 Beech St Bossier City, LA | 4.0 | 1.0 | 1391 | $1,400 | $1.01 | 21d | 1 | 0.68mi |
Listing history 6 events
-
2026-06-18days on market $160,000 Active 6 DOM
-
2026-06-17days on market $160,000 Active 5 DOM
-
2026-06-16days on market $160,000 Active 4 DOM
-
2026-06-15days on market $160,000 Active 3 DOM
-
2026-06-13remarks 693-char remark
-
2026-06-13$160,000 Active 1 DOM
ⓘ Source: listings_history table (triggers on properties + properties_extension) + one-shot
backfill from property_details.listing_events for pre-trigger history.
Tax reassessment forecast LA · Resets to sale price
- Current annual tax
- $1,223 · $102/mo
- Projected year-2 tax
- $1,223 · $102/mo
- Expected delta
- $0/yr ($0/mo · 0.0%)
ⓘ Screening estimate from a state-policy table — verify with the county assessor before closing.
Climate risk First Street
- Flood 6/10 Major FEMA zone X (unshaded) · 74% chance over 30 yrs
- Wildfire 1/10 Low
- Heat 7/10 Severe 7 d/yr ≥111°F today · 22 d/yr by 30 yrs out
- Wind 6/10 Major 66% chance of damaging wind over 30 yrs
- Air quality 2/10 Low 1 unhealthy d/yr today · 2 by 30 yrs out
Nearby sold comps map
Loading sold comps map…
Walkable amenities ~0.75 mi
Loading nearby amenities…
Taxation est. · year 1
- Rental income
- $19,652
- − Mortgage interest
- −$8,962
- − Property taxes
- −$1,223
- − Insurance
- −$800
- − Repairs & maintenance
- −$1,572
- − Management
- −$1,572
- − Depreciation
- −$4,655
- Taxable income
- $868
- Est. tax owed @ 24.0%
- −$208
- After-tax cash flow
- $3,225/yr
For passive investors: Depreciation is non-cash, so a rental often shows a tax loss while cash-flowing — sheltering income. Rental losses are passive: they offset passive income freely, and up to $25,000/yr can offset ordinary (W-2) income if you actively participate and your MAGI is under $100k (phasing out to $0 by $150k); unused losses carry forward. On sale, claimed depreciation is recaptured at up to 25%, and gains may owe capital-gains tax (a 1031 exchange can defer both). Figures are a year-1 estimate at your 24.0% rate — not tax advice; consult a CPA.
Schools (NCES district)
- District
- Bossier Parish
- NCES district ID
- 2200270
- Math proficiency
- 40% ▼ -32.00%
- Reading proficiency
- 47% ▼ -28.00%
- Median HH income
- $51,326
- Composite
- 37.5/100
- National rank
- #4402
- State rank
- #17 of 98 in LA
Livability — Bossier City
- Score
- 71/100
- State rank
- #47
- US rank
- #7044
Category grades
Schools grade is shown separately in the Schools card above.
Census & demographics
- Census place
- Bossier City, LA
- County
- Bossier Parish · 98,704 people
- City population
- 91,925
- Metro
- Shreveport-Bossier City, LA
- Population (ZIP)
- 33,587
- Household income
- $61,760
- Rent vs Own
- Severe rent burden
- 1391.0
Population outlook (Bossier County) Hauer SSP2
- Today (2025)
- 143,247 people
- By 2030
- 151,802 · +6.0%
- By 2040
- 168,194 · +17.4%
- By 2050
- 183,533 · +28.1%
- By 2075
- 217,009 · +51.5%
- By 2100
- 230,091 · +60.6%
Race, ethnicity, and origin ACS 2023
- Neighborhood character
- Diverse neighborhood (Simpson 0.57)
- Race & ethnicity
- White 59% Black 24% Hispanic / Latino 12% Two or more races 8% Asian 2%
- Hispanic origin (detail)
- Mexican 9%
- Common ancestry
- Lithuanian 2% Slovak 1% Scottish 1%
- Foreign-born
- 5% · Canada, Vietnam
- Languages at home
- 89% English-only · Spanish 7% Other Indo-European 1% Tagalog/Filipino 1%
Political lean MEDSL · Bossier
- 2024 margin
- Solid R (+43.3) · D 27.7% · R 71.0% · Other 1.3%
- 2008→2024 swing
- +0.3pp no change · 2008: -43.7pp · 2024: -43.3pp
- All cycles
- 2024: R+43.3 2020: R+41.0 2016: R+45.8 2012: R+45.4 2008: R+43.7
Not yet ingested
- Civics
- —
Market trends
- HPI YoY
- ▼ -77.48%
- Current HPI
- 127.9821
- Rent YoY
- ▲ 3.60%
- Metro
- Shreveport-Bossier City, LA
- State GDP YoY
- ▲ 3.29%
- F500 in state
- 10
Industry mix (Fortune 500 HQ in LA)
| Industry | F500 HQs | Revenue |
|---|---|---|
| Telecommunications | 2 | $23B |
|
||
| Utilities | 1 | $12B |
|
||
| Wholesale / Distribution | 1 | $5B |
|
||
| Advertising | 1 | $2B |
|
||
Price history
+146.2% since first listed4 events — show timeline
- 2026-06-12 Listed $160,000 NTREIS
- 2014-03-26 Sold (Public Records) $159,000 Public Records
- 2011-08-22 Sold (Public Records) $152,000 Public Records
- 1998-09-30 Sold (Public Records) $65,000 Public Records
Property tax history
-3.0%/yrLatest (2025): $1,223 · -1.3% YoY. Source: county tax records.
Cash-flow waterfall
monthlySold comps — $/sqft
last 12 mo · ≤1 miLoading sold comps…