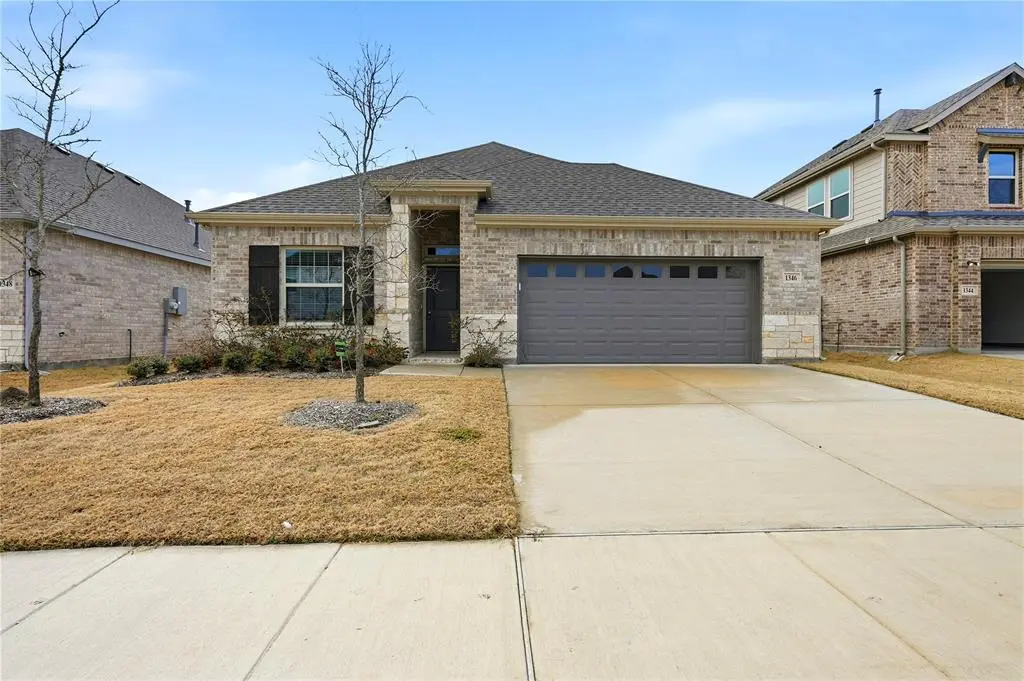
1346 Chisos Way · Forney, TX
Flood risk 3/10 · Minor
- FEMA flood zone
- X (unshaded)
- Chance of flooding over 30 yrs
- 0.2%
- Est. flood insurance / yr
- $507 – $1,088
Fire risk 6/10 · Moderate
- Est. fire insurance / yr
- $1,222 – $2,270
Heat risk 7/10 · Major
- Hot days now (above 111°F)
- 7 days/yr
- Hot days in 30 yrs
- 24 days/yr
Wind risk 6/10 · Moderate
- Chance of severe wind over 30 yrs
- 27.0%
Air-quality risk 2/10 · Minimal
- Unhealthy air days now
- 1 days/yr
- Unhealthy air days in 30 yrs
- 1 days/yr
Risk factors via First Street. Map © Google.
Why this score? — see what drove the F grade
The composite is a weighted blend of 9 inputs, each scored 0–100. Each bar is that input's sub-score; the figure is the points it added to the 100-point composite (weight × sub-score).
- ARV discount +15.0/15.0
- Schools +4.0/10.0
- Cash flow +3.9/30.0
- Livability +3.8/5.0
- Rent growth +2.9/5.0
- Condition / age +2.5/5.0
- 1% rule +2.2/10.0
- DSCR +0.0/10.0
- Appreciation +0.0/10.0
$312,500
🖨 Deal sheet (PDF) 📄 Offer letter ✓ Due diligence
Listing remarks MLS
Welcome to 1346 Chisos Way in Forney, TX — a well-designed 3-bedroom, 2-bath home situated near a quiet cul-de-sac. Inside, you’ll find a modern kitchen with quartz countertops, a spacious pantry, and a functional island that serves as the heart of the home — perfect for meal prep, casual dining, or gathering with friends and family. The open layout allows the kitchen to flow seamlessly into the living and dining areas, creating a comfortable space for both everyday living and entertaining. Luxury vinyl plank flooring extends throughout the main living areas, bathrooms, and utility room, offering durability with a clean, updated look. The primary suite provides a private retreat, while the additional bedrooms offer flexibility for guests, a home office, or growing needs. Out back, enjoy a generously sized backyard complete with board-on-board fencing for added privacy and a covered patio ideal for relaxing evenings or weekend cookouts. Whether you’re looking for a great starter home or a strong investment opportunity, this property checks the boxes. Las Lomas stands out for its impressive amenities, including scenic hiking and biking trails, eight community gathering spaces, and a fully equipped clubhouse — perfect for active lifestyles and community connection. Seller willing to offer $10,000 towards buyer rate buy down or closing costs. Additional move in ready homes available. Contact listing agent for more info.
Key facts
- Quartz countertops
- Spacious pantry
- Functional island
Tags
Neighborhood map
What this means for you Summary
Snapshot
- This is a 3-bed/2.0-bath land listed at $312k.
Deal economics
- At list price, monthly cash flow is $-887 ($-11k/yr) — negative.
- To cash-flow at today's rent, offer at most $200k (36.1% below list).
- To meet the 1% rule (rent ≥ 1% of price), the offer needs to be $225k (27.9% below list).
- Recommended offer: $200k (36.1% below list) — sets the bar for cash-flow.
- Cap rate 2.9% vs local median 4.1% in Forney — below-typical yield; the buyer is paying a premium for something (appreciation thesis, condition, location) that the cap rate doesn't capture.
Location & tenants
- Location reads 76/100 on livability (#98 in TX, #3,339 nationally) — a middle-class / working-renter tenant base. Strengths: crime A+, employment A+, cost of living A+; Watch: amenities C-, commute F.
- Forney ISD (rural): math 41% / reading 44% proficiency, ranked #234 of 826 in TX (top 28%) — families likely to look elsewhere, expect single-tenant / working-renter base with shorter leases.
- Zoned schools: Henderson El (math 52% / reading 54%, grade C, #705 of 4,322 statewide, top 17%, 737 students, 50% FRL); Warren Middle (math 43% / reading 50%, grade D+, #443 of 1,662 statewide, top 28%, 903 students, 26% FRL); Forney H S (math 64% / reading 58%, grade C+, #258 of 1,632 statewide, top 16%, 2,272 students, 28% FRL).
- Market conditions: Rents rising (+1.4%/yr); 2200 active listings in the ZIP; 19 comparable units currently listed for rent nearby; rentals leasing fast (median 9d on market — plan ~1-2 weeks tenant-placement turnaround); solid renter incomes; 1,747 units permitted in Kaufman County in 2024 (180 in 5+ unit buildings).
Forward outlook
- Local home prices are declining (-3.0%/yr); year-one equity from $2k of loan paydown is wiped out by about $9k of value loss. Plan a longer hold.
- Kaufman County population projected at +43% by 2050 — long-run rental-demand tailwind backs the buy-and-hold thesis.
Negotiation context
- It's been on market 124 days — a 12% lower offer ($275k) is reasonable based on typical stale-listing flexibility.
- 2 sale attempts with the ask held roughly flat each time — persistent listings suggest the price (not the market) is what's stuck; bring a comps-based counter.
Risks & watch-outs
- Watch-outs: property tax is 3.2% of price.
- Climate carrying-cost: major wind risk, 27% chance of damaging wind over 30y; major wildfire risk; extreme-heat days projected 7→24/yr by 2055 (HVAC capex compounding) — expect insurance premiums to compound above CPI over the hold.
Questions for the listing agent
- What do current leases actually rent for vs. the listed asking? Can we see a recent rent roll and the last 12 months of T-12 income?
- It's been on market 124 days. Have you received any prior offers? Is the seller open to a 36% concession, seller financing, or rate buy-down credit?
- Property tax is high relative to price — has the assessment been appealed recently, and will the sale trigger a re-assessment?
- What does the HOA fee cover, when was the last increase, and are there any pending special assessments or reserve-fund shortfalls?
- Why hasn't it sold? Are there any deal-killer items the seller is aware of (foundation, flood, title, zoning, code violations)?
- Is there a deadline driving the sale (1031 exchange, divorce, estate, relocation)? That informs how much negotiation room exists.
- Schools are B-rated — typically a magnet for longer-tenancy family renters. What's the average tenant stay here, and is there a school-zone premium baked into asking?
- The area grade is low — what's the realistic commute time and amenity access for the typical tenant pool here? Any planned neighborhood developments (good or bad) we should know about?
- What's the average days-on-market for RENTAL listings here right now (not sales)? A rising rental-DOM trend means longer vacancies and softer asking-rent achievability than the comps imply.
- What's the recent tenant-quality profile in this submarket — average credit score on applications, eviction rate, late-payment / NSF rate, and stable-employment percentage? A property-management company in the area should have these aggregated.
- How much new for-sale + rental construction is in the pipeline within 1–3 miles? Heavy new supply typically softens prices + rents 12–24 months out; constrained supply supports both.
Investment metrics
- 1% rule
- 0.72% ✗
- Cap rate
- 2.89%
- Cash-on-cash
- -12.17%
- DSCR
- 0.46
- GRM
- 11.6
CMA / ARV
- ARV (median comp)
- $374,585
- List price
- $312,500
- Delta
- -16.57%
- Verdict
- UNDERPRICED
- Comps
- 20 within 1.0 mi
Projected returns pro-forma
-3.0% appreciation · 1.42% rent growth · sell at horizon
- IRR
- -40.9%
- Equity multiple
- -0.26×
- Total profit
- $-110,321
- Equity at exit
- $46,595
- IRR
- -82.0%
- Equity multiple
- -1.07×
- Total profit
- $-181,434
- Equity at exit
- $27,019
Cash invested: $87,500 (down + closing). Projections, not guarantees.
Landlord ↔ Tenant lean methodology
- Overall (STATE)
- 87 Strongly Landlord-Friendly
- State Texas
- 87 Strongly Landlord-Friendly · R+5
- County
- — inherits STATE
- City
- — inherits STATE
ZIP-level market 75126
- Rents YoY
- 1.4%
- Active inventory
- 2200
- Price-to-rent
- 11.6×
Monthly cashflow live
- Estimated rent
- $2,253 high interval (Pro) →
- Mortgage (P&I)
- −$1,639
- Tax from tax record
- −$832 /mo · $9,987/yr
- Insurance
- −$130
- HOA
- −$66
- Vacancy / Maint / Mgmt
- −$473
- Net cashflow
- $-887
Break-even live
Sensitivity live
| Price | -10% $-710 | -5% $-799 | +0% $-887 | +5% $-976 | +10% $-1,064 |
|---|---|---|---|---|---|
| Rent | -10% $-1,065 | -5% $-976 | +0% $-887 | +5% $-798 | +10% $-709 |
| Rate | -1.0pp $-730 | -0.5pp $-808 | base $-887 | +0.5pp $-968 | +1.0pp $-1,050 |
UW: 25.0% down · 7.5% · 30yr · 1.5% tax · 5.0% vac · 8.0% maint · 8.0% mgmt
Financing live
Cash to close
- Down payment
- $78,125
- Closing costs
- $9,375
- Reserves months
- —
- Total cash needed
- —
Loan-product check · same deal, 3 products live
Conventional
25% down · 7.5% · 30yr
- Down + closing
- —
- Monthly P&I
- —
- Monthly cashflow
- —
- DSCR
- —
- Eligible?
- —
Personal DTI + credit; lowest rate.
DSCR
20% down · 8.5% · 30yr
- Down + closing
- —
- Monthly P&I
- —
- Monthly cashflow
- —
- DSCR
- —
- Eligible?
- —
No personal income docs; deal must DSCR.
Hard money
10% down · 12.0% · 12mo
- Down + closing
- —
- Monthly P&I
- —
- Monthly cashflow
- —
- DSCR
- —
- Eligible?
- —
Short-term bridge; refi at stabilization.
Rent comps 19 comps
| Address | Beds | Baths | Sqft | Rent | $/sqft | DOM | Units | Dist |
|---|---|---|---|---|---|---|---|---|
| 1374 Chisos Way Forney, TX | 4.0 | 2.0 | 1696 | $2,250 | $1.33 | 3d | 1 | 0.16mi |
| 12200 Helms Trl Forney, TX | 1.0–2.0 | 1.0–2.0 | 875 | $1,885 | $2.15 | 0d | 1 | 0.76mi |
| 1003 Windmill Farms Blvd Forney, TX | 1.0–3.0 | 1.0–2.0 | 1081 | $2,170 | $2.01 | 0d | 36 | 0.93mi |
| 1002 Manassas Dr Forney, TX | 3.0 | 2.0 | 1648 | $1,999 | $1.21 | 45d | 1 | 1.08mi |
| 1002 Manassas Dr Forney, TX | 3.0 | 2.0 | 1649 | $2,250 | $1.36 | 7d | 1 | 1.08mi |
| 1111 Cumberland Dr Forney, TX | 3.0 | 2.0 | 1424 | $1,750 | $1.23 | 45d | 1 | 1.10mi |
| 1123 Singletree Dr Forney, TX | 3.0 | 2.0 | 1492 | $1,750 | $1.17 | 26d | 1 | 1.11mi |
| 1123 Singletree Dr Forney, TX | 3.0 | 2.0 | 1492 | $1,750 | $1.17 | 5d | 1 | 1.11mi |
| 1201 Cumberland Ct Forney, TX | 3.0 | 2.0 | 2077 | $2,100 | $1.01 | 9d | 1 | 1.22mi |
| 1876 Lockhart Dr Forney, TX | 4.0 | 2.0 | 2058 | $2,950 | $1.43 | 45d | 1 | 1.25mi |
| 1836 Lockhart Dr Forney, TX | 4.0 | 2.0 | 1900 | $2,450 | $1.29 | 1d | 1 | 1.28mi |
| 1888 Everglades Dr Forney, TX | 4.0 | 2.0 | 1961 | $3,235 | $1.65 | 9d | 1 | 1.35mi |
| 1019 Chelsea Ln Forney, TX | 4.0 | 2.0 | 1840 | $2,205 | $1.20 | 1d | 1 | 1.39mi |
| 1112 Alexandria Dr Forney, TX | 3.0 | 2.0 | 1477 | $1,880 | $1.27 | 1d | 1 | 1.41mi |
| 1100 Alexandria Dr Forney, TX | 3.0 | 2.0 | 1553 | $1,725 | $1.11 | 9d | 1 | 1.42mi |
| 1100 Alexandria Dr Forney, TX | 3.0 | 2.0 | 1574 | $1,895 | $1.20 | 45d | 1 | 1.42mi |
| 1816 Pueblo St Forney, TX | 4.0 | 2.0 | 2204 | $2,350 | $1.07 | 45d | 1 | 1.45mi |
| 1848 McCree St Forney, TX | 4.0 | 2.0 | 1935 | $2,450 | $1.27 | 45d | 1 | 1.46mi |
| 1820 Pueblo St Forney, TX | 4.0 | 2.0 | 1900 | $2,245 | $1.18 | 45d | 1 | 1.46mi |
HOA detail
- Monthly dues
- $66 · $792/yr
Listing history 18 events
-
2026-06-21days on market $312,500 Active 124 DOM
-
2026-06-18days on market $312,500 Active 121 DOM
-
2026-06-17days on market $312,500 Active 120 DOM
-
2026-06-16days on market $312,500 Active 119 DOM
-
2026-06-15days on market $312,500 Active 118 DOM
-
2026-06-13days on market $312,500 Active 116 DOM
-
2026-06-13days on market $312,500 Active 115 DOM
-
2026-06-09days on market $312,500 Active 112 DOM
-
2026-06-08days on market $312,500 Active 111 DOM
-
2026-06-07days on market $312,500 Active 110 DOM
-
2026-06-04days on market $312,500 Active 107 DOM
-
2026-06-03days on market $312,500 Active 106 DOM
-
2026-06-02days on market $312,500 Active 105 DOM
-
2026-06-01days on market $312,500 Active 104 DOM
-
2026-05-31days on market $312,500 Active 103 DOM
-
2026-02-17$312,500 Active 1469-char remark
Show marketing remark (1469 chars)
Welcome to 1346 Chisos Way in Forney, TX — a well-designed 3-bedroom, 2-bath home situated near a quiet cul-de-sac. Inside, you’ll find a modern kitchen with quartz countertops, a spacious pantry, and a functional island that serves as the heart of the home — perfect for meal prep, casual dining, or gathering with friends and family. The open layout allows the kitchen to flow seamlessly into the living and dining areas, creating a comfortable space for both everyday living and entertaining. Luxury vinyl plank flooring extends throughout the main living areas, bathrooms, and utility room, offering durability with a clean, updated look. The primary suite provides a private retreat, while the additional bedrooms offer flexibility for guests, a home office, or growing needs. Out back, enjoy a generously sized backyard complete with board-on-board fencing for added privacy and a covered patio ideal for relaxing evenings or weekend cookouts. Whether you’re looking for a great starter home or a strong investment opportunity, this property checks the boxes. Las Lomas stands out for its impressive amenities, including scenic hiking and biking trails, eight community gathering spaces, and a fully equipped clubhouse — perfect for active lifestyles and community connection. Seller willing to offer $10,000 towards buyer rate buy down or closing costs. Additional move in ready homes available. Contact listing agent for more info.
-
2025-09-30historical
-
2025-07-11$325,000 Active
ⓘ Source: listings_history table (triggers on properties + properties_extension) + one-shot
backfill from property_details.listing_events for pre-trigger history.
Tax reassessment forecast TX · Resets to sale price
- Current annual tax
- $9,987 · $832/mo
- Projected year-2 tax
- $9,987 · $832/mo
- Expected delta
- $0/yr ($0/mo · 0.0%)
ⓘ Screening estimate from a state-policy table — verify with the county assessor before closing.
Climate risk First Street
- Flood 3/10 Moderate FEMA zone X (unshaded) · 20% chance over 30 yrs
- Wildfire 6/10 Major
- Heat 7/10 Severe 7 d/yr ≥111°F today · 24 d/yr by 30 yrs out
- Wind 6/10 Major 27% chance of damaging wind over 30 yrs
- Air quality 2/10 Low 1 unhealthy d/yr today · 1 by 30 yrs out
Nearby sold comps map
Loading sold comps map…
Walkable amenities ~0.75 mi
Loading nearby amenities…
Taxation est. · year 1
- Rental income
- $27,040
- − Mortgage interest
- −$17,505
- − Property taxes
- −$9,987
- − Insurance
- −$1,562
- − Repairs & maintenance
- −$2,163
- − Management
- −$2,163
- − HOA
- −$792
- − Depreciation
- −$9,091
- Taxable loss
- −$16,224
- Est. tax savings @ 24.0%
- +$3,894
- After-tax cash flow
- $-6,752/yr
For passive investors: Depreciation is non-cash, so a rental often shows a tax loss while cash-flowing — sheltering income. Rental losses are passive: they offset passive income freely, and up to $25,000/yr can offset ordinary (W-2) income if you actively participate and your MAGI is under $100k (phasing out to $0 by $150k); unused losses carry forward. On sale, claimed depreciation is recaptured at up to 25%, and gains may owe capital-gains tax (a 1031 exchange can defer both). Figures are a year-1 estimate at your 24.0% rate — not tax advice; consult a CPA.
Schools (NCES district)
- District
- Forney ISD
- NCES district ID
- 4819560
- Math proficiency
- 41% ▼ -20.00%
- Reading proficiency
- 44% ▼ -12.00%
- Median HH income
- $86,679
- Composite
- 40.07/100
- National rank
- #3812
- State rank
- #234 of 826 in TX
Livability — Forney
- Score
- 76/100
- State rank
- #98
- US rank
- #3339
Category grades
Schools grade is shown separately in the Schools card above.
Census & demographics
- County
- Kaufman County · 122,338 people
- Metro
- Dallas-Fort Worth-Arlington, TX
- Population (ZIP)
- 84,799
- Household income
- $103,673
- Rent vs Own
- Severe rent burden
- 1306.0
Population outlook (Kaufman County) Hauer SSP2
- Today (2025)
- 138,716 people
- By 2030
- 150,815 · +8.7%
- By 2040
- 174,877 · +26.1%
- By 2050
- 198,020 · +42.8%
- By 2075
- 251,908 · +81.6%
- By 2100
- 285,325 · +105.7%
Race, ethnicity, and origin ACS 2023
- Neighborhood character
- Diverse neighborhood (Simpson 0.68)
- Race & ethnicity
- White 45% Black 25% Hispanic / Latino 23% Two or more races 14% Asian 3%
- Hispanic origin (detail)
- Mexican 18% Puerto Rican 1%
- Common ancestry
- Italian 2% Slovak 1% Portuguese 1%
- Foreign-born
- 12% · Canada, Vietnam
- Languages at home
- 79% English-only · Spanish 14% Arabic 1% Vietnamese 1%
Political lean MEDSL · Kaufman
- 2024 margin
- Strong R (+27.9) · D 35.6% · R 63.5%
- 2008→2024 swing
- +7.9pp toward D · 2008: -35.8pp · 2024: -27.9pp
- All cycles
- 2024: R+27.9 2020: R+33.9 2016: R+47.0 2012: R+44.4 2008: R+35.8
Not yet ingested
- Civics
- —
Market trends
- HPI YoY
- ▼ -102.93%
- Current HPI
- 148.5749
- Rent YoY
- ▲ 1.42%
- Metro
- Dallas-Fort Worth-Arlington, TX
- State GDP YoY
- ▲ 3.95%
- F500 in state
- 110
Industry mix (Fortune 500 HQ in TX)
| Industry | F500 HQs | Revenue |
|---|---|---|
| Energy | 16 | $1,198B |
|
||
| Technology | 5 | $198B |
|
||
| Engineering / Construction | 4 | $72B |
|
||
| Energy Services | 3 | $60B |
|
||
| Utilities | 3 | $41B |
|
||
| Healthcare | 2 | $330B |
|
||
Price history
-3.8% since first listed3 events — show timeline
- 2026-02-17 Listed $312,500 NTREIS
- 2025-09-30 Listing Removed — NTREIS
- 2025-07-11 Listed $325,000 NTREIS
Property tax history
+136.1%/yrLatest (2025): $9,987 · +626.4% YoY. Source: county tax records.
Cash-flow waterfall
monthlySold comps — $/sqft
last 12 mo · ≤1 miLoading sold comps…