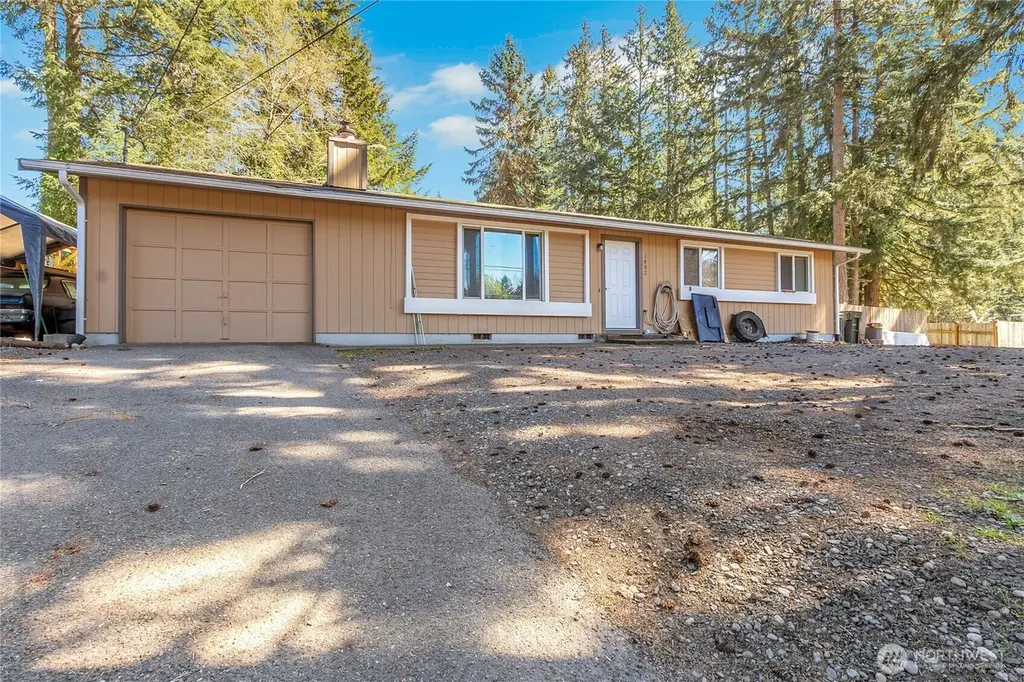
1402 Kaiser Rd NW · Olympia, WA
Flood risk 1/10 · Minimal
- FEMA flood zone
- X (unshaded)
- Chance of flooding over 30 yrs
- 0.0%
- Est. flood insurance / yr
- $507 – $1,088
Fire risk 2/10 · Minimal
- Est. fire insurance / yr
- $604 – $1,122
Heat risk 3/10 · Minor
- Hot days now (above 88°F)
- 7 days/yr
- Hot days in 30 yrs
- 14 days/yr
Wind risk 1/10 · Minimal
- Chance of severe wind over 30 yrs
- —
Air-quality risk 6/10 · Moderate
- Unhealthy air days now
- 7 days/yr
- Unhealthy air days in 30 yrs
- 7 days/yr
Risk factors via First Street. Map © Google.
Why this score? — see what drove the D grade
The composite is a weighted blend of 9 inputs, each scored 0–100. Each bar is that input's sub-score; the figure is the points it added to the 100-point composite (weight × sub-score).
- Appreciation +10.0/10.0
- ARV discount +9.6/15.0
- Schools +6.2/10.0
- Cash flow +4.7/30.0
- Livability +4.2/5.0
- Rent growth +3.3/5.0
- Condition / age +2.5/5.0
- 1% rule +0.0/10.0
- DSCR +0.0/10.0
$425,000
🖨 Deal sheet 📄 Offer letter ✓ Due diligence
Listing remarks
Beautifully updated 3-bedroom, 2-bath home on the desirable Westside, situated on a well-positioned corner lot. This home features an open-concept layout with a spacious living room, cozy fireplace, and recessed lighting. The kitchen offers stylish shaker cabinets, butcher block countertops, and great flow for everyday living and entertaining. Generous bedrooms and two fully updated bathrooms provide comfort and functionality. The . 24-acre lot offers plenty of yard space, is partially fenced, and provides room to enjoy the outdoors. Conveniently located near freeway access and local amenities.
Key facts
- Shaker cabinets
- Recessed lighting
- Cozy fireplace
Tags
Property features AI
Finance
- Other: Corner lot; paved site; Wooded vegetation; Partial slope topography
- Financial info: Listing offers financing via Cash, Conventional, FHA, or VA loan
Exterior
- Parking: Attached garage with 1 covered space
- Security: Partially fenced (listed under security features)
- Utilities: Public water; Septic sewer; Electric service (PSE)
- Home design: Single-family residence; One story; Entry on main level; Has a view
- Construction: Wood construction; Composition roof; Poured concrete foundation; Built on lot
- Exterior features: Partially fenced yard; Wood exterior
Interior
- Kitchen: Dishwasher; Microwave; Refrigerator; Stove/Range
- Bedrooms: 3 bedrooms (all on the main level); Primary bedroom (main level)
- Flooring: Ceramic tile; Laminate; Vinyl plank; Carpet
- Bathrooms: 2 full bathrooms (both on the main level)
- Heating & cooling: Stove/free-standing heating; Wall furnace; Wall cooling unit(s)
- Interior features: Dining room; Fireplace; Entry hall; Living room; Kitchen with eating space; Utility room
- Laundry & utility: Utility room (main level)
Neighborhood map
What this means for you Summary
Snapshot
- This is a 3-bed/1.5-bath single-family listed at $425k.
Deal economics
- At list price, monthly cash flow is $-1k ($-13k/yr) — negative.
- To cash-flow at today's rent, offer at most $237k (44.3% below list).
- To meet the 1% rule (rent ≥ 1% of price), the offer needs to be $215k (49.5% below list).
- Recommended offer: $215k (49.5% below list) — sets the bar for 1% rule.
- Cap rate 3.3% vs local median 2.4% in Olympia — top-decile yield for the area; either an underpriced asset or a hidden risk that comps aren't pricing in. Stress-test before assuming the spread holds.
Location & tenants
- Location reads 83/100 on livability (#58 in WA, #1,036 nationally) — a professional / high-income tenant draw. Strengths: amenities A+, commute A+, health & safety A+; Watch: crime F, cost of living D-.
- Olympia School District (urban): math 66% / reading 75% proficiency, ranked #17 of 291 in WA (top 6%) — strong family-tenant draw, lease renewals of 3-5y typical.
- Market conditions: Rents rising (+3.2%/yr); 304 active listings in the ZIP; 13 comparable units currently listed for rent nearby; rentals leasing fast (median 14d on market — plan ~1-2 weeks tenant-placement turnaround); solid renter incomes; 1,222 units permitted in Thurston County in 2024 (508 in 5+ unit buildings).
Forward outlook
- In year one you build about $45k of equity ($3k loan paydown + $42k appreciation (10.0% local appreciation)).
- Thurston County population projected at +27% by 2050 — long-run rental-demand tailwind backs the buy-and-hold thesis.
- By year 2, paydown + projected appreciation supports a ~$73k cash-out refi (75% LTV) — recoverable capital for the next deal without selling this one.
Negotiation context
- It's been on market 36 days — a 3% lower offer ($412k) is reasonable based on typical stale-listing flexibility.
- 2 sale attempts since 15y ago; this cycle's ask has dropped $25k (6%) from the opening price — seller is motivated, your offer sets the floor, not the list.
- Current owner paid $145k; list at $425k implies a 193% gain — meaningful room to come down on a strong offer.
Questions for the listing agent
- What do current leases actually rent for vs. the listed asking? Can we see a recent rent roll and the last 12 months of T-12 income?
- It's been on market 36 days. Have you received any prior offers? Is the seller open to a 50% concession, seller financing, or rate buy-down credit?
- Is there a deadline driving the sale (1031 exchange, divorce, estate, relocation)? That informs how much negotiation room exists.
- Schools are A-rated — typically a magnet for longer-tenancy family renters. What's the average tenant stay here, and is there a school-zone premium baked into asking?
- Crime grade is F in this area — have there been break-ins, vandalism, or insurance claims at this property in the last 3 years? What carrier currently insures it and at what premium?
- The area grade is low — what's the realistic commute time and amenity access for the typical tenant pool here? Any planned neighborhood developments (good or bad) we should know about?
- What's the average days-on-market for RENTAL listings here right now (not sales)? A rising rental-DOM trend means longer vacancies and softer asking-rent achievability than the comps imply.
- What's the recent tenant-quality profile in this submarket — average credit score on applications, eviction rate, late-payment / NSF rate, and stable-employment percentage? A property-management company in the area should have these aggregated.
- How much new for-sale + rental construction is in the pipeline within 1–3 miles? Heavy new supply typically softens prices + rents 12–24 months out; constrained supply supports both.
Investment metrics
- 1% rule
- 0.50% ✗
- Cap rate
- 3.28%
- Cash-on-cash
- -10.75%
- DSCR
- 0.52
- GRM
- 16.5
CMA / ARV
- ARV (median comp)
- $446,050
- List price
- $425,000
- Delta
- -4.72%
- Verdict
- FAIR
- Comps
- 13 within 1.0 mi
Show comp detail 1 sale within ~0.75 mi
| Address | Dist | Beds/Ba | Sqft | Sold | Price | $/sf | Match |
|---|---|---|---|---|---|---|---|
| 431 Craftsman Dr NW | 0.65mi | 2/2.0 (-1) | 1,123 (+9%) | 8mo | $435,000 | $387 | 41 |
Match score weights: distance 35% · size 25% · config 20% · recency 20%. Top-matched comps best support the ARV.
Projected returns pro-forma
10.0% appreciation · 3.16% rent growth · sell at horizon
- IRR
- 16.8%
- Equity multiple
- 2.38×
- Total profit
- $163,823
- Equity at exit
- $382,874
- IRR
- 16.0%
- Equity multiple
- 5.51×
- Total profit
- $536,397
- Equity at exit
- $825,682
Cash invested: $119,000 (down + closing). Projections, not guarantees.
Landlord ↔ Tenant lean methodology
- Overall (STATE)
- 28 Tenant-Leaning
- State Washington
- 28 Tenant-Leaning · D+8
- County
- — inherits STATE
- City
- — inherits STATE
ZIP-level market 98502
- Home prices YoY
- 1.8%
- Rents YoY
- 3.2%
- Active inventory
- 304
- Price-to-rent
- 16.5×
Monthly cashflow live
- Estimated rent
- $2,146 high interval (Pro) →
- Mortgage (P&I)
- −$2,229
- Tax from tax record
- −$356 /mo · $4,271/yr
- Insurance
- −$177
- HOA
- −$0
- Vacancy / Maint / Mgmt
- −$451
- Net cashflow
- $-1,066
Break-even live
UW: 25.0% down · 7.5% · 30yr · 1.5% tax · 5.0% vac · 8.0% maint · 8.0% mgmt
Financing live
Cash to close
- Down payment
- $106,250
- Closing costs
- $12,750
- Reserves months
- —
- Total cash needed
- —
Loan-product check · same deal, 3 products live
Conventional
25% down · 7.5% · 30yr
- Down + closing
- —
- Monthly P&I
- —
- Monthly cashflow
- —
- DSCR
- —
- Eligible?
- —
Personal DTI + credit; lowest rate.
DSCR
20% down · 8.5% · 30yr
- Down + closing
- —
- Monthly P&I
- —
- Monthly cashflow
- —
- DSCR
- —
- Eligible?
- —
No personal income docs; deal must DSCR.
Hard money
10% down · 12.0% · 12mo
- Down + closing
- —
- Monthly P&I
- —
- Monthly cashflow
- —
- DSCR
- —
- Eligible?
- —
Short-term bridge; refi at stabilization.
Rent comps 13 comps
| Address | Beds | Baths | Sqft | Rent | $/sqft | DOM | Units | Dist |
|---|---|---|---|---|---|---|---|---|
| 2040 Aqua Ct NW Olympia, WA | 2.0 | 1.0 | 975 | $2,150 | $2.21 | 13d | 1 | 0.60mi |
| 2016 Porta Ct NW Olympia, WA | 2.0 | 1.5 | 1200 | $1,995 | $1.66 | 13d | 1 | 0.62mi |
| 2028 Porta Ct NW Olympia, WA | 2.0 | 1.5 | 950 | $1,995 | $2.10 | 21d | 1 | 0.64mi |
| 3120 14th Ave NW Unit 3108-A Olympia, WA | 2.0 | 1.0 | 753 | $1,550 | $2.06 | 43d | 1 | 0.91mi |
| 3120 14th Ave NW Unit 3118-B Olympia, WA | 2.0 | 1.0 | 826 | $1,600 | $1.94 | 43d | 1 | 0.91mi |
| 5004 4th Way SW Olympia, WA | 2.0–3.0 | 2.0–2.5 | 1271 | $2,645 | $2.08 | 13d | 5 | 0.93mi |
| 4611 Greenwood Dr SW Olympia, WA | 3.0 | 3.0 | 1448 | $2,495 | $1.72 | 43d | 1 | 1.05mi |
| 2800 Limited Ln NW Olympia, WA | 1.0–2.0 | 1.0–2.0 | 775 | $1,503 | $1.94 | 13d | 4 | 1.35mi |
| 800 Yauger Way SW Olympia, WA | 1.0–2.0 | 1.0–2.0 | 1034 | $2,131 | $2.06 | 13d | 13 | 1.37mi |
| 3311 6th Ave SW Olympia, WA | 1.0–3.0 | 1.0–2.0 | 888 | $2,470 | $2.78 | 13d | 16 | 1.39mi |
| 3138 Overhulse Rd NW Olympia, WA | 1.0–3.0 | 1.0 | 670 | $1,810 | $2.70 | 13d | 1 | 1.39mi |
| 1829 E End St NW Unit B Olympia, WA | 2.0 | 1.0 | 1100 | $2,100 | $1.91 | 43d | 1 | 1.39mi |
| 2400 20th Ave NW Olympia, WA | 2.0 | 1.0 | 830 | $1,932 | $2.33 | 21d | 2 | 1.46mi |
Listing history 11 events
-
2026-05-31status $425,000 Pending 36 DOM
-
2026-05-30days on market $425,000 Active 36 DOM
-
2026-05-16price $425,000
-
2026-04-24$450,000 Active
-
2011-05-23soldstatus $144,900 Sold
-
2011-05-23soldstatus $144,900
-
2011-04-21status Pending Inspection
-
2011-03-30price $144,900
-
2011-03-03price $149,900
-
2011-01-05$159,900 Active
-
1984-04-06soldstatus $51,500
ⓘ Source: listings_history table (triggers on properties + properties_extension) + one-shot
backfill from property_details.listing_events for pre-trigger history.
Tax reassessment forecast WA · Resets to sale price
- Current annual tax
- $4,271 · $356/mo
- Projected year-2 tax
- $4,271 · $356/mo
- Expected delta
- $0/yr ($0/mo · 0.0%)
ⓘ Screening estimate from a state-policy table — verify with the county assessor before closing.
Climate risk First Street
- Flood 1/10 Low FEMA zone X (unshaded) · 0% chance over 30 yrs
- Wildfire 2/10 Low
- Heat 3/10 Moderate 7 d/yr ≥88°F today · 14 d/yr by 30 yrs out
- Wind 1/10 Low
- Air quality 6/10 Major 7 unhealthy d/yr today · 7 by 30 yrs out
Nearby sold comps map
Loading sold comps map…
Walkable amenities ~0.75 mi
Loading nearby amenities…
Taxation est. · year 1
- Rental income
- $25,754
- − Mortgage interest
- −$23,807
- − Property taxes
- −$4,271
- − Insurance
- −$2,125
- − Repairs & maintenance
- −$2,060
- − Management
- −$2,060
- − Depreciation
- −$12,364
- Taxable loss
- −$20,933
- Est. tax savings @ 24.0%
- +$5,024
- After-tax cash flow
- $-7,772/yr
For passive investors: Depreciation is non-cash, so a rental often shows a tax loss while cash-flowing — sheltering income. Rental losses are passive: they offset passive income freely, and up to $25,000/yr can offset ordinary (W-2) income if you actively participate and your MAGI is under $100k (phasing out to $0 by $150k); unused losses carry forward. On sale, claimed depreciation is recaptured at up to 25%, and gains may owe capital-gains tax (a 1031 exchange can defer both). Figures are a year-1 estimate at your 24.0% rate — not tax advice; consult a CPA.
Schools (NCES district)
- District
- Olympia School District
- NCES district ID
- 5306180
- Math proficiency
- 66% ▼ -2.00%
- Reading proficiency
- 75% ▼ -2.00%
- Median HH income
- $63,852
- Composite
- 62.27/100
- National rank
- #1438
- State rank
- #17 of 291 in WA
Livability — Olympia
- Score
- 83/100
- State rank
- #58
- US rank
- #1036
Category grades
Schools grade is shown separately in the Schools card above.
Census & demographics
- Census place
- Olympia, WA
- County
- Thurston County · 269,345 people
- City population
- 98,428
- Metro
- Olympia-Lacey-Tumwater, WA
- Population (ZIP)
- 35,398
- Household income
- $92,207
- Rent vs Own
- Severe rent burden
- 1811.0
Population outlook (Thurston County) Hauer SSP2
- Today (2025)
- 308,239 people
- By 2030
- 326,483 · +5.9%
- By 2040
- 359,890 · +16.8%
- By 2050
- 391,800 · +27.1%
- By 2075
- 468,024 · +51.8%
- By 2100
- 519,890 · +68.7%
Race, ethnicity, and origin ACS 2023
- Neighborhood character
- Predominantly White (71%)
- Race & ethnicity
- White 71% Two or more races 13% Hispanic / Latino 11% Asian 6% Black 3% Native American 1%
- Hispanic origin (detail)
- Mexican 3% Puerto Rican 4%
- Common ancestry
- Italian 5% Portuguese 4% Iranian 3%
- Foreign-born
- 8% · Vietnam, Canada, China
- Languages at home
- 90% English-only · Spanish 3% Vietnamese 2% Other Asian/Pacific 1%
Political lean MEDSL · Thurston
- 2024 margin
- Strong D (+20.4) · D 58.5% · R 38.1% · Other 3.5%
- 2008→2024 swing
- -1.3pp toward R · 2008: 21.7pp · 2024: 20.4pp
- All cycles
- 2024: D+20.4 2020: D+18.6 2016: D+15.4 2012: D+19.0 2008: D+21.7
Not yet ingested
- Civics
- —
Market trends
- HPI YoY
- ▲ 18.49%
- Current HPI
- 1056.49
- Rent YoY
- ▲ 3.16%
- Metro
- Olympia-Lacey-Tumwater, WA
- State GDP YoY
- ▲ 4.65%
- F500 in state
- 22
Industry mix (Fortune 500 HQ in WA)
| Industry | F500 HQs | Revenue |
|---|---|---|
| Retail | 2 | $269B |
|
||
| Technology / Retail | 1 | $638B |
|
||
| Technology | 1 | $245B |
|
||
| Telecommunications | 1 | $38B |
|
||
| Food / Beverage | 1 | $36B |
|
||
| Automotive / Trucks | 1 | $34B |
|
||
Price history
+725.2% since first listed10 events — show timeline
- 2026-05-31 Pending — NWMLS as Distributed by MLS Grid
- 2026-05-16 Price Changed $425,000 NWMLS as Distributed by MLS Grid
- 2026-04-24 Listed $450,000 NWMLS as Distributed by MLS Grid
- 2011-05-23 Sold (Public Records) $144,900 Public Records
- 2011-05-23 Sold (MLS) $144,900 NWMLS as Distributed by MLS Grid
- 2011-04-21 Pending — NWMLS as Distributed by MLS Grid
- 2011-03-30 Price Changed $144,900 NWMLS as Distributed by MLS Grid
- 2011-03-03 Price Changed $149,900 NWMLS as Distributed by MLS Grid
- 2011-01-05 Listed $159,900 NWMLS as Distributed by MLS Grid
- 1984-04-06 Sold (Public Records) $51,500 Public Records
Property tax history
+5.9%/yrLatest (2026): $4,271 · +18.2% YoY. Source: county tax records.
Cash-flow waterfall
monthlySold comps — $/sqft
last 12 mo · ≤1 miLoading sold comps…