14102 Perry Dr · Norman, OK
Flood risk 5/10 · Moderate
- FEMA flood zone
- X (unshaded)
- Chance of flooding over 30 yrs
- 0.65%
- Est. flood insurance / yr
- $507 – $1,088
Fire risk 5/10 · Moderate
- Est. fire insurance / yr
- $2,463 – $4,575
Heat risk 5/10 · Moderate
- Hot days now (above 108°F)
- 7 days/yr
- Hot days in 30 yrs
- 18 days/yr
Wind risk 2/10 · Minimal
- Chance of severe wind over 30 yrs
- 4.0%
Air-quality risk 2/10 · Minimal
- Unhealthy air days now
- 1 days/yr
- Unhealthy air days in 30 yrs
- 1 days/yr
Risk factors via First Street. Map © Google.
Why this score? — see what drove the C+ grade
The composite is a weighted blend of 9 inputs, each scored 0–100. Each bar is that input's sub-score; the figure is the points it added to the 100-point composite (weight × sub-score).
- Cash flow +28.7/30.0
- DSCR +10.0/10.0
- ARV discount +7.5/15.0
- 1% rule +6.7/10.0
- Livability +4.2/5.0
- Rent growth +2.5/5.0
- Condition / age +2.5/5.0
- Schools +1.5/10.0
- Appreciation +0.0/10.0
$165,000
🖨 Deal sheet (PDF) 📄 Offer letter ✓ Due diligence
Listing remarks
Welcome to peaceful country living!! This 3-bedroom, 2 bath manufactured home on 5 beautiful acres. A rare opportunity offering space, privacy, and endless possibilities. The open floor plan features a living area, functional kitchen with ample cabinet space, and a comfortable primary suite with a private bath. Two additional bedrooms provides flexibility for guests, a home office, or hobbies. Step outside and enjoy wide-open land perfect for animals, gardening, recreation, or future expansion. Whether you're looking for a quiet retreat or a place to build your dream lifestyle, this property delivers freedom of rural living while still being within convenient distance to town amenities. Don
Key facts
- Functional kitchen
- Open floor plan
- Wide-open land
Tags
Property features AI
Finance
- Other: Homestead eligible; Lot size approximately 5 acres; Located in the Pride 34 addition; No storm shelter; Occupied; Active MLS listing; No home warranty
- Financial info: Loan qualification possible (loan qualify: yes); Not assumable
- HOA & community: Mandatory association dues of $200
Exterior
- Parking: No parking details provided
- Security: No security details provided
- Utilities: No water/sewer/power provider details provided
- Home design: Single family residence; One-level property; Residential property; Move-to-site installation (manufactured home)
- Construction: Manufactured construction; Metal roof; Conventional foundation; Built as move-to-site (model home: no)
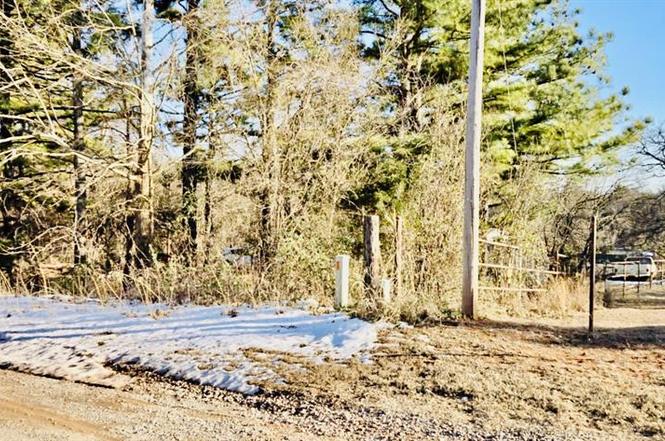
- Exterior features: Covered porch; Rural lot
Interior
- Kitchen: No appliance list provided
- Bedrooms: 3 bedrooms
- Flooring: No flooring details provided
- Bathrooms: 2 full bathrooms
- Heating & cooling: Electric heating
- Interior features: Open living area
- Laundry & utility: No laundry details provided
Neighborhood map
What this means for you Summary
Snapshot
- This is a 3-bed/2.0-bath manufactured listed at $165k.
Deal economics
- At list price, monthly cash flow is $547 ($7k/yr) — positive.
- The deal already cash-flows at list — no discount required.
- Meets the 1% rule at list price ($2k rent vs $165k).
- Recommended offer: $145k (12.0% below list) — sets the bar for market timing.
- Cap rate 10.3% vs local median 3.6% in Norman — top-decile yield for the area; either an underpriced asset or a hidden risk that comps aren't pricing in. Stress-test before assuming the spread holds.
Location & tenants
- Location reads 85/100 on livability (#1 in OK, #557 nationally) — a professional / high-income tenant draw. Strengths: amenities A+, commute A+, cost of living A+.
- Mcloud (rural): math 13% / reading 19% proficiency, ranked #201 of 270 in OK (top 74%) — low school quality limits family demand, transient renter base, plan for 1-2y turnover.
- Zoned schools: Mcloud Es (math 27% / reading 22%, grade F, #354 of 845 statewide, top 47%, 214 students, 0% FRL); Mcloud Hs (math 12% / reading 27%, grade F, #296 of 447 statewide, top 67%, 509 students, 0% FRL) — zoned schools average 0% FRL vs 53% district-wide (53 pts lower); this property's tenant base skews higher-income than the district average.
- Market conditions: 97 active listings in the ZIP; 592 units permitted in Cleveland County in 2024 (12 in 5+ unit buildings).
Forward outlook
- Local home prices are declining (-3.0%/yr); year-one equity from $1k of loan paydown is wiped out by about $5k of value loss. Plan a longer hold.
- Cleveland County population projected at +40% by 2050 — long-run rental-demand tailwind backs the buy-and-hold thesis.
- At projected returns (-3.0% appreciation + 3.0% rent growth), your $46k cash investment doubles in ~9 years — after that, you're playing with house money.
Negotiation context
- It's been on market 136 days — a 12% lower offer ($145k) is reasonable based on typical stale-listing flexibility.
Risks & watch-outs
- Climate carrying-cost: moderate flood risk; moderate wildfire risk; extreme-heat days projected 7→18/yr by 2055 (HVAC capex compounding) — expect insurance premiums to compound above CPI over the hold.
Questions for the listing agent
- It's been on market 136 days. Have you received any prior offers? Is the seller open to a 12% concession, seller financing, or rate buy-down credit?
- What does the HOA fee cover, when was the last increase, and are there any pending special assessments or reserve-fund shortfalls?
- Why hasn't it sold? Are there any deal-killer items the seller is aware of (foundation, flood, title, zoning, code violations)?
- Is there a deadline driving the sale (1031 exchange, divorce, estate, relocation)? That informs how much negotiation room exists.
- What's the average days-on-market for RENTAL listings here right now (not sales)? A rising rental-DOM trend means longer vacancies and softer asking-rent achievability than the comps imply.
- What's the recent tenant-quality profile in this submarket — average credit score on applications, eviction rate, late-payment / NSF rate, and stable-employment percentage? A property-management company in the area should have these aggregated.
- How much new for-sale + rental construction is in the pipeline within 1–3 miles? Heavy new supply typically softens prices + rents 12–24 months out; constrained supply supports both.
Investment metrics
- 1% rule
- 1.17% ✓
- Cap rate
- 10.27%
- Cash-on-cash
- 14.20%
- DSCR
- 1.63
- GRM
- 7.1
CMA / ARV
No comps found within radius.
Projected returns pro-forma
-3.0% appreciation · 3.0% rent growth · sell at horizon
- IRR
- 4.5%
- Equity multiple
- 1.17×
- Total profit
- $8,019
- Equity at exit
- $24,602
- IRR
- 13.9%
- Equity multiple
- 2.12×
- Total profit
- $51,546
- Equity at exit
- $14,266
Cash invested: $46,200 (down + closing). Projections, not guarantees.
Landlord ↔ Tenant lean methodology
- Overall (STATE)
- 83 Strongly Landlord-Friendly
- State Oklahoma
- 83 Strongly Landlord-Friendly · R+20
- County
- — inherits STATE
- City
- — inherits STATE
ZIP-level market 74857
- Home prices YoY
- -10.6%
- Active inventory
- 97
- Price-to-rent
- 7.1×
Monthly cashflow live
- Estimated rent
- $1,934 medium interval (Pro) →
- Mortgage (P&I)
- −$865
- Tax from tax record
- −$30 /mo · $361/yr
- Insurance
- −$69
- HOA
- −$17
- Vacancy / Maint / Mgmt
- −$406
- Net cashflow
- $547
Break-even live
Sensitivity live
| Price | -10% $640 | -5% $593 | +0% $547 | +5% $500 | +10% $257 |
|---|---|---|---|---|---|
| Rent | -10% $394 | -5% $470 | +0% $547 | +5% $623 | +10% $700 |
| Rate | -1.0pp $630 | -0.5pp $589 | base $547 | +0.5pp $504 | +1.0pp $461 |
UW: 25.0% down · 7.5% · 30yr · 1.5% tax · 5.0% vac · 8.0% maint · 8.0% mgmt
Financing live
Cash to close
- Down payment
- $41,250
- Closing costs
- $4,950
- Reserves months
- —
- Total cash needed
- —
Loan-product check · same deal, 3 products live
Conventional
25% down · 7.5% · 30yr
- Down + closing
- —
- Monthly P&I
- —
- Monthly cashflow
- —
- DSCR
- —
- Eligible?
- —
Personal DTI + credit; lowest rate.
DSCR
20% down · 8.5% · 30yr
- Down + closing
- —
- Monthly P&I
- —
- Monthly cashflow
- —
- DSCR
- —
- Eligible?
- —
No personal income docs; deal must DSCR.
Hard money
10% down · 12.0% · 12mo
- Down + closing
- —
- Monthly P&I
- —
- Monthly cashflow
- —
- DSCR
- —
- Eligible?
- —
Short-term bridge; refi at stabilization.
HOA detail
- Monthly dues
- $17 · $204/yr
Listing history 18 events
-
2026-06-19days on market $165,000 Active 136 DOM
-
2026-06-18days on market $165,000 Active 135 DOM
-
2026-06-17days on market $165,000 Active 134 DOM
-
2026-06-16days on market $165,000 Active 133 DOM
-
2026-06-15days on market $165,000 Active 132 DOM
-
2026-06-14days on market $165,000 Active 130 DOM
-
2026-06-12pricedays on market $165,000 Active 129 DOM
-
2026-06-09days on market $179,000 Active 126 DOM
-
2026-06-08days on market $179,000 Active 125 DOM
-
2026-06-07days on market $179,000 Active 124 DOM
-
2026-06-05days on market $179,000 Active 121 DOM
-
2026-06-02days on market $179,000 Active 119 DOM
-
2026-06-01days on market $179,000 Active 118 DOM
-
2026-05-31days on market $179,000 Active 117 DOM
-
2026-05-30days on market $179,000 Active 116 DOM
-
2026-03-31price $179,000
-
2026-03-10price $193,000
-
2026-02-02$199,999 Active
ⓘ Source: listings_history table (triggers on properties + properties_extension) + one-shot
backfill from property_details.listing_events for pre-trigger history.
Tax reassessment forecast OK · Resets to sale price
- Current annual tax
- $361 · $30/mo
- Projected year-2 tax
- $1,485 · $124/mo
- Expected delta
- +$1,124/yr (+$94/mo · 311.4%)
ⓘ Screening estimate from a state-policy table — verify with the county assessor before closing.
Climate risk First Street
- Flood 5/10 Major FEMA zone X (unshaded) · 65% chance over 30 yrs
- Wildfire 5/10 Major
- Heat 5/10 Major 7 d/yr ≥108°F today · 18 d/yr by 30 yrs out
- Wind 2/10 Low 4% chance of damaging wind over 30 yrs
- Air quality 2/10 Low 1 unhealthy d/yr today · 1 by 30 yrs out
Nearby sold comps map
Loading sold comps map…
Walkable amenities ~0.75 mi
Loading nearby amenities…
Taxation est. · year 1
- Rental income
- $23,208
- − Mortgage interest
- −$9,243
- − Property taxes
- −$361
- − Insurance
- −$825
- − Repairs & maintenance
- −$1,857
- − Management
- −$1,857
- − HOA
- −$204
- − Depreciation
- −$4,800
- Taxable income
- $4,063
- Est. tax owed @ 24.0%
- −$975
- After-tax cash flow
- $5,586/yr
For passive investors: Depreciation is non-cash, so a rental often shows a tax loss while cash-flowing — sheltering income. Rental losses are passive: they offset passive income freely, and up to $25,000/yr can offset ordinary (W-2) income if you actively participate and your MAGI is under $100k (phasing out to $0 by $150k); unused losses carry forward. On sale, claimed depreciation is recaptured at up to 25%, and gains may owe capital-gains tax (a 1031 exchange can defer both). Figures are a year-1 estimate at your 24.0% rate — not tax advice; consult a CPA.
Schools (NCES district)
- District
- Mcloud
- NCES district ID
- 4019560
- Math proficiency
- 13% ▼ -12.00%
- Reading proficiency
- 19% ▼ -13.00%
- Median HH income
- $51,519
- Composite
- 14.72/100
- National rank
- #9398
- State rank
- #201 of 270 in OK
Livability — Norman
- Score
- 85/100
- State rank
- #1
- US rank
- #557
Category grades
Schools grade is shown separately in the Schools card above.
Census & demographics
- Census place
- Norman, OK
- City population
- 123,141
- Population (ZIP)
- 9,902
Population outlook (Cleveland County) Hauer SSP2
- Today (2025)
- 323,621 people
- By 2030
- 349,070 · +7.9%
- By 2040
- 400,168 · +23.7%
- By 2050
- 454,101 · +40.3%
- By 2075
- 602,926 · +86.3%
- By 2100
- 734,485 · +127.0%
Race, ethnicity, and origin ACS 2023
- Neighborhood character
- Predominantly White (79%)
- Race & ethnicity
- White 79% Two or more races 9% Native American 8% Hispanic / Latino 4% Black 2%
- Common ancestry
- Slovak 2% Iranian 2% Romanian 1%
- Foreign-born
- 1% · Canada
- Languages at home
- 96% English-only · Spanish 3%
Political lean MEDSL · Cleveland
- 2024 margin
- R (+14.9) · D 41.4% · R 56.4% · Other 2.2%
- 2008→2024 swing
- +9.1pp toward D · 2008: -24.0pp · 2024: -14.9pp
- All cycles
- 2024: R+14.9 2020: R+14.1 2016: R+21.7 2012: R+25.9 2008: R+24.0
Not yet ingested
- Civics
- —
Market trends
- HPI YoY
- ▼ -33.83%
- Current HPI
- 284.6727
- Rent YoY
- —
- Metro
- —
- State GDP YoY
- ▲ 1.55%
- F500 in state
- 6
Industry mix (Fortune 500 HQ in OK)
| Industry | F500 HQs | Revenue |
|---|---|---|
| Energy | 3 | $48B |
|
||
Price history
-10.5% since first listed3 events — show timeline
- 2026-03-31 Price Changed $179,000 MLSOK
- 2026-03-10 Price Changed $193,000 MLSOK
- 2026-02-02 Listed $199,999 MLSOK
Property tax history
+3.9%/yrLatest (2024): $361 · +5.9% YoY. Source: county tax records.
Cash-flow waterfall
monthlySold comps — $/sqft
last 12 mo · ≤1 miLoading sold comps…