 🏗️ New Construction
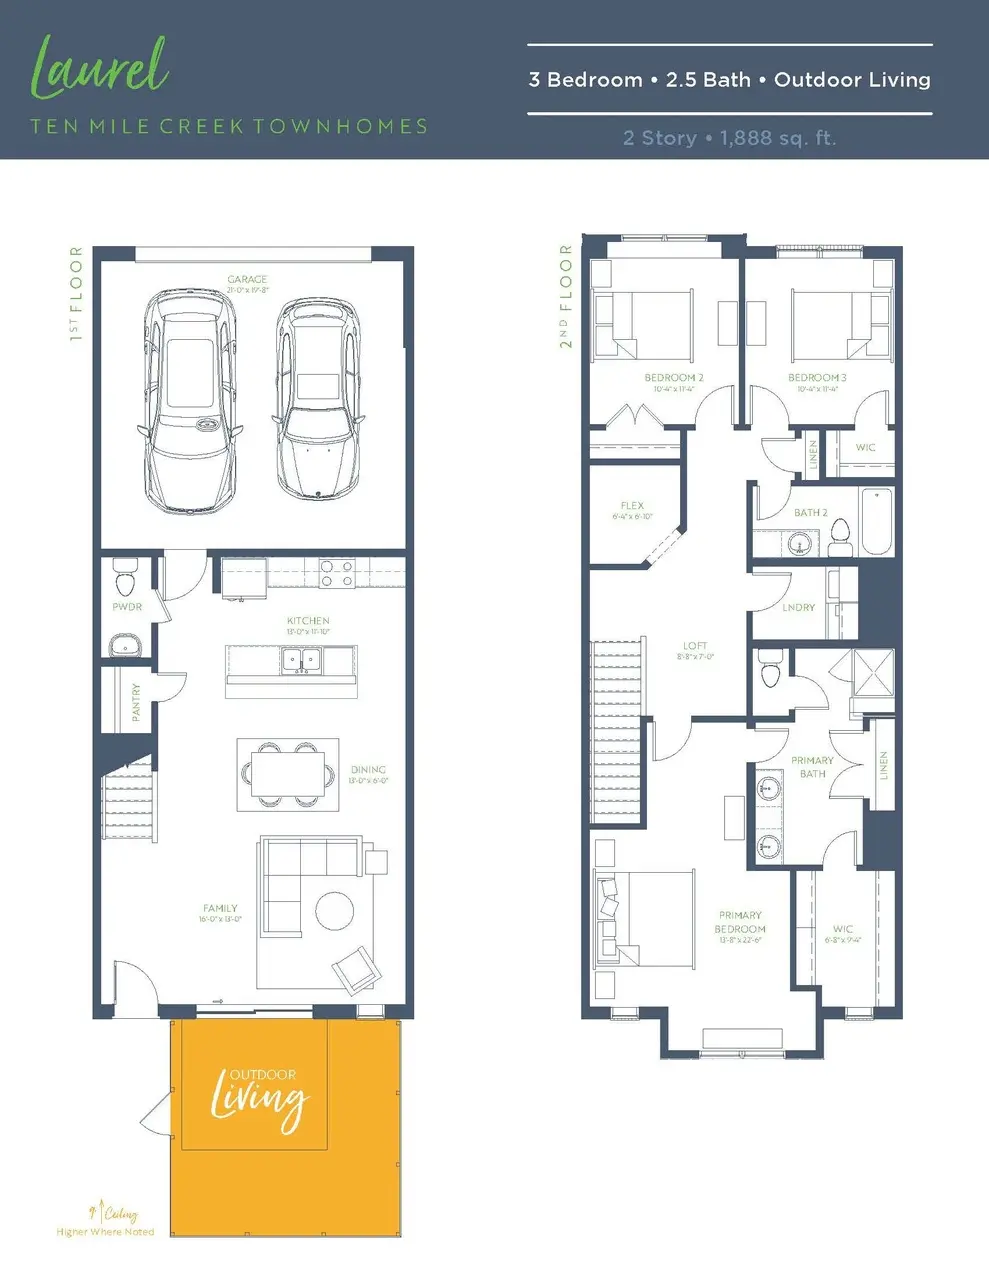
Laurel Plan · Celina, TX
Flood risk No data
- FEMA flood zone
- —
- Chance of flooding over 30 yrs
- —
- Est. flood insurance / yr
- —
Fire risk No data
- Est. fire insurance / yr
- —
Heat risk No data
- Hot days now (above threshold)
- —
- Hot days in 30 yrs
- —
Wind risk No data
- Chance of severe wind over 30 yrs
- —
Air-quality risk No data
- Unhealthy air days now
- —
- Unhealthy air days in 30 yrs
- —
Risk factors via First Street. Map © Google.
Why this score? — see what drove the D- grade
The composite is a weighted blend of 9 inputs, each scored 0–100. Each bar is that input's sub-score; the figure is the points it added to the 100-point composite (weight × sub-score).
- Cash flow +10.8/30.0
- ARV discount +7.5/15.0
- Schools +5.0/10.0
- Livability +3.4/5.0
- 1% rule +3.2/10.0
- DSCR +3.1/10.0
- Rent growth +1.3/5.0
- Condition / age +1.0/5.0
- Appreciation +0.0/10.0
$339,900
🖨 Deal sheet (PDF) 📄 Offer letter ✓ Due diligence
Listing remarks MLS
Three bedroom Townhome with a tasteful sloped ceiling in the Primary bedroom and upstairs flex space
Key facts
- Upstairs flex space
- Sloped ceiling
- 2 parking spots
Tags
Neighborhood map
What this means for you Summary
Snapshot
- This is a 3-bed/2.5-bath townhouse listed at $340k. Condition is rated poor.
Deal economics
- At list price, monthly cash flow is $-164 ($-2k/yr) — negative.
- To cash-flow at today's rent, offer at most $339k (0.3% below list).
- To meet the 1% rule (rent ≥ 1% of price), the offer needs to be $296k (12.8% below list).
- Recommended offer: $296k (12.8% below list) — sets the bar for 1% rule.
- Cap rate 5.8% vs local median 2.8% in Celina — top-decile yield for the area; either an underpriced asset or a hidden risk that comps aren't pricing in. Stress-test before assuming the spread holds.
Location & tenants
- Location reads 68/100 on livability (#450 in TX) — a middle-class / working-renter tenant base. Strengths: employment A+, housing A+, crime A; Watch: cost of living C-, amenities F, commute F.
- Celina ISD (rural): math 50% / reading 61% proficiency, ranked #71 of 826 in TX (top 9%) — acceptable for families but not a draw, mixed tenant base, ~2y average lease.
- Zoned schools: Marcy B Lykins El (math 38% / reading 50%, grade F, #1,243 of 4,322 statewide, top 29%, 708 students, 22% FRL); Jerry & Linda Moore Middle (math 56% / reading 60%, grade B, #197 of 1,662 statewide, top 12%, 903 students, 20% FRL); Celina H S (math 44% / reading 72%, grade C, #320 of 1,632 statewide, top 20%, 1,074 students, 18% FRL).
- Market conditions: Rents falling (-4.6%/yr); 2927 active listings in the ZIP; 12 comparable units currently listed for rent nearby; rentals at typical pace (median 26d on market — plan ~3-4 weeks tenant-placement turnaround); 42% of comp listings sitting > 30 days — soft ceiling on asking rent; high-income renter base; 19,194 units permitted in Collin County in 2024 (3,988 in 5+ unit buildings).
Forward outlook
- Local home prices are declining (-3.0%/yr); year-one equity from $3k of loan paydown is wiped out by about $11k of value loss. Plan a longer hold.
- Collin County population projected at +60% by 2050 — long-run rental-demand tailwind backs the buy-and-hold thesis.
Negotiation context
- It's been on market 428 days — a 12% lower offer ($299k) is reasonable based on typical stale-listing flexibility.
- 2 sale attempts; this cycle's ask has dropped $37k (10%) from the opening price — seller is motivated, your offer sets the floor, not the list.
Questions for the listing agent
- What do current leases actually rent for vs. the listed asking? Can we see a recent rent roll and the last 12 months of T-12 income?
- It's been on market 428 days. Have you received any prior offers? Is the seller open to a 13% concession, seller financing, or rate buy-down credit?
- Have any recent inspections been done? Can we get a copy of the seller's disclosures and any deferred-maintenance estimates?
- Why hasn't it sold? Are there any deal-killer items the seller is aware of (foundation, flood, title, zoning, code violations)?
- Is there a deadline driving the sale (1031 exchange, divorce, estate, relocation)? That informs how much negotiation room exists.
- Schools are A-rated — typically a magnet for longer-tenancy family renters. What's the average tenant stay here, and is there a school-zone premium baked into asking?
- The area grade is low — what's the realistic commute time and amenity access for the typical tenant pool here? Any planned neighborhood developments (good or bad) we should know about?
- What's the average days-on-market for RENTAL listings here right now (not sales)? A rising rental-DOM trend means longer vacancies and softer asking-rent achievability than the comps imply.
- What's the recent tenant-quality profile in this submarket — average credit score on applications, eviction rate, late-payment / NSF rate, and stable-employment percentage? A property-management company in the area should have these aggregated.
- How much new for-sale + rental construction is in the pipeline within 1–3 miles? Heavy new supply typically softens prices + rents 12–24 months out; constrained supply supports both.
Investment metrics
- 1% rule
- 0.82% ✗
- Cap rate
- 5.75%
- Cash-on-cash
- -1.94%
- DSCR
- 0.91
- GRM
- 10.2
CMA / ARV
- ARV (median comp)
- $362,490
- List price
- $339,900
- Delta
- -6.23%
- Verdict
- FAIR
- Comps
- 6 within 1.0 mi
Show comp detail 6 sales within ~0.75 mi
| Address | Dist | Beds/Ba | Sqft | Sold | Price | $/sf | Match |
|---|---|---|---|---|---|---|---|
| 2009 Aldrich Mews | 0.02mi | 3/2.5 | 1,888 (0%) | 2mo | $354,990 | $188 | 97 |
| 2016 Aldrich Mews | 0.02mi | 3/2.5 | 1,865 (-1%) | 0mo | $369,990 | $198 | 97 |
| 2025 Aldrich Mews | 0.00mi | 3/2.5 | 1,888 (0%) | 5mo | $340,000 | $180 | 96 |
| 2005 Aldrich Mews | 0.03mi | 3/2.5 | 1,852 (-2%) | 1mo | $335,900 | $181 | 95 |
| 2000 Aldrich Mews | 0.04mi | 3/2.5 | 1,867 (-1%) | 8mo | $389,000 | $208 | 90 |
| 2021 Aldrich Mews | 0.01mi | 3/2.5 | 1,852 (-2%) | 12mo | $399,000 | $215 | 87 |
Match score weights: distance 35% · size 25% · config 20% · recency 20%. Top-matched comps best support the ARV.
Projected returns pro-forma
-3.0% appreciation · 0.0% rent growth · sell at horizon
- IRR
- -22.9%
- Equity multiple
- 0.23×
- Total profit
- $-77,811
- Equity at exit
- $54,048
- IRR
- -27.8%
- Equity multiple
- -0.13×
- Total profit
- $-114,573
- Equity at exit
- $31,342
Cash invested: $101,497 (down + closing). Projections, not guarantees.
Landlord ↔ Tenant lean methodology
- Overall (STATE)
- 87 Strongly Landlord-Friendly
- State Texas
- 87 Strongly Landlord-Friendly · R+5
- County
- — inherits STATE
- City
- — inherits STATE
ZIP-level market 75009
- Home prices YoY
- -23.1%
- Rents YoY
- -4.6%
- Active inventory
- 2927
- Price-to-rent
- 9.6×
Monthly cashflow live
- Estimated rent
- $2,964 high interval (Pro) →
- Mortgage (P&I)
- −$1,901
- Tax est. 1.5%
- −$453 /mo · $5,437/yr
- Insurance
- −$151
- HOA
- −$0
- Vacancy / Maint / Mgmt
- −$622
- Net cashflow
- $-164
Break-even live
Sensitivity live
| Price | -10% $87 | -5% $-39 | +0% $-164 | +5% $-289 | +10% $-414 |
|---|---|---|---|---|---|
| Rent | -10% $-398 | -5% $-281 | +0% $-164 | +5% $-47 | +10% $70 |
| Rate | -1.0pp $19 | -0.5pp $-72 | base $-164 | +0.5pp $-258 | +1.0pp $-353 |
UW: 25.0% down · 7.5% · 30yr · 1.5% tax · 5.0% vac · 8.0% maint · 8.0% mgmt
Financing live
Cash to close
- Down payment
- $90,622
- Closing costs
- $10,875
- Reserves months
- —
- Total cash needed
- —
Loan-product check · same deal, 3 products live
Conventional
25% down · 7.5% · 30yr
- Down + closing
- —
- Monthly P&I
- —
- Monthly cashflow
- —
- DSCR
- —
- Eligible?
- —
Personal DTI + credit; lowest rate.
DSCR
20% down · 8.5% · 30yr
- Down + closing
- —
- Monthly P&I
- —
- Monthly cashflow
- —
- DSCR
- —
- Eligible?
- —
No personal income docs; deal must DSCR.
Hard money
10% down · 12.0% · 12mo
- Down + closing
- —
- Monthly P&I
- —
- Monthly cashflow
- —
- DSCR
- —
- Eligible?
- —
Short-term bridge; refi at stabilization.
Rent comps 12 comps
| Address | Beds | Baths | Sqft | Rent | $/sqft | DOM | Units | Dist |
|---|---|---|---|---|---|---|---|---|
| 2009 Brookhurst St Celina, TX | 4.0 | 3.0 | 2386 | $2,895 | $1.21 | 20d | 1 | 0.73mi |
| 1513 Mill Creek Way Celina, TX | 1.0–4.0 | 1.0–3.0 | 1385 | $2,682 | $1.94 | 0d | 12 | 0.75mi |
| 1637 Palo Duro Way Celina, TX | 4.0 | 3.0 | 2545 | $5,800 | $2.28 | 0d | 1 | 0.81mi |
| 2706 Boca Dr Prosper, TX | 4.0 | 3.0 | 2102 | $3,445 | $1.64 | 45d | 1 | 0.85mi |
| 1356 Hill Country Pl Celina, TX | 3.0 | 2.5 | 1888 | $2,500 | $1.32 | 45d | 1 | 0.95mi |
| 1325 Choate Pkwy Celina, TX | 1.0–3.0 | 1.0–2.0 | 1000 | $1,893 | $1.89 | 0d | 61 | 0.97mi |
| 2522 Runhappy Ct Celina, TX | 4.0 | 3.0 | 2395 | $3,500 | $1.46 | 45d | 1 | 1.02mi |
| 2432 Preakness Pl Celina, TX | 4.0 | 3.0 | 2309 | $3,500 | $1.52 | 45d | 1 | 1.09mi |
| 2600 Kinship Pkwy Celina, TX | 1.0–3.0 | 1.0–2.0 | 1067 | $1,962 | $1.84 | 0d | 47 | 1.20mi |
| 3008 Evergreen Trl Celina, TX | 4.0 | 3.0 | 2503 | $2,695 | $1.08 | 14d | 1 | 1.30mi |
| 912 Slate Ln Celina, TX | 4.0 | 2.0 | 1879 | $2,690 | $1.43 | 45d | 1 | 1.39mi |
| 3138 Casa Blanca St Celina, TX | 4.0 | 2.5 | 2368 | $3,000 | $1.27 | 26d | 1 | 1.49mi |
Listing history 19 events
-
2026-06-21days on market $339,900 Active 428 DOM
-
2026-06-18days on market $339,900 Active 425 DOM
-
2026-06-17days on market $339,900 Active 424 DOM
-
2026-06-16days on market $339,900 Active 423 DOM
-
2026-06-15days on market $339,900 Active 422 DOM
-
2026-06-13days on market $339,900 Active 420 DOM
-
2026-06-09days on market $339,900 Active 416 DOM
-
2026-06-08days on market $339,900 Active 415 DOM
-
2026-06-07days on market $339,900 Active 414 DOM
-
2026-06-04days on market $339,900 Active 411 DOM
-
2026-06-03days on market $339,900 Active 410 DOM
-
2026-06-02days on market $339,900 Active 409 DOM
-
2026-06-01days on market $339,900 Active 408 DOM
-
2026-05-31days on market $339,900 Active 407 DOM
-
2026-05-01price $339,900 100-char remark
Show marketing remark (100 chars)
Three bedroom Townhome with a tasteful sloped ceiling in the Primary bedroom and upstairs flex space
-
2025-11-02status Active 100-char remark
Show marketing remark (100 chars)
Three bedroom Townhome with a tasteful sloped ceiling in the Primary bedroom and upstairs flex space
-
2025-11-02price $379,990 100-char remark
Show marketing remark (100 chars)
Three bedroom Townhome with a tasteful sloped ceiling in the Primary bedroom and upstairs flex space
-
2025-10-31historical 100-char remark
Show marketing remark (100 chars)
Three bedroom Townhome with a tasteful sloped ceiling in the Primary bedroom and upstairs flex space
-
2025-04-17$376,990 Active 100-char remark
Show marketing remark (100 chars)
Three bedroom Townhome with a tasteful sloped ceiling in the Primary bedroom and upstairs flex space
ⓘ Source: listings_history table (triggers on properties + properties_extension) + one-shot
backfill from property_details.listing_events for pre-trigger history.
Nearby sold comps map
Loading sold comps map…
Walkable amenities ~0.75 mi
Loading nearby amenities…
Taxation est. · year 1
- Rental income
- $35,564
- − Mortgage interest
- −$20,305
- − Property taxes
- −$5,437
- − Insurance
- −$1,812
- − Repairs & maintenance
- −$2,845
- − Management
- −$2,845
- − Depreciation
- −$10,545
- Taxable loss
- −$8,226
- Est. tax savings @ 24.0%
- +$1,974
- After-tax cash flow
- $9/yr
For passive investors: Depreciation is non-cash, so a rental often shows a tax loss while cash-flowing — sheltering income. Rental losses are passive: they offset passive income freely, and up to $25,000/yr can offset ordinary (W-2) income if you actively participate and your MAGI is under $100k (phasing out to $0 by $150k); unused losses carry forward. On sale, claimed depreciation is recaptured at up to 25%, and gains may owe capital-gains tax (a 1031 exchange can defer both). Figures are a year-1 estimate at your 24.0% rate — not tax advice; consult a CPA.
Condition & rehab AI · 0 photos
This townhouse requires extensive repairs and updates to bring it up to a good condition, significantly increasing its resale and rental value.
Repairs flagged
- Major kitchen appliances — Signs of wear and tear suggest major appliance replacement is needed.
- Major bathroom fixtures — Signs of wear and tear suggest major fixture replacement is needed.
- Major flooring — Signs of wear and tear suggest major flooring replacement is needed.
- Major paint — Signs of wear and tear suggest major paint job is needed.
- Major siding — Signs of wear and tear suggest major siding replacement is needed.
- Major windows — Signs of wear and tear suggest major window replacement is needed.
- Major HVAC system — Signs of wear and tear suggest major HVAC system replacement is needed.
Value-add opportunities
- Resale kitchen appliances — Up-to-date appliances will attract more buyers and increase the home's appeal.
- Resale bathroom fixtures — Modern fixtures will attract more buyers and increase the home's appeal.
- Resale flooring — New flooring will improve the home's appearance and increase its value.
- Resale paint — Fresh paint will improve the home's appearance and increase its value.
- Resale siding — New siding will improve the home's appearance and increase its value.
- Resale windows — New windows will improve the home's appearance and increase its value.
- Resale HVAC system — A new HVAC system will improve the home's comfort and increase its value.
Renovation cost estimate screening
| Repair item | Severity | Est. cost |
|---|---|---|
| kitchen appliances · Signs of wear and tear suggest major appliance replacement is needed. | Major | $15,000–50,000 |
| bathroom fixtures · Signs of wear and tear suggest major fixture replacement is needed. | Major | $15,000–50,000 |
| flooring · Signs of wear and tear suggest major flooring replacement is needed. | Major | $15,000–50,000 |
| paint · Signs of wear and tear suggest major paint job is needed. | Major | $15,000–50,000 |
| siding · Signs of wear and tear suggest major siding replacement is needed. | Major | $15,000–50,000 |
| windows · Signs of wear and tear suggest major window replacement is needed. | Major | $15,000–50,000 |
| HVAC system · Signs of wear and tear suggest major HVAC system replacement is needed. | Major | $15,000–50,000 |
| Total estimated repair cost · 7 items | $105,000–350,000 |
Value-add ROI direction
- Resale kitchen appliances — Up-to-date appliances will attract more buyers and increase the home's appeal. ↑
- Resale bathroom fixtures — Modern fixtures will attract more buyers and increase the home's appeal. ↑
- Resale flooring — New flooring will improve the home's appearance and increase its value. ↑
- Resale paint — Fresh paint will improve the home's appearance and increase its value. ↑
- Resale siding — New siding will improve the home's appearance and increase its value. ↑
- Resale windows — New windows will improve the home's appearance and increase its value. ↑
- Resale HVAC system — A new HVAC system will improve the home's comfort and increase its value. ↑
ⓘ Cost ranges are severity-bucket heuristics (US national rule-of-thumb). Get contractor quotes + a written scope before underwriting a rehab budget.
Schools (NCES district)
- District
- Celina ISD
- NCES district ID
- 4813290
- Math proficiency
- 50% ▼ -15.00%
- Reading proficiency
- 61% ▼ -5.00%
- Median HH income
- $83,282
- Composite
- 50.49/100
- National rank
- #1853
- State rank
- #71 of 826 in TX
Livability — Celina
- Score
- 68/100
- State rank
- #450
- US rank
- #9135
Category grades
Schools grade is shown separately in the Schools card above.
Census & demographics
- County
- Collin County · 1,159,394 people
- City population
- 34,260
- Metro
- Dallas-Fort Worth-Arlington, TX
- Population (ZIP)
- 34,260
- Household income
- $168,250
- Rent vs Own
- Severe rent burden
- 152.0
Population outlook (Collin County) Hauer SSP2
- Today (2025)
- 1,210,074 people
- By 2030
- 1,358,201 · +12.2%
- By 2040
- 1,654,061 · +36.7%
- By 2050
- 1,937,359 · +60.1%
- By 2075
- 2,567,039 · +112.1%
- By 2100
- 2,952,048 · +144.0%
Race, ethnicity, and origin ACS 2023
- Neighborhood character
- Diverse neighborhood (Simpson 0.56)
- Race & ethnicity
- White 64% Two or more races 11% Hispanic / Latino 11% Asian 11% Black 8%
- Hispanic origin (detail)
- Mexican 9%
- Common ancestry
- Slovak 5% Lithuanian 4% Romanian 1%
- Foreign-born
- 14% · China, Canada, Vietnam
- Languages at home
- 83% English-only · Spanish 6% Chinese 3% Other Asian/Pacific 3%
Political lean MEDSL · Collin
- 2024 margin
- R (+11.1) · D 43.1% · R 54.3% · Other 2.6%
- 2008→2024 swing
- +14.4pp toward D · 2008: -25.6pp · 2024: -11.1pp
- All cycles
- 2024: R+11.1 2020: R+4.3 2016: R+17.0 2012: R+31.6 2008: R+25.6
Not yet ingested
- Civics
- —
Market trends
- HPI YoY
- ▼ -83.07%
- Current HPI
- 276.6307
- Rent YoY
- ▼ -4.62%
- Metro
- Dallas-Fort Worth-Arlington, TX
- State GDP YoY
- ▲ 3.95%
- F500 in state
- 110
Industry mix (Fortune 500 HQ in TX)
| Industry | F500 HQs | Revenue |
|---|---|---|
| Energy | 16 | $1,198B |
|
||
| Technology | 5 | $198B |
|
||
| Engineering / Construction | 4 | $72B |
|
||
| Energy Services | 3 | $60B |
|
||
| Utilities | 3 | $41B |
|
||
| Healthcare | 2 | $330B |
|
||
Price history
-9.8% since first listed5 events — show timeline
- 2026-05-01 Price Changed $339,900 Zillow
- 2025-11-02 Price Changed $379,990 Zillow
- 2025-11-02 Relisted — Zillow
- 2025-10-31 Delisted — Zillow
- 2025-04-17 Listed $376,990 Zillow
Cash-flow waterfall
monthlySold comps — $/sqft
last 12 mo · ≤1 miLoading sold comps…