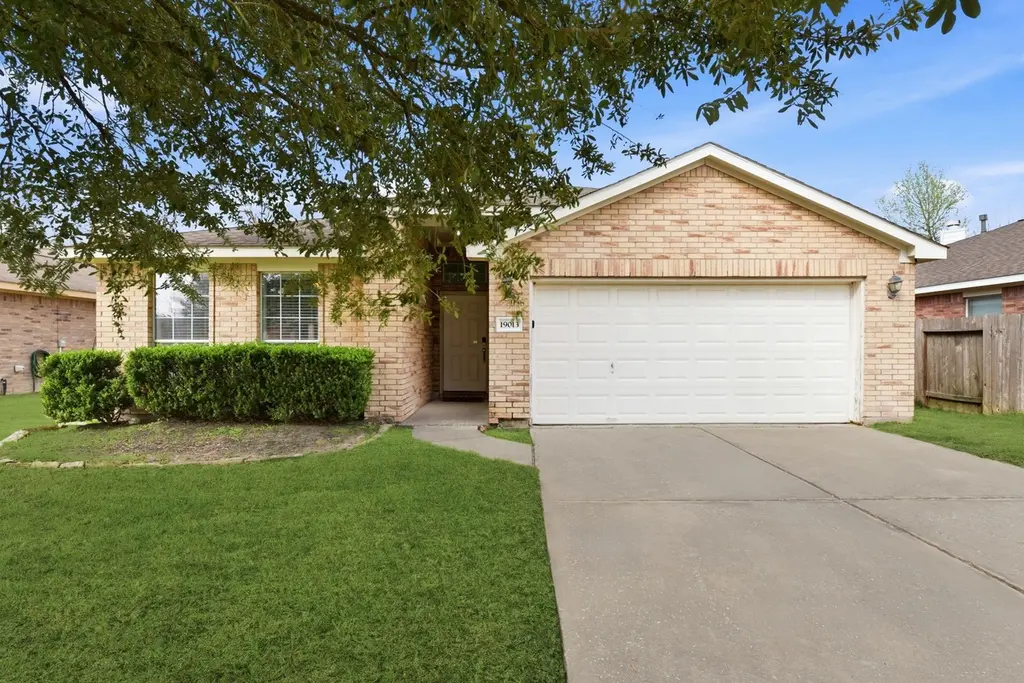
19013 Hammer Ln · Porter Heights, TX
Flood risk 7/10 · Major
- FEMA flood zone
- X (unshaded)
- Chance of flooding over 30 yrs
- 0.99%
- Est. flood insurance / yr
- $507 – $1,088
Fire risk 5/10 · Moderate
- Est. fire insurance / yr
- $1,222 – $2,270
Heat risk 9/10 · Severe
- Hot days now (above 110°F)
- 7 days/yr
- Hot days in 30 yrs
- 25 days/yr
Wind risk 8/10 · Major
- Chance of severe wind over 30 yrs
- 99.0%
Air-quality risk 3/10 · Minor
- Unhealthy air days now
- 3 days/yr
- Unhealthy air days in 30 yrs
- 3 days/yr
Risk factors via First Street. Map © Google.
Why this score? — see what drove the D grade
The composite is a weighted blend of 9 inputs, each scored 0–100. Each bar is that input's sub-score; the figure is the points it added to the 100-point composite (weight × sub-score).
- Cash flow +14.6/30.0
- ARV discount +8.0/15.0
- 1% rule +4.7/10.0
- DSCR +4.5/10.0
- Livability +3.2/5.0
- Rent growth +2.9/5.0
- Schools +2.8/10.0
- Condition / age +2.5/5.0
- Appreciation +0.0/10.0
$249,999
🖨 Deal sheet (PDF) 📄 Offer letter ✓ Due diligence
Listing remarks MLS
Well-maintained 4-bedroom, 2-bath home with a two-car garage and inviting curb appeal. The open-concept family and dining areas with beautiful fireplace offer a functional layout ideal for both everyday living and entertaining. The kitchen features granite countertops, a large pantry, and generous storage throughout the home. With four bedrooms, there’s flexibility for a growing household, guest space, or a dedicated home office for those who work remotely. Enjoy the fully fenced backyard and a beautiful mature tree in the front yard that provides ample shade and charm. Conveniently located near major highways for an easy commute. Move-in ready and waiting for its next owner. Schedule your showing today!
Key facts
- Mature tree
- Generous storage
- Large pantry
Tags
Neighborhood map
What this means for you Summary
Snapshot
- This is a 4-bed/2.0-bath single-family listed at $250k.
Deal economics
- At list price, monthly cash flow is $-5 ($-58/yr) — negative.
- To cash-flow at today's rent, offer at most $249k (0.3% below list).
- To meet the 1% rule (rent ≥ 1% of price), the offer needs to be $241k (3.5% below list).
- Recommended offer: $227k (9.0% below list) — sets the bar for market timing.
- Cap rate 6.6% vs local median 2.5% in Porter Heights — top-decile yield for the area; either an underpriced asset or a hidden risk that comps aren't pricing in. Stress-test before assuming the spread holds.
Location & tenants
- Location reads 65/100 on livability (#663 in TX) — a middle-class / working-renter tenant base. Strengths: crime A+, employment A+, cost of living A+; Watch: amenities F, commute F, health & safety F.
- New Caney ISD (suburban): math 31% / reading 32% proficiency, ranked #570 of 826 in TX (top 69%) — families likely to look elsewhere, expect single-tenant / working-renter base with shorter leases.
- Zoned schools: New Caney H S (math 24% / reading 31%, grade F, #1,183 of 1,632 statewide, top 73%, 2,428 students, 78% FRL) — zoned schools average 78% FRL vs 57% district-wide (21 pts higher); higher-poverty schools than district average — tighter screening recommended.
- Market conditions: Rents rising (+1.6%/yr); 955 active listings in the ZIP; 2 comparable units currently listed for rent nearby; solid renter incomes; 13,259 units permitted in Montgomery County in 2024 (1,402 in 5+ unit buildings).
- This rent runs 30% of the median local income ($96k/yr) — at the standard rent-burdened threshold; future hikes will face affordability resistance.
Forward outlook
- Local home prices are declining (-3.0%/yr); year-one equity from $2k of loan paydown is wiped out by about $8k of value loss. Plan a longer hold.
- Montgomery County population projected at +65% by 2050 — long-run rental-demand tailwind backs the buy-and-hold thesis.
Negotiation context
- It's been on market 112 days — a 9% lower offer ($227k) is reasonable based on typical stale-listing flexibility.
- 3 sale attempts since 19y ago with the ask held roughly flat each time — persistent listings suggest the price (not the market) is what's stuck; bring a comps-based counter.
Risks & watch-outs
- Watch-outs: flood insurance adds $66/mo.
- Climate carrying-cost: major flood risk; severe wind risk, 99% chance of damaging wind over 30y; moderate wildfire risk; extreme-heat days projected 7→25/yr by 2055 (HVAC capex compounding) — expect insurance premiums to compound above CPI over the hold.
Questions for the listing agent
- What do current leases actually rent for vs. the listed asking? Can we see a recent rent roll and the last 12 months of T-12 income?
- It's been on market 112 days. Have you received any prior offers? Is the seller open to a 9% concession, seller financing, or rate buy-down credit?
- What's the actual annual flood-insurance premium (NFIP or private), and is the property in a SFHA with mandatory coverage?
- What does the HOA fee cover, when was the last increase, and are there any pending special assessments or reserve-fund shortfalls?
- Why hasn't it sold? Are there any deal-killer items the seller is aware of (foundation, flood, title, zoning, code violations)?
- Is there a deadline driving the sale (1031 exchange, divorce, estate, relocation)? That informs how much negotiation room exists.
- Schools are F-rated, which usually means shorter tenancies and higher turnover. Who's the typical renter profile here, and what's been the actual vacancy rate?
- The area grade is low — what's the realistic commute time and amenity access for the typical tenant pool here? Any planned neighborhood developments (good or bad) we should know about?
- What's the average days-on-market for RENTAL listings here right now (not sales)? A rising rental-DOM trend means longer vacancies and softer asking-rent achievability than the comps imply.
- What's the recent tenant-quality profile in this submarket — average credit score on applications, eviction rate, late-payment / NSF rate, and stable-employment percentage? A property-management company in the area should have these aggregated.
- How much new for-sale + rental construction is in the pipeline within 1–3 miles? Heavy new supply typically softens prices + rents 12–24 months out; constrained supply supports both.
Investment metrics
- 1% rule
- 0.97% ✗
- Cap rate
- 6.59%
- Cash-on-cash
- 1.06%
- DSCR
- 1.05
- GRM
- 8.6
CMA / ARV
- ARV (median comp)
- $252,789
- List price
- $249,999
- Delta
- -1.10%
- Verdict
- FAIR
- Comps
- 20 within 1.0 mi
Show comp detail 12 sales within ~0.75 mi
| Address | Dist | Beds/Ba | Sqft | Sold | Price | $/sf | Match |
|---|---|---|---|---|---|---|---|
| 21608 Anvil Ln | 0.06mi | 3/2.0 (-1) | 1,690 (-1%) | 4mo | $235,000 | $139 | 87 |
| 21689 Holly Leaf Ct | 0.33mi | 4/2.0 | 1,720 (+1%) | 2mo | $278,999 | $162 | 81 |
| 21622 Messara Ct | 0.33mi | 4/2.0 | 1,787 (+5%) | 1mo | $239,900 | $134 | 76 |
| 19134 Painted Blvd | 0.28mi | 3/3.0 (-1) | 1,747 (+3%) | 2mo | $239,900 | $137 | 71 |
| 21601 Twitch Ct | 0.31mi | 3/2.0 (-1) | 1,718 (+1%) | 10mo | $243,000 | $141 | 70 |
| 19051 Painted Blvd | 0.13mi | 3/2.0 (-1) | 1,801 (+6%) | 11mo | $245,000 | $136 | 70 |
| 19246 Silver Dapple Dr | 0.45mi | 3/2.0 (-1) | 1,623 (-4%) | 2mo | $240,000 | $148 | 65 |
| 21106 Ferne Leaf Dr | 0.53mi | 3/2.0 (-1) | 1,671 (-2%) | 7mo | $255,000 | $153 | 61 |
| 18178 Woodsdale Ct | 0.74mi | 4/2.5 | 1,784 (+5%) | 4mo | $220,000 | $123 | 52 |
| 19191 Shire Horse Blvd | 0.42mi | 4/2.5 | 1,896 (+12%) | 13mo | $264,900 | $140 | 48 |
| 18422 Hollow Oaks Cir | 0.60mi | 3/2.5 (-1) | 1,608 (-5%) | 11mo | $209,990 | $131 | 47 |
| 18468 Misty Wood Ln | 0.59mi | 3/2.0 (-1) | 1,518 (-11%) | 4mo | $222,000 | $146 | 47 |
Match score weights: distance 35% · size 25% · config 20% · recency 20%. Top-matched comps best support the ARV.
Projected returns pro-forma
-3.0% appreciation · 1.65% rent growth · sell at horizon
- IRR
- -18.1%
- Equity multiple
- 0.37×
- Total profit
- $-43,905
- Equity at exit
- $37,276
- IRR
- -13.3%
- Equity multiple
- 0.27×
- Total profit
- $-50,943
- Equity at exit
- $21,615
Cash invested: $70,000 (down + closing). Projections, not guarantees.
Landlord ↔ Tenant lean methodology
- Overall (STATE)
- 87 Strongly Landlord-Friendly
- State Texas
- 87 Strongly Landlord-Friendly · R+5
- County
- — inherits STATE
- City
- — inherits STATE
ZIP-level market 77365
- Home prices YoY
- -33.0%
- Rents YoY
- 1.6%
- Active inventory
- 955
- Price-to-rent
- 8.6×
Monthly cashflow live
- Estimated rent
- $2,414 medium interval (Pro) →
- Mortgage (P&I)
- −$1,311
- Tax from tax record
- −$392 /mo · $4,704/yr
- Insurance
- −$104
- Flood insurance flood zone
- −$66 /mo · $798/yr
- HOA
- −$38
- Vacancy / Maint / Mgmt
- −$507
- Net cashflow
- $-5
Break-even live
Sensitivity live
| Price | -10% $137 | -5% $66 | +0% $-5 | +5% $-76 | +10% $-146 |
|---|---|---|---|---|---|
| Rent | -10% $-196 | -5% $-100 | +0% $-5 | +5% $90 | +10% $186 |
| Rate | -1.0pp $121 | -0.5pp $59 | base $-5 | +0.5pp $-70 | +1.0pp $-136 |
UW: 25.0% down · 7.5% · 30yr · 1.5% tax · 5.0% vac · 8.0% maint · 8.0% mgmt
Financing live
Cash to close
- Down payment
- $62,500
- Closing costs
- $7,500
- Reserves months
- —
- Total cash needed
- —
Loan-product check · same deal, 3 products live
Conventional
25% down · 7.5% · 30yr
- Down + closing
- —
- Monthly P&I
- —
- Monthly cashflow
- —
- DSCR
- —
- Eligible?
- —
Personal DTI + credit; lowest rate.
DSCR
20% down · 8.5% · 30yr
- Down + closing
- —
- Monthly P&I
- —
- Monthly cashflow
- —
- DSCR
- —
- Eligible?
- —
No personal income docs; deal must DSCR.
Hard money
10% down · 12.0% · 12mo
- Down + closing
- —
- Monthly P&I
- —
- Monthly cashflow
- —
- DSCR
- —
- Eligible?
- —
Short-term bridge; refi at stabilization.
Rent comps 2 comps
| Address | Beds | Baths | Sqft | Rent | $/sqft | DOM | Units | Dist |
|---|---|---|---|---|---|---|---|---|
| 21625 Hackamore Ct Porter, TX | 3.0 | 2.0 | 1758 | $2,070 | $1.18 | 1d | 1 | 0.27mi |
| 18167 Woodsdale Ct Porter, TX | 4.0 | 2.5 | 1608 | $1,769 | $1.10 | 5d | 1 | 0.71mi |
HOA detail
- Monthly dues
- $38 · $456/yr
Listing history 23 events
-
2026-06-21pricedays on market $249,999 Active 112 DOM
-
2026-06-18days on market $254,990 Active 109 DOM
-
2026-06-17days on market $254,990 Active 108 DOM
-
2026-06-16days on market $254,990 Active 107 DOM
-
2026-06-15days on market $254,990 Active 106 DOM
-
2026-06-13days on market $254,990 Active 104 DOM
-
2026-06-10days on market $254,990 Active 100 DOM
-
2026-06-08days on market $254,990 Active 99 DOM
-
2026-06-07days on market $254,990 Active 98 DOM
-
2026-06-04days on market $254,990 Active 95 DOM
-
2026-06-03days on market $254,990 Active 94 DOM
-
2026-06-02days on market $254,990 Active 93 DOM
-
2026-06-01days on market $254,990 Active 92 DOM
-
2026-05-31days on market $254,990 Active 91 DOM
-
2026-04-23price $254,990 723-char remark
Show marketing remark (723 chars)
Well-maintained 4-bedroom, 2-bath home with a two-car garage and inviting curb appeal. The open-concept family and dining areas with beautiful fireplace offer a functional layout ideal for both everyday living and entertaining. The kitchen features granite countertops, a large pantry, and generous storage throughout the home. With four bedrooms, there’s flexibility for a growing household, guest space, or a dedicated home office for those who work remotely. Enjoy the fully fenced backyard and a beautiful mature tree in the front yard that provides ample shade and charm. Conveniently located near major highways for an easy commute. Move-in ready and waiting for its next owner. Schedule your showing today!
-
2026-03-01$259,900 Active 723-char remark
Show marketing remark (723 chars)
Well-maintained 4-bedroom, 2-bath home with a two-car garage and inviting curb appeal. The open-concept family and dining areas with beautiful fireplace offer a functional layout ideal for both everyday living and entertaining. The kitchen features granite countertops, a large pantry, and generous storage throughout the home. With four bedrooms, there’s flexibility for a growing household, guest space, or a dedicated home office for those who work remotely. Enjoy the fully fenced backyard and a beautiful mature tree in the front yard that provides ample shade and charm. Conveniently located near major highways for an easy commute. Move-in ready and waiting for its next owner. Schedule your showing today!
-
2023-05-16soldstatus
-
2023-05-12soldstatus Sold 138-char remark
Show marketing remark (138 chars)
Four bedroom, two bath, with a two-car garage. Open concept family room and dining room. Granite countertops in the kitchen and bathrooms.
-
2023-02-16status Pending 138-char remark
Show marketing remark (138 chars)
Four bedroom, two bath, with a two-car garage. Open concept family room and dining room. Granite countertops in the kitchen and bathrooms.
-
2023-02-13price $234,900 138-char remark
Show marketing remark (138 chars)
Four bedroom, two bath, with a two-car garage. Open concept family room and dining room. Granite countertops in the kitchen and bathrooms.
-
2022-12-05$244,900 Active 138-char remark
Show marketing remark (138 chars)
Four bedroom, two bath, with a two-car garage. Open concept family room and dining room. Granite countertops in the kitchen and bathrooms.
-
2008-04-30historical
-
2007-10-11$139,000
ⓘ Source: listings_history table (triggers on properties + properties_extension) + one-shot
backfill from property_details.listing_events for pre-trigger history.
Tax reassessment forecast TX · Resets to sale price
- Current annual tax
- $4,704 · $392/mo
- Projected year-2 tax
- $4,704 · $392/mo
- Expected delta
- $0/yr ($0/mo · 0.0%)
ⓘ Screening estimate from a state-policy table — verify with the county assessor before closing.
Climate risk First Street
- Flood 7/10 Severe FEMA zone X (unshaded) · 99% chance over 30 yrs
- Wildfire 5/10 Major
- Heat 9/10 Extreme 7 d/yr ≥110°F today · 25 d/yr by 30 yrs out
- Wind 8/10 Severe 99% chance of damaging wind over 30 yrs
- Air quality 3/10 Moderate 3 unhealthy d/yr today · 3 by 30 yrs out
Nearby sold comps map
Loading sold comps map…
Walkable amenities ~0.75 mi
Loading nearby amenities…
Taxation est. · year 1
- Rental income
- $28,965
- − Mortgage interest
- −$14,004
- − Property taxes
- −$4,704
- − Insurance
- −$2,047
- − Repairs & maintenance
- −$2,317
- − Management
- −$2,317
- − HOA
- −$456
- − Depreciation
- −$7,273
- Taxable loss
- −$4,154
- Est. tax savings @ 24.0%
- +$997
- After-tax cash flow
- $939/yr
For passive investors: Depreciation is non-cash, so a rental often shows a tax loss while cash-flowing — sheltering income. Rental losses are passive: they offset passive income freely, and up to $25,000/yr can offset ordinary (W-2) income if you actively participate and your MAGI is under $100k (phasing out to $0 by $150k); unused losses carry forward. On sale, claimed depreciation is recaptured at up to 25%, and gains may owe capital-gains tax (a 1031 exchange can defer both). Figures are a year-1 estimate at your 24.0% rate — not tax advice; consult a CPA.
Schools (NCES district)
- District
- New Caney ISD
- NCES district ID
- 4832400
- Math proficiency
- 31% ▼ -16.00%
- Reading proficiency
- 32% ▼ -6.00%
- Median HH income
- $55,380
- Composite
- 27.97/100
- National rank
- #6857
- State rank
- #570 of 826 in TX
Livability — Porter Heights
- Score
- 65/100
- State rank
- #663
- US rank
- #12479
Category grades
Schools grade is shown separately in the Schools card above.
Census & demographics
- County
- Montgomery County · 663,713 people
- Metro
- Houston-The Woodlands-Sugar Land, TX
- Population (ZIP)
- 46,418
- Household income
- $95,702
- Rent vs Own
- Severe rent burden
- 1016.0
Population outlook (Montgomery County) Hauer SSP2
- Today (2025)
- 713,896 people
- By 2030
- 805,263 · +12.8%
- By 2040
- 992,708 · +39.1%
- By 2050
- 1,179,590 · +65.2%
- By 2075
- 1,628,084 · +128.1%
- By 2100
- 1,937,880 · +171.5%
Race, ethnicity, and origin ACS 2023
- Neighborhood character
- Diverse neighborhood (Simpson 0.59)
- Race & ethnicity
- Hispanic / Latino 46% White 44% Two or more races 15% Black 5% Asian 3%
- Hispanic origin (detail)
- Mexican 39% Puerto Rican 1%
- Common ancestry
- Lithuanian 4% Slovak 2% Romanian 2%
- Foreign-born
- 18% · Canada
- Languages at home
- 59% English-only · Spanish 36% Other Indo-European 2% Russian/Polish/Slavic 1%
Political lean MEDSL · Montgomery
- 2024 margin
- Solid R (+45.5) · D 26.8% · R 72.3%
- 2008→2024 swing
- +7.2pp toward D · 2008: -52.7pp · 2024: -45.5pp
- All cycles
- 2024: R+45.5 2020: R+43.8 2016: R+51.4 2012: R+60.7 2008: R+52.7
Not yet ingested
- Civics
- —
Market trends
- HPI YoY
- ▼ -111.46%
- Current HPI
- 225.9903
- Rent YoY
- ▲ 1.65%
- Metro
- Houston-The Woodlands-Sugar Land, TX
- State GDP YoY
- ▲ 3.95%
- F500 in state
- 110
Industry mix (Fortune 500 HQ in TX)
| Industry | F500 HQs | Revenue |
|---|---|---|
| Energy | 16 | $1,198B |
|
||
| Technology | 5 | $198B |
|
||
| Engineering / Construction | 4 | $72B |
|
||
| Energy Services | 3 | $60B |
|
||
| Utilities | 3 | $41B |
|
||
| Healthcare | 2 | $330B |
|
||
Price history
+83.4% since first listed9 events — show timeline
- 2026-04-23 Price Changed $254,990 HARMLS
- 2026-03-01 Listed $259,900 HARMLS
- 2023-05-16 Sold (Public Records) — Public Records
- 2023-05-12 Sold (MLS) — HARMLS
- 2023-02-16 Pending — HARMLS
- 2023-02-13 Price Changed $234,900 HARMLS
- 2022-12-05 Listed $244,900 HARMLS
- 2008-04-30 Listing Removed — HARMLS
- 2007-10-11 Listed $139,000 HARMLS
Property tax history
+3.3%/yrLatest (2025): $4,704 · +2.6% YoY. Source: county tax records.
Cash-flow waterfall
monthlySold comps — $/sqft
last 12 mo · ≤1 miLoading sold comps…