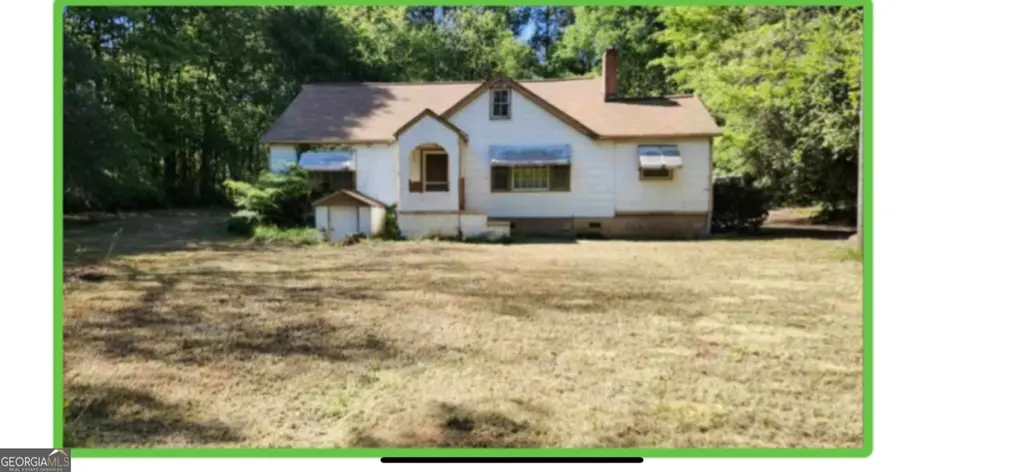
3874 Rex Cir · Stockbridge, GA
Flood risk 1/10 · Minimal
- FEMA flood zone
- X (unshaded)
- Chance of flooding over 30 yrs
- 0.0%
- Est. flood insurance / yr
- $473 – $860
Fire risk 1/10 · Minimal
- Est. fire insurance / yr
- $963 – $1,789
Heat risk 5/10 · Moderate
- Hot days now (above 106°F)
- 7 days/yr
- Hot days in 30 yrs
- 18 days/yr
Wind risk 6/10 · Moderate
- Chance of severe wind over 30 yrs
- 27.0%
Air-quality risk 4/10 · Minor
- Unhealthy air days now
- 4 days/yr
- Unhealthy air days in 30 yrs
- 6 days/yr
Risk factors via First Street. Map © Google.
Why this score? — see what drove the B grade
The composite is a weighted blend of 9 inputs, each scored 0–100. Each bar is that input's sub-score; the figure is the points it added to the 100-point composite (weight × sub-score).
- Cash flow +30.0/30.0
- ARV discount +15.0/15.0
- DSCR +10.0/10.0
- 1% rule +9.6/10.0
- Livability +3.0/5.0
- Rent growth +2.8/5.0
- Condition / age +2.5/5.0
- Schools +1.3/10.0
- Appreciation +0.0/10.0
$139,900
🖨 Deal sheet (PDF) 📄 Offer letter ✓ Due diligence
Listing remarks MLS
Restore to glory this charming 3 bedroom bungalow! Living room, separate dining room. Located on a flat 1 acre lot in historic Rex community. Great fixer upper with endless potential. Ready for investor offer. Cash only. Sold as-is.
Key facts
- 1 acre lot
- Built 1953
- Listed 75 days
Neighborhood map
What this means for you Summary
Snapshot
- This is a 3-bed/1.0-bath single-family listed at $140k.
Deal economics
- At list price, monthly cash flow is $742 ($9k/yr) — positive.
- The deal already cash-flows at list — no discount required.
- Meets the 1% rule at list price ($2k rent vs $140k).
- Recommended offer: $132k (6.0% below list) — sets the bar for market timing.
- Cap rate 12.7% vs local median 4.2% in Stockbridge — top-decile yield for the area; either an underpriced asset or a hidden risk that comps aren't pricing in. Stress-test before assuming the spread holds.
Location & tenants
- Location reads 60/100 on livability (#389 in GA) — a middle-class / working-renter tenant base. Strengths: housing A+, cost of living A; Watch: crime D, amenities F, commute F.
- Clayton County (suburban): math 11% / reading 20% proficiency, ranked #155 of 174 in GA (top 89%) — low school quality limits family demand, transient renter base, plan for 1-2y turnover; 78% free/reduced lunch — lower-income household profile, screen leases tightly.
- Zoned schools: East Clayton Elementary School (math 8% / reading 17%, grade F, #1,032 of 1,228 statewide, top 85%, 632 students, 90% FRL); Adamson Middle School (math 15% / reading 32%, grade F, #319 of 470 statewide, top 68%, 557 students, 90% FRL); Morrow High School (math 12% / reading 22%, grade F, #277 of 424 statewide, top 67%, 1,980 students, 91% FRL).
- Market conditions: Rents rising (+1.2%/yr); 84 active listings in the ZIP; 16 comparable units currently listed for rent nearby; rentals at typical pace (median 23d on market — plan ~3-4 weeks tenant-placement turnaround); 865 units permitted in Clayton County in 2024 (448 in 5+ unit buildings).
- This rent runs 33% of the median local income ($74k/yr) — at the standard rent-burdened threshold; future hikes will face affordability resistance.
Forward outlook
- Local home prices are declining (-3.0%/yr); year-one equity from $967 of loan paydown is wiped out by about $4k of value loss. Plan a longer hold.
- Clayton County population projected at +29% by 2050 — long-run rental-demand tailwind backs the buy-and-hold thesis.
- At projected returns (-3.0% appreciation + 1.2% rent growth), your $39k cash investment doubles in ~6 years — after that, you're playing with house money.
Negotiation context
- It's been on market 75 days — a 6% lower offer ($132k) is reasonable based on typical stale-listing flexibility.
- 3 sale attempts since 9y ago with the ask held roughly flat each time — persistent listings suggest the price (not the market) is what's stuck; bring a comps-based counter.
Risks & watch-outs
- Watch-outs: built in 1953 — expect roof / HVAC / electrical / plumbing capex.
- Climate carrying-cost: major wind risk, 27% chance of damaging wind over 30y; extreme-heat days projected 7→18/yr by 2055 (HVAC capex compounding) — expect insurance premiums to compound above CPI over the hold.
Questions for the listing agent
- It's been on market 75 days. Have you received any prior offers? Is the seller open to a 6% concession, seller financing, or rate buy-down credit?
- Built in 1953 — when were the roof, HVAC, electrical panel, plumbing, and water heater last replaced?
- Why hasn't it sold? Are there any deal-killer items the seller is aware of (foundation, flood, title, zoning, code violations)?
- Is there a deadline driving the sale (1031 exchange, divorce, estate, relocation)? That informs how much negotiation room exists.
- Schools are D-rated, which usually means shorter tenancies and higher turnover. Who's the typical renter profile here, and what's been the actual vacancy rate?
- Crime grade is D in this area — have there been break-ins, vandalism, or insurance claims at this property in the last 3 years? What carrier currently insures it and at what premium?
- What's the average days-on-market for RENTAL listings here right now (not sales)? A rising rental-DOM trend means longer vacancies and softer asking-rent achievability than the comps imply.
- What's the recent tenant-quality profile in this submarket — average credit score on applications, eviction rate, late-payment / NSF rate, and stable-employment percentage? A property-management company in the area should have these aggregated.
- How much new for-sale + rental construction is in the pipeline within 1–3 miles? Heavy new supply typically softens prices + rents 12–24 months out; constrained supply supports both.
Investment metrics
- 1% rule
- 1.46% ✓
- Cap rate
- 12.66%
- Cash-on-cash
- 22.73%
- DSCR
- 2.01
- GRM
- 5.7
CMA / ARV
- ARV (median comp)
- $242,376
- List price
- $139,900
- Delta
- -42.28%
- Verdict
- UNDERPRICED
- Comps
- 20 within 1.0 mi
Show comp detail 12 sales within ~0.75 mi
| Address | Dist | Beds/Ba | Sqft | Sold | Price | $/sf | Match |
|---|---|---|---|---|---|---|---|
| 5862 Homestead Cir | 0.11mi | 3/2.0 | 1,302 (+4%) | 10mo | $210,000 | $161 | 76 |
| 3903 Rex Rd | 0.05mi | 3/1.0 | 1,365 (+9%) | 12mo | $178,000 | $130 | 72 |
| 5810 Mistyview Dr | 0.43mi | 3/2.0 | 1,248 (-0%) | 6mo | $270,000 | $216 | 70 |
| 5798 Creekside Dr | 0.69mi | 3/2.0 | 1,336 (+7%) | 2mo | $258,000 | $193 | 51 |
| 6138 Lauren Ln | 0.62mi | 3/2.0 | 1,184 (-5%) | 10mo | $240,000 | $203 | 50 |
| 3548 Meadowview Ct | 0.61mi | 3/1.5 | 1,086 (-13%) | 1mo | $204,500 | $188 | 46 |
| 6154 Lauren Ln | 0.65mi | 3/2.0 | 1,143 (-9%) | 7mo | $235,000 | $206 | 46 |
| 6149 Pembroke Dr | 0.63mi | 3/2.0 | 1,119 (-11%) | 4mo | $250,000 | $223 | 45 |
| 6057 Dorchester Dr | 0.61mi | 4/2.0 (+1) | 1,365 (+9%) | 6mo | $215,000 | $158 | 42 |
| 5748 Meadow Ln | 0.53mi | 3/2.0 | 1,416 (+13%) | 10mo | $270,000 | $191 | 41 |
| 5899 Meadow Ln | 0.56mi | 3/2.0 | 1,393 (+11%) | 13mo | $200,000 | $144 | 41 |
| 6282 Amberly Rd | 0.73mi | 3/2.0 | 1,143 (-9%) | 8mo | $250,000 | $219 | 40 |
Match score weights: distance 35% · size 25% · config 20% · recency 20%. Top-matched comps best support the ARV.
Projected returns pro-forma
-3.0% appreciation · 1.19% rent growth · sell at horizon
- IRR
- 13.7%
- Equity multiple
- 1.53×
- Total profit
- $20,910
- Equity at exit
- $20,860
- IRR
- 21.1%
- Equity multiple
- 2.65×
- Total profit
- $64,512
- Equity at exit
- $12,096
Cash invested: $39,172 (down + closing). Projections, not guarantees.
Landlord ↔ Tenant lean methodology
- Overall (STATE)
- 90 Strongly Landlord-Friendly
- State Georgia
- 90 Strongly Landlord-Friendly · R+3
- County
- — inherits STATE
- City
- — inherits STATE
ZIP-level market 30273
- Home prices YoY
- -28.4%
- Rents YoY
- 1.2%
- Active inventory
- 84
- Price-to-rent
- 5.7×
Monthly cashflow live
- Estimated rent
- $2,037 high interval (Pro) →
- Mortgage (P&I)
- −$734
- Tax from tax record
- −$75 /mo · $906/yr
- Insurance
- −$58
- HOA
- −$0
- Vacancy / Maint / Mgmt
- −$428
- Net cashflow
- $742
Break-even live
Sensitivity live
| Price | -10% $821 | -5% $782 | +0% $742 | +5% $702 | +10% $663 |
|---|---|---|---|---|---|
| Rent | -10% $581 | -5% $661 | +0% $742 | +5% $822 | +10% $903 |
| Rate | -1.0pp $812 | -0.5pp $778 | base $742 | +0.5pp $706 | +1.0pp $669 |
UW: 25.0% down · 7.5% · 30yr · 1.5% tax · 5.0% vac · 8.0% maint · 8.0% mgmt
Financing live
Cash to close
- Down payment
- $34,975
- Closing costs
- $4,197
- Reserves months
- —
- Total cash needed
- —
Loan-product check · same deal, 3 products live
Conventional
25% down · 7.5% · 30yr
- Down + closing
- —
- Monthly P&I
- —
- Monthly cashflow
- —
- DSCR
- —
- Eligible?
- —
Personal DTI + credit; lowest rate.
DSCR
20% down · 8.5% · 30yr
- Down + closing
- —
- Monthly P&I
- —
- Monthly cashflow
- —
- DSCR
- —
- Eligible?
- —
No personal income docs; deal must DSCR.
Hard money
10% down · 12.0% · 12mo
- Down + closing
- —
- Monthly P&I
- —
- Monthly cashflow
- —
- DSCR
- —
- Eligible?
- —
Short-term bridge; refi at stabilization.
Rent comps 16 comps
| Address | Beds | Baths | Sqft | Rent | $/sqft | DOM | Units | Dist |
|---|---|---|---|---|---|---|---|---|
| 5894 Homestead Cir Rex, GA | 3.0 | 2.0 | 1462 | $1,890 | $1.29 | 7d | 1 | 0.16mi |
| 5900 Homestead Cir Rex, GA | 3.0 | 2.0 | 1544 | $1,937 | $1.25 | 46d | 1 | 0.17mi |
| 5832 Mays Ridge Ct Rex, GA | 4.0 | 3.0 | 1408 | $2,020 | $1.43 | 46d | 1 | 0.23mi |
| 3543 Meadowview Ct Rex, GA | 3.0 | 1.5 | 1582 | $1,995 | $1.26 | 1d | 1 | 0.64mi |
| 6169 Fay Ct Rex, GA | 3.0 | 2.0 | 1416 | $2,100 | $1.48 | 46d | 1 | 0.73mi |
| 5544 Frontier Ct Ellenwood, GA | 4.0 | 2.5 | 1800 | $2,109 | $1.17 | 26d | 1 | 0.75mi |
| 3769 Stagecoach Pass Ellenwood, GA | 3.0 | 2.0 | 1800 | $2,200 | $1.22 | 46d | 1 | 0.79mi |
| 5862 Waggoner Ct Rex, GA | 4.0 | 2.0 | 1558 | $2,226 | $1.43 | 24d | 1 | 0.91mi |
| 70 Homestead Pl Rex, GA | 4.0 | 2.0 | 1650 | $2,011 | $1.22 | 0d | 1 | 0.95mi |
| 6379 Skyline Dr Rex, GA | 3.0 | 2.0 | 1722 | $2,000 | $1.16 | 7d | 1 | 1.04mi |
| 6300 Ellenwood Dr Rex, GA | 3.0 | 2.5 | 1388 | $1,699 | $1.22 | 12d | 1 | 1.13mi |
| 6683 Homestead Rd Rex, GA | 3.0 | 2.0 | 1536 | $2,000 | $1.30 | 7d | 1 | 1.14mi |
| 40 Wagon Wheel Dr Rex, GA | 3.0 | 2.0 | 1404 | $1,350 | $0.96 | 7d | 1 | 1.23mi |
| 5248 Katherine Village Dr Ellenwood, GA | 3.0 | 2.5 | 1364 | $1,995 | $1.46 | 23d | 1 | 1.27mi |
| 130 Derby Country Dr Ellenwood, GA | 3.0 | 2.0 | 1273 | $1,870 | $1.47 | 1d | 1 | 1.27mi |
| 85 Derby Country Dr Ellenwood, GA | 3.0 | 2.0 | 1273 | $1,895 | $1.49 | 26d | 1 | 1.30mi |
Listing history 23 events
-
2026-06-21days on market $139,900 Active 75 DOM
-
2026-06-18days on market $139,900 Active 72 DOM
-
2026-06-17days on market $139,900 Active 71 DOM
-
2026-06-16days on market $139,900 Active 70 DOM
-
2026-06-15days on market $139,900 Active 69 DOM
-
2026-06-13days on market $139,900 Active 67 DOM
-
2026-06-09days on market $139,900 Active 63 DOM
-
2026-06-08days on market $139,900 Active 62 DOM
-
2026-06-07days on market $139,900 Active 61 DOM
-
2026-06-04days on market $139,900 Active 58 DOM
-
2026-06-03days on market $139,900 Active 57 DOM
-
2026-06-02days on market $139,900 Active 56 DOM
-
2026-06-01days on market $139,900 Active 55 DOM
-
2026-05-31days on market $139,900 Active 54 DOM
-
2026-04-26price $139,900 232-char remark
Show marketing remark (232 chars)
Restore to glory this charming 3 bedroom bungalow! Living room, separate dining room. Located on a flat 1 acre lot in historic Rex community. Great fixer upper with endless potential. Ready for investor offer. Cash only. Sold as-is.
-
2026-04-02$144,900 New 232-char remark
Show marketing remark (232 chars)
Restore to glory this charming 3 bedroom bungalow! Living room, separate dining room. Located on a flat 1 acre lot in historic Rex community. Great fixer upper with endless potential. Ready for investor offer. Cash only. Sold as-is.
-
2025-12-17historical
-
2025-10-23price $175,000
-
2025-08-27price $185,000
-
2025-08-02price $185,900
-
2025-06-17$198,500 New
-
2017-04-04historical
-
2017-03-27$69,900 New
ⓘ Source: listings_history table (triggers on properties + properties_extension) + one-shot
backfill from property_details.listing_events for pre-trigger history.
Tax reassessment forecast GA · Resets to sale price
- Current annual tax
- $906 · $75/mo
- Projected year-2 tax
- $1,287 · $107/mo
- Expected delta
- +$381/yr (+$32/mo · 42.1%)
ⓘ Screening estimate from a state-policy table — verify with the county assessor before closing.
Climate risk First Street
- Flood 1/10 Low FEMA zone X (unshaded) · 0% chance over 30 yrs
- Wildfire 1/10 Low
- Heat 5/10 Major 7 d/yr ≥106°F today · 18 d/yr by 30 yrs out
- Wind 6/10 Major 27% chance of damaging wind over 30 yrs
- Air quality 4/10 Moderate 4 unhealthy d/yr today · 6 by 30 yrs out
Nearby sold comps map
Loading sold comps map…
Walkable amenities ~0.75 mi
Loading nearby amenities…
Taxation est. · year 1
- Rental income
- $24,446
- − Mortgage interest
- −$7,837
- − Property taxes
- −$906
- − Insurance
- −$700
- − Repairs & maintenance
- −$1,956
- − Management
- −$1,956
- − Depreciation
- −$4,070
- Taxable income
- $7,023
- Est. tax owed @ 24.0%
- −$1,686
- After-tax cash flow
- $7,218/yr
For passive investors: Depreciation is non-cash, so a rental often shows a tax loss while cash-flowing — sheltering income. Rental losses are passive: they offset passive income freely, and up to $25,000/yr can offset ordinary (W-2) income if you actively participate and your MAGI is under $100k (phasing out to $0 by $150k); unused losses carry forward. On sale, claimed depreciation is recaptured at up to 25%, and gains may owe capital-gains tax (a 1031 exchange can defer both). Figures are a year-1 estimate at your 24.0% rate — not tax advice; consult a CPA.
Schools (NCES district)
- District
- Clayton County
- NCES district ID
- 1301230
- Math proficiency
- 11% ▼ -13.00%
- Reading proficiency
- 20% ▼ -9.00%
- Median HH income
- $42,266
- Composite
- 13.41/100
- National rank
- #9527
- State rank
- #155 of 174 in GA
Livability — Stockbridge
- Score
- 60/100
- State rank
- #389
- US rank
- #19479
Category grades
Schools grade is shown separately in the Schools card above.
Census & demographics
- County
- Clayton County · 230,153 people
- City population
- 71,603
- Metro
- Atlanta-Sandy Springs-Alpharetta, GA
- Population (ZIP)
- 17,844
- Household income
- $73,502
- Rent vs Own
- Severe rent burden
- 270.0
Population outlook (Clayton County) Hauer SSP2
- Today (2025)
- 310,777 people
- By 2030
- 329,762 · +6.1%
- By 2040
- 368,052 · +18.4%
- By 2050
- 401,196 · +29.1%
- By 2075
- 472,488 · +52.0%
- By 2100
- 500,446 · +61.0%
Race, ethnicity, and origin ACS 2023
- Neighborhood character
- Diverse neighborhood (Simpson 0.56)
- Race & ethnicity
- Black 63% White 16% Hispanic / Latino 10% Asian 6% Two or more races 5%
- Hispanic origin (detail)
- Mexican 5%
- Common ancestry
- Slovak 1% Serbian 1% Ukrainian 1%
- Foreign-born
- 11% · Vietnam, Canada
- Languages at home
- 82% English-only · Spanish 7% Vietnamese 6% French/Haitian/Cajun 3%
Political lean MEDSL · Clayton
- 2024 margin
- Solid D (+69.2) · D 84.3% · R 15.1%
- 2008→2024 swing
- +2.8pp toward D · 2008: 66.4pp · 2024: 69.2pp
- All cycles
- 2024: D+69.2 2020: D+70.9 2016: D+71.9 2012: D+70.1 2008: D+66.4
Not yet ingested
- Civics
- —
Market trends
- HPI YoY
- ▼ -74.65%
- Current HPI
- 188.3712
- Rent YoY
- ▲ 1.19%
- Metro
- Atlanta-Sandy Springs-Alpharetta, GA
- State GDP YoY
- ▲ 2.66%
- F500 in state
- 28
Industry mix (Fortune 500 HQ in GA)
| Industry | F500 HQs | Revenue |
|---|---|---|
| Paper / Packaging | 2 | $29B |
|
||
| Retail | 1 | $160B |
|
||
| Transportation / Logistics | 1 | $91B |
|
||
| Airlines | 1 | $62B |
|
||
| Consumer Goods | 1 | $47B |
|
||
| Utilities | 1 | $25B |
|
||
Price history
+100.1% since first listed9 events — show timeline
- 2026-04-26 Price Changed $139,900 GAMLS
- 2026-04-02 Listed $144,900 GAMLS
- 2025-12-17 Listing Removed — GAMLS
- 2025-10-23 Price Changed $175,000 GAMLS
- 2025-08-27 Price Changed $185,000 GAMLS
- 2025-08-02 Price Changed $185,900 GAMLS
- 2025-06-17 Listed $198,500 GAMLS
- 2017-04-04 Listing Removed — GAMLS
- 2017-03-27 Listed $69,900 GAMLS
Property tax history
-1.4%/yrLatest (2025): $906 · +0.5% YoY. Source: county tax records.
Cash-flow waterfall
monthlySold comps — $/sqft
last 12 mo · ≤1 miLoading sold comps…