26599 Pepperidge Cv · Long Neck, DE
Flood risk 1/10 · Minimal
- FEMA flood zone
- X (unshaded)
- Chance of flooding over 30 yrs
- 0.0%
- Est. flood insurance / yr
- $473 – $860
Fire risk 3/10 · Minor
- Est. fire insurance / yr
- $476 – $884
Heat risk 8/10 · Major
- Hot days now (above 101°F)
- 7 days/yr
- Hot days in 30 yrs
- 19 days/yr
Wind risk 8/10 · Major
- Chance of severe wind over 30 yrs
- 80.0%
Air-quality risk 2/10 · Minimal
- Unhealthy air days now
- 1 days/yr
- Unhealthy air days in 30 yrs
- 1 days/yr
Risk factors via First Street. Map © Google.
Why this score? — see what drove the B grade
The composite is a weighted blend of 9 inputs, each scored 0–100. Each bar is that input's sub-score; the figure is the points it added to the 100-point composite (weight × sub-score).
- Cash flow +30.0/30.0
- 1% rule +10.0/10.0
- DSCR +10.0/10.0
- ARV discount +7.5/15.0
- Schools +4.2/10.0
- Livability +3.5/5.0
- Rent growth +2.5/5.0
- Condition / age +2.5/5.0
- Appreciation +0.0/10.0
$160,000
🖨 Deal sheet 📄 Offer letter ✓ Due diligence
Listing remarks
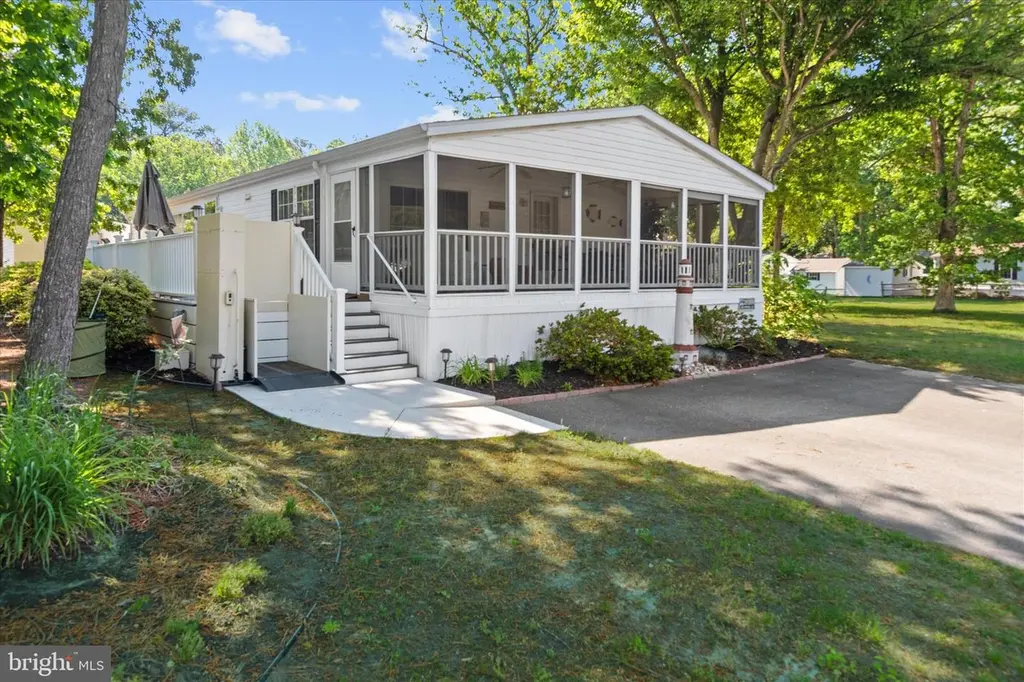
QUICK MOVE-IN! READY JUST IN TIME FOR SUMMER FUN! Welcome to Pot-Nets Lakeside, where every day feels a little more like vacation. Located in one of Pot-Nets' six unique waterfront communities on the Long Neck Peninsula, you'll enjoy an incredible lineup of amenities and a relaxed coastal lifestyle that's hard to beat. This well-maintained three-bedroom, two-bath home offers comfortable living with vaulted ceilings, a spacious owner's suite with a walk-in closet and private bath, and beautiful vinyl plank flooring installed in 2023. To make your move even easier, the primary bedroom, living room, and kitchen furniture are included. Start your mornings with coffee on the screened front porch
Key facts
- 6,000 sq ft lot
- 3 parking spots
- Community pool
Property features AI
Finance
- Other: Ownership is land lease; Property is not in a federal flood zone; Pets allowed (cats and dogs OK); Located in a water-oriented community on Indian River Bay; Builder: Fleetwood
- Financial info: Land lease of $860 per month (approximately 1 year remaining); Lease not considered
- HOA & community: HOA fees cover common area maintenance, management, and the pool; Community amenities include beach, boat slip, boat ramp, clubhouse, common grounds, community center, dog park, jogging/walking paths, picnic area, outdoor pool, pier/dock, shuffleboard, tennis courts, playgrounds, and water/lake privileges; Community has an in-ground, fenced, filtered community pool
Exterior
- Parking: Asphalt driveway; Driveway parking with three spaces; Three total garage/parking spaces
- Utilities: Public water; Public sewer; Underground utilities; Internet: Cable, Fiber Optic, Satellite
- Home design: Manufactured home (double wide, Fleetwood); Pillar/post/pier foundation; Architectural shingle roof; Vinyl siding; Level entry; 32+ inch wide doors; Chairlift; Estimated year built
- Construction: Built with batt and blown-in insulation; Vinyl clad, double-pane, energy-efficient windows
- Exterior features: Landscaped lot; Screened porch; Deck; Shed; Above-grade other structures
Interior
- Kitchen: Built-in microwave; Dishwasher; Garbage disposal; Gas oven/range; Refrigerator
- Bedrooms: Three bedrooms on the main level
- Flooring: Luxury vinyl plank
- Bathrooms: Two full bathrooms on the main level
- Heating & cooling: Forced air heating (propane - leased); Central air conditioning; 100 amp electrical service
- Interior features: Vaulted ceilings; Drywall walls and ceilings; No basement
- Laundry & utility: Washer and dryer (electric dryer); Main-floor laundry; Electric water heater
Neighborhood map
What this means for you Summary
Snapshot
- This is a 3-bed/2.0-bath manufactured listed at $160k.
Deal economics
- At list price, monthly cash flow is $1k ($13k/yr) — positive.
- The deal already cash-flows at list — no discount required.
- Meets the 1% rule at list price ($3k rent vs $160k).
- Recommended offer: $158k (1.5% below list) — sets the bar for market timing.
- Cap rate 14.2% vs local median 3.2% in Long Neck — top-decile yield for the area; either an underpriced asset or a hidden risk that comps aren't pricing in. Stress-test before assuming the spread holds.
Location & tenants
- Location reads 69/100 on livability (#30 in DE) — a middle-class / working-renter tenant base. Strengths: cost of living A+, housing A+, crime A-; Watch: employment D+, schools F, amenities F.
- Cape Henlopen School District (town): math 42% / reading 55% proficiency, ranked #5 of 26 in DE (top 19%) — families likely to look elsewhere, expect single-tenant / working-renter base with shorter leases.
- Market conditions: 865 active listings in the ZIP; 2 comparable units currently listed for rent nearby; solid renter incomes; 4,354 units permitted in Sussex County in 2024 (344 in 5+ unit buildings).
- This rent runs 42% of the median local income ($78k/yr) — at the standard rent-burdened threshold; future hikes will face affordability resistance.
Forward outlook
- Local home prices are declining (-3.0%/yr); year-one equity from $1k of loan paydown is wiped out by about $5k of value loss. Plan a longer hold.
- Sussex County population projected at +25% by 2050 — long-run rental-demand tailwind backs the buy-and-hold thesis.
- At projected returns (-3.0% appreciation + 3.0% rent growth), your $45k cash investment doubles in ~5 years — after that, you're playing with house money.
Negotiation context
- It's been on market 23 days — a 2% lower offer ($158k) is reasonable based on typical stale-listing flexibility.
Risks & watch-outs
- Climate carrying-cost: severe wind risk, 80% chance of damaging wind over 30y; extreme-heat days projected 7→19/yr by 2055 (HVAC capex compounding) — expect insurance premiums to compound above CPI over the hold.
Questions for the listing agent
- Is there a deadline driving the sale (1031 exchange, divorce, estate, relocation)? That informs how much negotiation room exists.
- Schools are F-rated, which usually means shorter tenancies and higher turnover. Who's the typical renter profile here, and what's been the actual vacancy rate?
- What's the average days-on-market for RENTAL listings here right now (not sales)? A rising rental-DOM trend means longer vacancies and softer asking-rent achievability than the comps imply.
- What's the recent tenant-quality profile in this submarket — average credit score on applications, eviction rate, late-payment / NSF rate, and stable-employment percentage? A property-management company in the area should have these aggregated.
- How much new for-sale + rental construction is in the pipeline within 1–3 miles? Heavy new supply typically softens prices + rents 12–24 months out; constrained supply supports both.
Investment metrics
- 1% rule
- 1.71% ✓
- Cap rate
- 14.23%
- Cash-on-cash
- 28.35%
- DSCR
- 2.26
- GRM
- 4.9
CMA / ARV
No comps found within radius.
Projected returns pro-forma
-3.0% appreciation · 3.0% rent growth · sell at horizon
- IRR
- 22.6%
- Equity multiple
- 1.93×
- Total profit
- $41,536
- Equity at exit
- $23,857
- IRR
- 30.6%
- Equity multiple
- 3.75×
- Total profit
- $123,153
- Equity at exit
- $13,834
Cash invested: $44,800 (down + closing). Projections, not guarantees.
Landlord ↔ Tenant lean methodology
- Overall (STATE)
- 70 Landlord-Friendly
- State Delaware
- 70 Landlord-Friendly · D+7
- County
- — inherits STATE
- City
- — inherits STATE
ZIP-level market 19966
- Home prices YoY
- -6.4%
- Active inventory
- 865
- Price-to-rent
- 4.9×
Monthly cashflow live
- Estimated rent
- $2,740 medium interval (Pro) →
- Mortgage (P&I)
- −$839
- Tax est. 1.5%
- −$200 /mo · $2,400/yr
- Insurance
- −$67
- HOA
- −$0
- Vacancy / Maint / Mgmt
- −$575
- Net cashflow
- $1,059
Break-even live
UW: 25.0% down · 7.5% · 30yr · 1.5% tax · 5.0% vac · 8.0% maint · 8.0% mgmt
Financing live
Cash to close
- Down payment
- $40,000
- Closing costs
- $4,800
- Reserves months
- —
- Total cash needed
- —
Loan-product check · same deal, 3 products live
Conventional
25% down · 7.5% · 30yr
- Down + closing
- —
- Monthly P&I
- —
- Monthly cashflow
- —
- DSCR
- —
- Eligible?
- —
Personal DTI + credit; lowest rate.
DSCR
20% down · 8.5% · 30yr
- Down + closing
- —
- Monthly P&I
- —
- Monthly cashflow
- —
- DSCR
- —
- Eligible?
- —
No personal income docs; deal must DSCR.
Hard money
10% down · 12.0% · 12mo
- Down + closing
- —
- Monthly P&I
- —
- Monthly cashflow
- —
- DSCR
- —
- Eligible?
- —
Short-term bridge; refi at stabilization.
Rent comps 2 comps
| Address | Beds | Baths | Sqft | Rent | $/sqft | DOM | Units | Dist |
|---|---|---|---|---|---|---|---|---|
| 24201 Hammerhead Dr Millsboro, DE | 3.0 | 3.0 | 1751 | $3,200 | $1.83 | 13d | 1 | 1.16mi |
| 24209 Hammerhead Dr Millsboro, DE | 2.0 | 2.0 | 1751 | $2,350 | $1.34 | 43d | 1 | 1.16mi |
Listing history 16 events
-
2026-06-18days on market $160,000 Active 23 DOM
-
2026-06-17days on market $160,000 Active 22 DOM
-
2026-06-16days on market $160,000 Active 21 DOM
-
2026-06-15days on market $160,000 Active 20 DOM
-
2026-06-14days on market $160,000 Active 18 DOM
-
2026-06-13days on market $160,000 Active 17 DOM
-
2026-06-10days on market $160,000 Active 15 DOM
-
2026-06-09days on market $160,000 Active 14 DOM
-
2026-06-08days on market $160,000 Active 13 DOM
-
2026-06-07remarks 699-char remark
-
2026-06-07statusdays on market $160,000 Active 12 DOM
-
2026-05-31status $160,000 Active Under Contract 10 DOM
-
2026-05-31days on market $160,000 Active 10 DOM
-
2026-05-30days on market $160,000 Active 9 DOM
-
2026-05-22$160,000 Active
-
2026-05-21historical $160,000
ⓘ Source: listings_history table (triggers on properties + properties_extension) + one-shot
backfill from property_details.listing_events for pre-trigger history.
Climate risk First Street
- Flood 1/10 Low FEMA zone X (unshaded) · 0% chance over 30 yrs
- Wildfire 3/10 Moderate
- Heat 8/10 Severe 7 d/yr ≥101°F today · 19 d/yr by 30 yrs out
- Wind 8/10 Severe 80% chance of damaging wind over 30 yrs
- Air quality 2/10 Low 1 unhealthy d/yr today · 1 by 30 yrs out
Nearby sold comps map
Loading sold comps map…
Walkable amenities ~0.75 mi
Loading nearby amenities…
Taxation est. · year 1
- Rental income
- $32,876
- − Mortgage interest
- −$8,962
- − Property taxes
- −$2,400
- − Insurance
- −$800
- − Repairs & maintenance
- −$2,630
- − Management
- −$2,630
- − Depreciation
- −$4,655
- Taxable income
- $10,798
- Est. tax owed @ 24.0%
- −$2,592
- After-tax cash flow
- $10,111/yr
For passive investors: Depreciation is non-cash, so a rental often shows a tax loss while cash-flowing — sheltering income. Rental losses are passive: they offset passive income freely, and up to $25,000/yr can offset ordinary (W-2) income if you actively participate and your MAGI is under $100k (phasing out to $0 by $150k); unused losses carry forward. On sale, claimed depreciation is recaptured at up to 25%, and gains may owe capital-gains tax (a 1031 exchange can defer both). Figures are a year-1 estimate at your 24.0% rate — not tax advice; consult a CPA.
Schools (NCES district)
- District
- Cape Henlopen School District
- NCES district ID
- 1000170
- Math proficiency
- 42% ▼ -14.00%
- Reading proficiency
- 55% ▼ -10.00%
- Median HH income
- $60,196
- Composite
- 42.47/100
- National rank
- #3214
- State rank
- #5 of 26 in DE
Livability — Long Neck
- Score
- 69/100
- State rank
- #30
- US rank
- #8720
Category grades
Schools grade is shown separately in the Schools card above.
Census & demographics
- County
- Sussex County · 82,708 people
- Metro
- Salisbury, MD-DE
- Population (ZIP)
- 35,884
- Household income
- $78,305
- Rent vs Own
- Severe rent burden
- 464.0
Population outlook (Sussex County) Hauer SSP2
- Today (2025)
- 248,853 people
- By 2030
- 264,464 · +6.3%
- By 2040
- 290,980 · +16.9%
- By 2050
- 311,259 · +25.1%
- By 2075
- 352,488 · +41.6%
- By 2100
- 367,406 · +47.6%
Race, ethnicity, and origin ACS 2023
- Neighborhood character
- Predominantly White (74%)
- Race & ethnicity
- White 74% Hispanic / Latino 11% Black 8% Two or more races 7% Native American 3% Asian 1%
- Hispanic origin (detail)
- Mexican 3%
- Common ancestry
- Romanian 4% Slovak 2% Serbian 1%
- Foreign-born
- 8% · Canada, China
- Languages at home
- 88% English-only · Spanish 9% Other Indo-European 1%
Political lean MEDSL · Sussex
- 2024 margin
- R (+11.0) · D 43.9% · R 54.9% · Other 1.2%
- 2008→2024 swing
- -2.4pp toward R · 2008: -8.6pp · 2024: -11.0pp
- All cycles
- 2024: R+11.0 2020: R+11.2 2016: R+22.0 2012: R+13.0 2008: R+8.6
Not yet ingested
- Civics
- —
Market trends
- HPI YoY
- ▼ -18.26%
- Current HPI
- 268.5609
- Rent YoY
- —
- Metro
- Salisbury, MD-DE
- State GDP YoY
- —
- F500 in state
- 0
Price history
+0.0% since first listed2 events — show timeline
- 2026-05-22 Listed $160,000 BRIGHT MLS
- 2026-05-21 Coming Soon $160,000 BRIGHT MLS
Property tax history
-2.6%/yrLatest (2025): $304 · -29.6% YoY. Source: county tax records.
Cash-flow waterfall
monthlySold comps — $/sqft
last 12 mo · ≤1 miLoading sold comps…