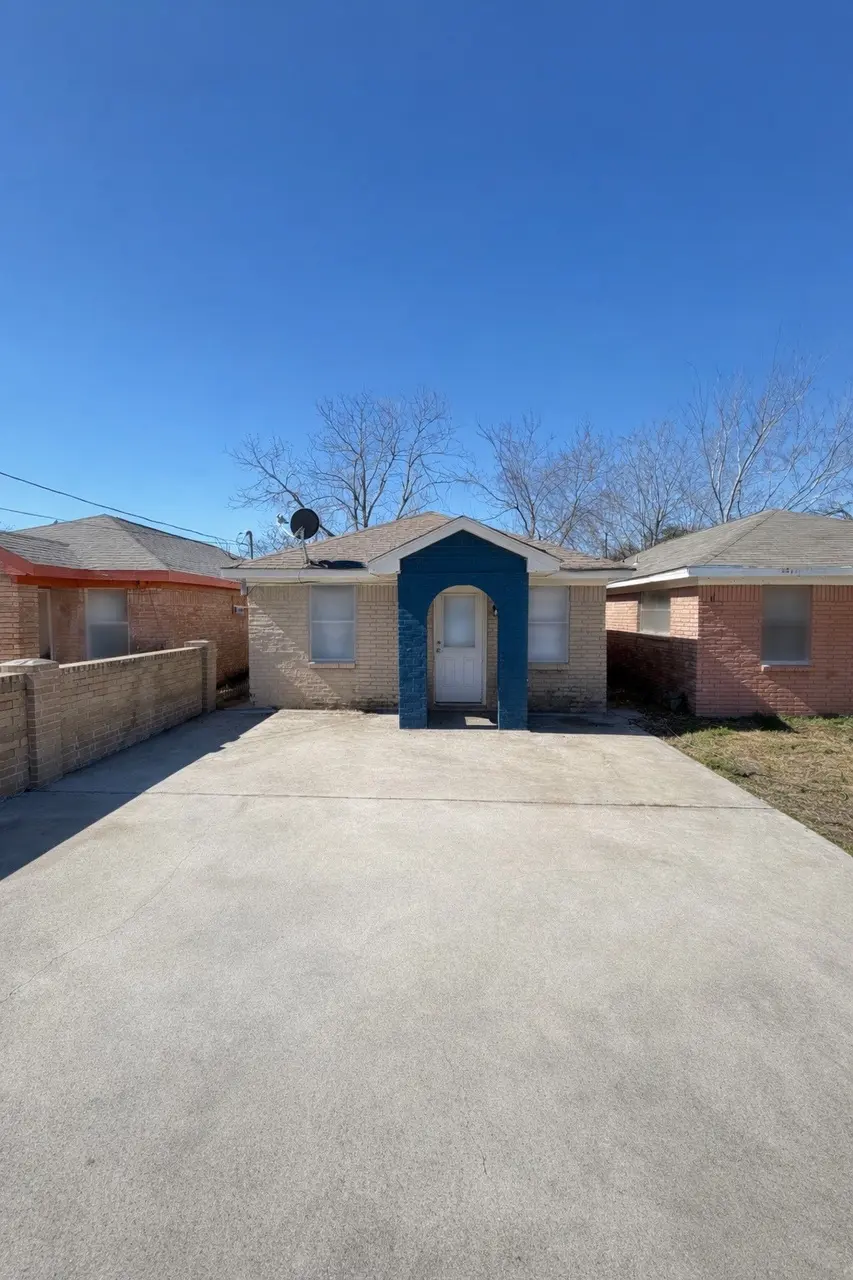
2919 Staples St · Houston, TX
Flood risk 1/10 · Minimal
- FEMA flood zone
- X (shaded)
- Chance of flooding over 30 yrs
- 0.0%
- Est. flood insurance / yr
- $507 – $1,088
Fire risk 1/10 · Minimal
- Est. fire insurance / yr
- $1,222 – $2,270
Heat risk 9/10 · Severe
- Hot days now (above 109°F)
- 7 days/yr
- Hot days in 30 yrs
- 23 days/yr
Wind risk 9/10 · Severe
- Chance of severe wind over 30 yrs
- 99.0%
Air-quality risk 3/10 · Minor
- Unhealthy air days now
- 2 days/yr
- Unhealthy air days in 30 yrs
- 3 days/yr
Risk factors via First Street. Map © Google.
Why this score? — see what drove the C- grade
The composite is a weighted blend of 9 inputs, each scored 0–100. Each bar is that input's sub-score; the figure is the points it added to the 100-point composite (weight × sub-score).
- Cash flow +14.4/30.0
- ARV discount +11.0/15.0
- Appreciation +6.9/10.0
- 1% rule +4.9/10.0
- DSCR +4.4/10.0
- Livability +3.7/5.0
- Rent growth +3.3/5.0
- Schools +2.7/10.0
- Condition / age +2.5/5.0
$115,000
🖨 Deal sheet 📄 Offer letter ✓ Due diligence
Listing remarks MLS
INVESTOR SPECIAL – PRIME LOCATION Opportunity is knocking! This 2 bed, 1 bath home is located just minutes from Downtown Houston and surrounded by ongoing redevelopment and new construction. This property offers strong upside potential for investors, flippers, or buyers looking to renovate and build equity. No HOA provides added flexibility, with easy access to I-10, I-69, and 610. Schedule your showing today!
Key facts
- Easy access to i-69
- Prime location
- No hoa
Tags
Neighborhood map
What this means for you Summary
Snapshot
- This is a 2-bed/1.0-bath single-family listed at $115k.
Deal economics
- At list price, monthly cash flow is $23 ($280/yr) — positive.
- The deal already cash-flows at list — no discount required.
- To meet the 1% rule (rent ≥ 1% of price), the offer needs to be $114k (1.0% below list).
- Recommended offer: $108k (6.0% below list) — sets the bar for market timing.
- Cap rate 6.5% vs local median 3.2% in Houston — top-decile yield for the area; either an underpriced asset or a hidden risk that comps aren't pricing in. Stress-test before assuming the spread holds.
Location & tenants
- Location reads 74/100 on livability (#184 in TX, #4,771 nationally) — a middle-class / working-renter tenant base. Strengths: amenities A+, cost of living A+, housing A+; Watch: schools D, crime F.
- Houston ISD (urban): math 27% / reading 35% proficiency, ranked #593 of 826 in TX (top 72%) — families likely to look elsewhere, expect single-tenant / working-renter base with shorter leases; 71% free/reduced lunch — lower-income household profile, screen leases tightly.
- Market conditions: Rents rising (+3.1%/yr); 445 active listings in the ZIP; 28 comparable units currently listed for rent nearby; rentals lingering (median 44d on market — plan ~5-8 weeks vacancy on turnover, expect pricing pressure); 57% of comp listings sitting > 30 days — soft ceiling on asking rent; lower-income renter base — watch delinquency; 29,883 units permitted in Harris County in 2024 (8,621 in 5+ unit buildings).
- This rent runs 35% of the median local income ($39k/yr) — at the standard rent-burdened threshold; future hikes will face affordability resistance.
Forward outlook
- In year one you build about $5k of equity ($795 loan paydown + $4k appreciation (3.9% local appreciation)).
- Harris County population projected at +47% by 2050 — long-run rental-demand tailwind backs the buy-and-hold thesis.
- At projected returns (3.9% appreciation + 3.1% rent growth), your $32k cash investment doubles in ~5 years — after that, you're playing with house money.
- By year 7, paydown + projected appreciation supports a ~$33k cash-out refi (75% LTV) — recoverable capital for the next deal without selling this one.
Negotiation context
- It's been on market 87 days — a 6% lower offer ($108k) is reasonable based on typical stale-listing flexibility.
- 2 sale attempts; this cycle's ask has dropped $40k (26%) from the opening price — seller is motivated, your offer sets the floor, not the list.
- Current owner paid $23k; list at $115k implies a 404% gain — meaningful room to come down on a strong offer.
Risks & watch-outs
- Climate carrying-cost: severe wind risk, 99% chance of damaging wind over 30y; extreme-heat days projected 7→23/yr by 2055 (HVAC capex compounding) — expect insurance premiums to compound above CPI over the hold.
Questions for the listing agent
- It's been on market 87 days. Have you received any prior offers? Is the seller open to a 6% concession, seller financing, or rate buy-down credit?
- Built in 1960 — when were the roof, HVAC, electrical panel, plumbing, and water heater last replaced?
- Why hasn't it sold? Are there any deal-killer items the seller is aware of (foundation, flood, title, zoning, code violations)?
- Is there a deadline driving the sale (1031 exchange, divorce, estate, relocation)? That informs how much negotiation room exists.
- Schools are D-rated, which usually means shorter tenancies and higher turnover. Who's the typical renter profile here, and what's been the actual vacancy rate?
- Crime grade is F in this area — have there been break-ins, vandalism, or insurance claims at this property in the last 3 years? What carrier currently insures it and at what premium?
- What's the average days-on-market for RENTAL listings here right now (not sales)? A rising rental-DOM trend means longer vacancies and softer asking-rent achievability than the comps imply.
- What's the recent tenant-quality profile in this submarket — average credit score on applications, eviction rate, late-payment / NSF rate, and stable-employment percentage? A property-management company in the area should have these aggregated.
- How much new for-sale + rental construction is in the pipeline within 1–3 miles? Heavy new supply typically softens prices + rents 12–24 months out; constrained supply supports both.
Investment metrics
- 1% rule
- 0.99% ✗
- Cap rate
- 6.54%
- Cash-on-cash
- 0.87%
- DSCR
- 1.04
- GRM
- 8.4
CMA / ARV
- ARV (median comp)
- $124,662
- List price
- $115,000
- Delta
- -7.75%
- Verdict
- FAIR
- Comps
- 20 within 1.0 mi
Show comp detail 12 sales within ~0.75 mi
| Address | Dist | Beds/Ba | Sqft | Sold | Price | $/sf | Match |
|---|---|---|---|---|---|---|---|
| 3920 Sayers | 0.53mi | 2/1.0 | 1,020 (+1%) | 6mo | $99,000 | $97 | 69 |
| 4045 Lucille St | 0.36mi | 2/1.0 | 980 (-3%) | 14mo | $179,990 | $184 | 66 |
| 3714 Christie St | 0.56mi | 2/1.0 | 1,086 (+7%) | 4mo | $150,000 | $138 | 59 |
| 2315 Bringhurst St | 0.42mi | 2/1.0 | 930 (-8%) | 12mo | $59,000 | $63 | 57 |
| 2114 Des Chaumes St | 0.58mi | 2/2.5 | 1,000 (-1%) | 10mo | $235,000 | $235 | 57 |
| 2112 Des Chaumes St | 0.58mi | 2/2.5 | 955 (-6%) | 1mo | $239,900 | $251 | 56 |
| 2116 Des Chaumes St | 0.58mi | 2/2.5 | 955 (-6%) | 5mo | $240,000 | $251 | 54 |
| 2306 Staples St | 0.44mi | 2/1.0 | 912 (-10%) | 13mo | $135,000 | $148 | 52 |
| 2303 Leffingwell St | 0.56mi | 3/2.0 (+1) | 1,075 (+6%) | 12mo | $215,000 | $200 | 44 |
| 4214 Quitman St | 0.59mi | 3/2.0 (+1) | 1,128 (+12%) | 0mo | $174,999 | $155 | 44 |
| 4010 Falls St | 0.62mi | 2/1.0 | 890 (-12%) | 12mo | $216,500 | $243 | 41 |
| 4313 Engleford St | 0.59mi | 3/1.0 (+1) | 900 (-11%) | 11mo | $139,900 | $155 | 40 |
Match score weights: distance 35% · size 25% · config 20% · recency 20%. Top-matched comps best support the ARV.
Projected returns pro-forma
3.89% appreciation · 3.08% rent growth · sell at horizon
- IRR
- 10.8%
- Equity multiple
- 1.65×
- Total profit
- $21,023
- Equity at exit
- $57,587
- IRR
- 12.6%
- Equity multiple
- 3.06×
- Total profit
- $66,422
- Equity at exit
- $93,619
Cash invested: $32,200 (down + closing). Projections, not guarantees.
Landlord ↔ Tenant lean methodology
- Overall (STATE)
- 87 Strongly Landlord-Friendly
- State Texas
- 87 Strongly Landlord-Friendly · R+5
- County
- — inherits STATE
- City
- — inherits STATE
ZIP-level market 77026
- Home prices YoY
- 1.5%
- Rents YoY
- 3.1%
- Active inventory
- 445
- Price-to-rent
- 8.4×
Monthly cashflow live
- Estimated rent
- $1,139 high interval (Pro) →
- Mortgage (P&I)
- −$603
- Tax from tax record
- −$226 /mo · $2,706/yr
- Insurance
- −$48
- HOA
- −$0
- Vacancy / Maint / Mgmt
- −$239
- Net cashflow
- $23
Break-even live
UW: 25.0% down · 7.5% · 30yr · 1.5% tax · 5.0% vac · 8.0% maint · 8.0% mgmt
Financing live
Cash to close
- Down payment
- $28,750
- Closing costs
- $3,450
- Reserves months
- —
- Total cash needed
- —
Loan-product check · same deal, 3 products live
Conventional
25% down · 7.5% · 30yr
- Down + closing
- —
- Monthly P&I
- —
- Monthly cashflow
- —
- DSCR
- —
- Eligible?
- —
Personal DTI + credit; lowest rate.
DSCR
20% down · 8.5% · 30yr
- Down + closing
- —
- Monthly P&I
- —
- Monthly cashflow
- —
- DSCR
- —
- Eligible?
- —
No personal income docs; deal must DSCR.
Hard money
10% down · 12.0% · 12mo
- Down + closing
- —
- Monthly P&I
- —
- Monthly cashflow
- —
- DSCR
- —
- Eligible?
- —
Short-term bridge; refi at stabilization.
Rent comps 28 comps
| Address | Beds | Baths | Sqft | Rent | $/sqft | DOM | Units | Dist |
|---|---|---|---|---|---|---|---|---|
| 3502 Campbell St Houston, TX | 2.0 | 1.0 | 725 | $800 | $1.10 | 44d | 1 | 0.44mi |
| 3031 Sumpter St Unit 50 Houston, TX | 2.0 | 1.0 | 732 | $1,200 | $1.64 | 24d | 1 | 0.67mi |
| 4203 Hirsch Rd Unit 5 Houston, TX | 2.0 | 1.0 | 758 | $950 | $1.25 | 44d | 1 | 0.76mi |
| 3805 Wipprecht St Houston, TX | 2.0 | 1.0 | 768 | $1,100 | $1.43 | 19d | 1 | 0.84mi |
| 3813 Wipprecht St Houston, TX | 2.0 | 1.0 | 750 | $1,200 | $1.60 | 24d | 1 | 0.85mi |
| 4111 Cavalcade St Unit 5 Houston, TX | 2.0 | 1.0 | 757 | $825 | $1.09 | 44d | 1 | 0.87mi |
| 3806 Wipprecht St Houston, TX | 1.0 | 1.0 | 750 | $700 | $0.93 | 14d | 1 | 0.88mi |
| 3814 Wipprecht St Unit 18B Houston, TX | 1.0 | 1.0 | 750 | $700 | $0.93 | 16d | 1 | 0.88mi |
| 3730 Lyons Ave Unit 216 Houston, TX | 3.0 | 2.0 | 1107 | $1,300 | $1.17 | 44d | 1 | 0.93mi |
| 1513 Cage St Houston, TX | 3.0 | 2.0 | 1467 | $1,550 | $1.06 | 44d | 1 | 0.98mi |
| 4711 Sayers St Unit A Houston, TX | 2.0 | 1.0 | 1200 | $1,650 | $1.38 | 44d | 1 | 1.02mi |
| 1714 Mary St Houston, TX | 2.0 | 2.0 | 1100 | $2,400 | $2.18 | 44d | 1 | 1.07mi |
| 5504 Morwood St Houston, TX | 2.0 | 1.0 | 749 | $850 | $1.13 | 24d | 1 | 1.23mi |
| 5436 Makeig St Houston, TX | 2.0 | 1.0 | 749 | $650 | $0.87 | 24d | 1 | 1.24mi |
| 5430 Makeig St Houston, TX | 2.0 | 1.0 | 749 | $650 | $0.87 | 24d | 1 | 1.25mi |
| 5510 Morwood St Houston, TX | 2.0 | 1.0 | 749 | $650 | $0.87 | 24d | 1 | 1.25mi |
| 2704 Sam Wilson St Unit 1391353P Houston, TX | 2.0 | 2.0 | 1001 | $1,916 | $1.91 | 8d | 1 | 1.27mi |
| 5514 Morgood St Houston, TX | 2.0 | 1.0 | 749 | $650 | $0.87 | 44d | 1 | 1.27mi |
| 5462 Makeig St Houston, TX | 2.0 | 1.0 | 749 | $650 | $0.87 | 24d | 1 | 1.27mi |
| 3816 Gano St Unit B Houston, TX | 1.0 | 1.0 | 700 | $1,150 | $1.64 | 44d | 1 | 1.27mi |
| 2209 Gano St Unit 3 Houston, TX | 2.0 | 1.0 | 700 | $1,200 | $1.71 | 44d | 1 | 1.29mi |
| 2209 Gano St Unit 4 Houston, TX | 2.0 | 1.0 | 700 | $1,250 | $1.79 | 44d | 1 | 1.29mi |
| 5506 Crane St Apt 2 Houston, TX | 2.0 | 1.0 | 800 | $750 | $0.94 | 44d | 1 | 1.32mi |
| 5605 Mulvey St Unit 1019610P Houston, TX | 3.0 | 2.5 | 1410 | $4,237 | $3.00 | 3d | 1 | 1.37mi |
| 2105 Sam Wilson St Houston, TX | 3.0 | 2.5 | 1416 | $6,750 | $4.77 | 44d | 1 | 1.37mi |
| 2516 Ivy St Houston, TX | 3.0 | 1.0 | 1200 | $1,500 | $1.25 | 44d | 1 | 1.38mi |
| 914 Bunton St Houston, TX | 3.0 | 2.0 | 1389 | $1,950 | $1.40 | 44d | 1 | 1.44mi |
| 1556 Leona St Houston, TX | 1.0 | 1.0 | 905 | $1,505 | $1.66 | 44d | 1 | 1.45mi |
Listing history 17 events
-
2026-06-18days on market $115,000 Active 87 DOM
-
2026-06-17days on market $115,000 Active 86 DOM
-
2026-06-16days on market $115,000 Active 85 DOM
-
2026-06-15days on market $115,000 Active 84 DOM
-
2026-06-13days on market $115,000 Active 82 DOM
-
2026-06-10days on market $115,000 Active 78 DOM
-
2026-06-08days on market $115,000 Active 77 DOM
-
2026-06-07pricedays on market $115,000 Active 76 DOM
-
2026-06-04days on market $135,000 Active 73 DOM
-
2026-06-01days on market $135,000 Active 70 DOM
-
2026-05-31days on market $135,000 Active 69 DOM
-
2026-04-13price $135,000 420-char remark
Show marketing remark (420 chars)
INVESTOR SPECIAL – PRIME LOCATION Opportunity is knocking! This 2 bed, 1 bath home is located just minutes from Downtown Houston and surrounded by ongoing redevelopment and new construction. This property offers strong upside potential for investors, flippers, or buyers looking to renovate and build equity. No HOA provides added flexibility, with easy access to I-10, I-69, and 610. Schedule your showing today!
-
2026-03-23$155,000 Active 420-char remark
Show marketing remark (420 chars)
INVESTOR SPECIAL – PRIME LOCATION Opportunity is knocking! This 2 bed, 1 bath home is located just minutes from Downtown Houston and surrounded by ongoing redevelopment and new construction. This property offers strong upside potential for investors, flippers, or buyers looking to renovate and build equity. No HOA provides added flexibility, with easy access to I-10, I-69, and 610. Schedule your showing today!
-
2026-02-10historical
-
2026-02-09$107,999 Active
-
2005-08-31soldstatus
-
2005-02-02soldstatus $22,800
ⓘ Source: listings_history table (triggers on properties + properties_extension) + one-shot
backfill from property_details.listing_events for pre-trigger history.
Tax reassessment forecast TX · Resets to sale price
- Current annual tax
- $2,706 · $226/mo
- Projected year-2 tax
- $2,706 · $226/mo
- Expected delta
- $0/yr ($0/mo · 0.0%)
ⓘ Screening estimate from a state-policy table — verify with the county assessor before closing.
Climate risk First Street
- Flood 1/10 Low FEMA zone X (shaded) · 0% chance over 30 yrs
- Wildfire 1/10 Low
- Heat 9/10 Extreme 7 d/yr ≥109°F today · 23 d/yr by 30 yrs out
- Wind 9/10 Extreme 99% chance of damaging wind over 30 yrs
- Air quality 3/10 Moderate 2 unhealthy d/yr today · 3 by 30 yrs out
Nearby sold comps map
Loading sold comps map…
Walkable amenities ~0.75 mi
Loading nearby amenities…
Taxation est. · year 1
- Rental income
- $13,668
- − Mortgage interest
- −$6,442
- − Property taxes
- −$2,706
- − Insurance
- −$575
- − Repairs & maintenance
- −$1,093
- − Management
- −$1,093
- − Depreciation
- −$3,345
- Taxable loss
- −$1,587
- Est. tax savings @ 24.0%
- +$381
- After-tax cash flow
- $661/yr
For passive investors: Depreciation is non-cash, so a rental often shows a tax loss while cash-flowing — sheltering income. Rental losses are passive: they offset passive income freely, and up to $25,000/yr can offset ordinary (W-2) income if you actively participate and your MAGI is under $100k (phasing out to $0 by $150k); unused losses carry forward. On sale, claimed depreciation is recaptured at up to 25%, and gains may owe capital-gains tax (a 1031 exchange can defer both). Figures are a year-1 estimate at your 24.0% rate — not tax advice; consult a CPA.
Schools (NCES district)
- District
- Houston ISD
- NCES district ID
- 4823640
- Math proficiency
- 27% ▼ -18.00%
- Reading proficiency
- 35% ▼ -6.00%
- Median HH income
- $46,054
- Composite
- 26.63/100
- National rank
- #7173
- State rank
- #593 of 826 in TX
Livability — Houston
- Score
- 74/100
- State rank
- #184
- US rank
- #4771
Category grades
Schools grade is shown separately in the Schools card above.
Census & demographics
- Census place
- Houston, TX
- County
- Harris County · 4,702,590 people
- City population
- 3,226,434
- Metro
- Houston-The Woodlands-Sugar Land, TX
- Population (ZIP)
- 21,981
- Household income
- $39,211
- Rent vs Own
- Severe rent burden
- 1531.0
Population outlook (Harris County) Hauer SSP2
- Today (2025)
- 5,571,493 people
- By 2030
- 6,089,821 · +9.3%
- By 2040
- 7,142,806 · +28.2%
- By 2050
- 8,185,864 · +46.9%
- By 2075
- 10,574,329 · +89.8%
- By 2100
- 12,109,958 · +117.4%
Race, ethnicity, and origin ACS 2023
- Neighborhood character
- Diverse neighborhood (Simpson 0.56)
- Race & ethnicity
- Black 49% Hispanic / Latino 44% Two or more races 18% White 5% Native American 1%
- Hispanic origin (detail)
- Mexican 34%
- Common ancestry
- Lithuanian 1%
- Foreign-born
- 15% · Canada
- Languages at home
- 61% English-only · Spanish 39%
Political lean MEDSL · Harris
- 2024 margin
- Lean D (+5.5) · D 52.0% · R 46.4% · Other 1.6%
- 2008→2024 swing
- +3.9pp toward D · 2008: 1.6pp · 2024: 5.5pp
- All cycles
- 2024: D+5.5 2020: D+13.3 2016: D+12.4 2012: D+0.1 2008: D+1.6
Not yet ingested
- Civics
- —
Market trends
- HPI YoY
- ▲ 3.89%
- Current HPI
- 267.5995
- Rent YoY
- ▲ 3.08%
- Metro
- Houston-The Woodlands-Sugar Land, TX
- State GDP YoY
- ▲ 3.95%
- F500 in state
- 110
Industry mix (Fortune 500 HQ in TX)
| Industry | F500 HQs | Revenue |
|---|---|---|
| Energy | 16 | $1,198B |
|
||
| Technology | 5 | $198B |
|
||
| Engineering / Construction | 4 | $72B |
|
||
| Energy Services | 3 | $60B |
|
||
| Utilities | 3 | $41B |
|
||
| Healthcare | 2 | $330B |
|
||
Price history
+492.1% since first listed6 events — show timeline
- 2026-04-13 Price Changed $135,000 HARMLS
- 2026-03-23 Listed $155,000 HARMLS
- 2026-02-10 Listing Removed — HARMLS
- 2026-02-09 Listed $107,999 HARMLS
- 2005-08-31 Sold (Public Records) — Public Records
- 2005-02-02 Sold (Public Records) $22,800 Public Records
Property tax history
+13.0%/yrLatest (2025): $2,706 · +7.7% YoY. Source: county tax records.
Cash-flow waterfall
monthlySold comps — $/sqft
last 12 mo · ≤1 miLoading sold comps…