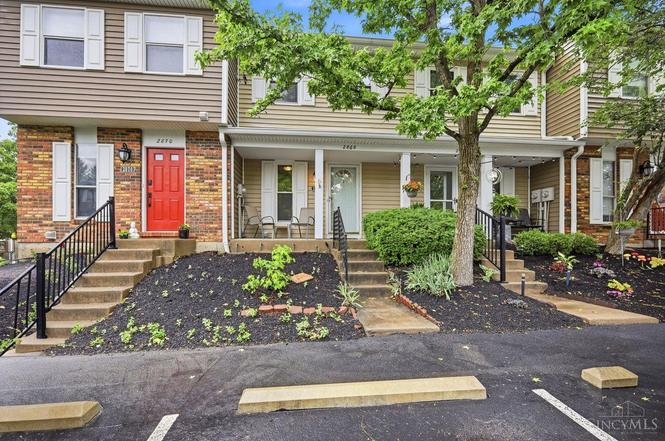
2868 Millbank Row · Landen, OH
Flood risk 1/10 · Minimal
- FEMA flood zone
- X (unshaded)
- Chance of flooding over 30 yrs
- 0.0%
- Est. flood insurance / yr
- $473 – $860
Fire risk 1/10 · Minimal
- Est. fire insurance / yr
- $713 – $1,323
Heat risk 4/10 · Minor
- Hot days now (above 102°F)
- 7 days/yr
- Hot days in 30 yrs
- 20 days/yr
Wind risk 2/10 · Minimal
- Chance of severe wind over 30 yrs
- 1.0%
Air-quality risk 4/10 · Minor
- Unhealthy air days now
- 5 days/yr
- Unhealthy air days in 30 yrs
- 7 days/yr
Risk factors via First Street. Map © Google.
Why this score? — see what drove the D+ grade
The composite is a weighted blend of 9 inputs, each scored 0–100. Each bar is that input's sub-score; the figure is the points it added to the 100-point composite (weight × sub-score).
- Appreciation +10.0/10.0
- Cash flow +9.6/30.0
- Schools +6.7/10.0
- 1% rule +4.4/10.0
- Rent growth +4.4/5.0
- Livability +4.0/5.0
- DSCR +2.7/10.0
- Condition / age +2.5/5.0
- ARV discount +2.1/15.0
$210,000
🖨 Deal sheet 📄 Offer letter ✓ Due diligence
Listing remarks MLS
Estate Sale..Sold AS-IS. Newer AC 2010, windows 2008
Key facts
- Play area
- Private walkout
- Tennis
Tags
Property features AI
Finance
- Other: Zoned residential
- HOA & community: HOA membership (Montgomery Hills); Monthly association fee of $283; Annual association component $238.27; Association amenities include pool, tennis, play area, walking trails and professional management
Exterior
- Parking: 1 assigned parking space; On-street parking available
- Utilities: Public water; Public sewer; Electric power
- Home design: Traditional townhouse-style unit; Private entry; Entry level: 1; Unit spans multiple levels (3); Building has two levels
- Construction: Composition roof; Poured foundation; Construction materials: Other; Windows are insulated; Levels in unit: Three; Levels in building: One
- Exterior features: Deck; Patio
Interior
- Kitchen: Counter bar; Wood cabinets; Dishwasher; Garbage disposal; Microwave; Oven/Range; Refrigerator
- Bedrooms: 2 bedrooms total; Primary bedroom on level 2, approximately 12 x 14; Second bedroom on level 2, approximately 10 x 11
- Flooring: Laminate flooring in living and dining areas and basement
- Bathrooms: 1 full bathroom (level 2); 2 half bathrooms (one on level 1 and one on the lower level)
- Heating & cooling: Electric heating; Central air conditioning; Electric water heating
- Interior features: 5 total rooms; Finished walkout basement; Window treatments; Private entry; Pets allowed; Laundry in unit
- Laundry & utility: Laundry in unit
Neighborhood map
What this means for you Summary
Snapshot
- This is a 2-bed/1.5-bath townhouse listed at $210k.
Deal economics
- At list price, monthly cash flow is $-140 ($-2k/yr) — negative.
- To cash-flow at today's rent, offer at most $185k (11.8% below list).
- To meet the 1% rule (rent ≥ 1% of price), the offer needs to be $196k (6.4% below list).
- Recommended offer: $185k (11.8% below list) — sets the bar for cash-flow.
- Cap rate 5.5% vs local median 3.8% in Landen — top-decile yield for the area; either an underpriced asset or a hidden risk that comps aren't pricing in. Stress-test before assuming the spread holds.
Location & tenants
- Location reads 80/100 on livability (#121 in OH, #1,779 nationally) — a professional / high-income tenant draw. Strengths: crime A+, employment A+, cost of living A+; Watch: amenities D, commute F.
- Kings Local (suburban): math 76% / reading 78% proficiency, ranked #61 of 656 in OH (top 9%) — strong family-tenant draw, lease renewals of 3-5y typical; only 16% free/reduced lunch — higher-income household profile.
- Market conditions: Rents rising fast (+7.4%/yr); 126 active listings in the ZIP; 10 comparable units currently listed for rent nearby; rentals leasing fast (median 2d on market — plan ~1-2 weeks tenant-placement turnaround); solid renter incomes; 1,224 units permitted in Warren County in 2024 (474 in 5+ unit buildings).
Forward outlook
- In year one you build about $22k of equity ($1k loan paydown + $21k appreciation (10.0% local appreciation)).
- Warren County population projected at +16% by 2050 — long-run rental-demand tailwind backs the buy-and-hold thesis.
- By year 2, paydown + projected appreciation supports a ~$36k cash-out refi (75% LTV) — recoverable capital for the next deal without selling this one.
Negotiation context
- Only 7 days on market — expect competitive offers; lowballing is unlikely to land.
- 2 sale attempts since 14y ago with the ask held roughly flat each time — persistent listings suggest the price (not the market) is what's stuck; bring a comps-based counter.
- Current owner paid $127k; list at $210k implies a 66% gain — meaningful room to come down on a strong offer.
Questions for the listing agent
- What do current leases actually rent for vs. the listed asking? Can we see a recent rent roll and the last 12 months of T-12 income?
- What does the HOA fee cover, when was the last increase, and are there any pending special assessments or reserve-fund shortfalls?
- Is there a deadline driving the sale (1031 exchange, divorce, estate, relocation)? That informs how much negotiation room exists.
- Schools are B-rated — typically a magnet for longer-tenancy family renters. What's the average tenant stay here, and is there a school-zone premium baked into asking?
- The area grade is low — what's the realistic commute time and amenity access for the typical tenant pool here? Any planned neighborhood developments (good or bad) we should know about?
- What's the average days-on-market for RENTAL listings here right now (not sales)? A rising rental-DOM trend means longer vacancies and softer asking-rent achievability than the comps imply.
- What's the recent tenant-quality profile in this submarket — average credit score on applications, eviction rate, late-payment / NSF rate, and stable-employment percentage? A property-management company in the area should have these aggregated.
- How much new for-sale + rental construction is in the pipeline within 1–3 miles? Heavy new supply typically softens prices + rents 12–24 months out; constrained supply supports both.
Investment metrics
- 1% rule
- 0.94% ✗
- Cap rate
- 5.49%
- Cash-on-cash
- -2.87%
- DSCR
- 0.87
- GRM
- 8.9
CMA / ARV
- ARV (on-the-fly)
- $187,680
- Comps found
- 7
Show comp detail 7 sales within ~0.75 mi
| Address | Dist | Beds/Ba | Sqft | Sold | Price | $/sf | Match |
|---|---|---|---|---|---|---|---|
| 2900 Millbank Row | 0.03mi | 2/1.5 | 1,020 (0%) | 21mo | $188,000 | $184 | 81 |
| 2954 Mossy Brink Ct | 0.06mi | 2/1.5 | 930 (-9%) | 10mo | $174,000 | $187 | 74 |
| 8507 Island Pines Pl #7 | 0.30mi | 2/2.0 | 1,025 (+0%) | 13mo | $180,000 | $176 | 72 |
| 8480 Island Pines Pl #6 | 0.36mi | 2/2.0 | 1,025 (+0%) | 12mo | $210,000 | $205 | 70 |
| 8500 Island Pines Pl #7 | 0.35mi | 2/2.0 | 1,025 (+0%) | 13mo | $185,000 | $180 | 70 |
| 8507 Island Pines Pl #1 | 0.30mi | 2/2.0 | 1,025 (+0%) | 22mo | $180,000 | $176 | 65 |
| 9615 Greenery Ct | 0.51mi | 2/2.0 | 1,130 (+11%) | 11mo | $250,000 | $221 | 47 |
Match score weights: distance 35% · size 25% · config 20% · recency 20%. Top-matched comps best support the ARV.
Projected returns pro-forma
10.0% appreciation · 7.42% rent growth · sell at horizon
- IRR
- 23.9%
- Equity multiple
- 2.95×
- Total profit
- $114,735
- Equity at exit
- $189,185
- IRR
- 22.6%
- Equity multiple
- 7.25×
- Total profit
- $367,368
- Equity at exit
- $407,984
Cash invested: $58,800 (down + closing). Projections, not guarantees.
Landlord ↔ Tenant lean methodology
- Overall (STATE)
- 73 Landlord-Friendly
- State Ohio
- 73 Landlord-Friendly · R+6
- County
- — inherits STATE
- City
- — inherits STATE
ZIP-level market 45039
- Home prices YoY
- 7.3%
- Rents YoY
- 7.4%
- Active inventory
- 126
- Price-to-rent
- 8.9×
Monthly cashflow live
- Estimated rent
- $1,965 high interval (Pro) →
- Mortgage (P&I)
- −$1,101
- Tax from tax record
- −$202 /mo · $2,422/yr
- Insurance
- −$88
- HOA
- −$302
- Vacancy / Maint / Mgmt
- −$413
- Net cashflow
- $-140
Break-even live
UW: 25.0% down · 7.5% · 30yr · 1.5% tax · 5.0% vac · 8.0% maint · 8.0% mgmt
Financing live
Cash to close
- Down payment
- $52,500
- Closing costs
- $6,300
- Reserves months
- —
- Total cash needed
- —
Loan-product check · same deal, 3 products live
Conventional
25% down · 7.5% · 30yr
- Down + closing
- —
- Monthly P&I
- —
- Monthly cashflow
- —
- DSCR
- —
- Eligible?
- —
Personal DTI + credit; lowest rate.
DSCR
20% down · 8.5% · 30yr
- Down + closing
- —
- Monthly P&I
- —
- Monthly cashflow
- —
- DSCR
- —
- Eligible?
- —
No personal income docs; deal must DSCR.
Hard money
10% down · 12.0% · 12mo
- Down + closing
- —
- Monthly P&I
- —
- Monthly cashflow
- —
- DSCR
- —
- Eligible?
- —
Short-term bridge; refi at stabilization.
Rent comps 10 comps
| Address | Beds | Baths | Sqft | Rent | $/sqft | DOM | Units | Dist |
|---|---|---|---|---|---|---|---|---|
| 2930 Millbank Row Maineville, OH | 2.0 | 3.0 | 1020 | $2,000 | $1.96 | 23d | 1 | 0.05mi |
| 8507 Island Pines Pl Apt 8 Maineville, OH | 2.0 | 2.0 | 1100 | $1,575 | $1.43 | 23d | 1 | 0.28mi |
| 8390 Old Orchard Ln Maineville, OH | 1.0–3.0 | 1.0–2.0 | 975 | $1,822 | $1.87 | 1d | 20 | 0.35mi |
| 2313 Rose Rd Loveland, OH | 3.0 | 2.0 | 1496 | $2,331 | $1.56 | 43d | 1 | 0.60mi |
| 8224 Rollinghitch Ct Maineville, OH | 3.0 | 1.5 | 1261 | $1,900 | $1.51 | 16d | 1 | 0.64mi |
| 3569 Nantucket Cir Loveland, OH | 1.0–3.0 | 1.0–2.5 | 1070 | $2,018 | $1.88 | 1d | 21 | 0.85mi |
| 3580 Steeplechase Ln Loveland, OH | 1.0–2.0 | 1.0–2.0 | 864 | $1,780 | $2.06 | 1d | 12 | 1.14mi |
| 9980 Hanover Way Loveland, OH | 1.0–3.0 | 1.0–2.5 | 1230 | $1,926 | $1.57 | 1d | 21 | 1.37mi |
| 7401 Landen Falls Dr Maineville, OH | 1.0–3.0 | 1.0–2.0 | 1125 | $2,036 | $1.81 | 1d | 15 | 1.37mi |
| 7411 Clubhouse Dr Maineville, OH | 2.0 | 2.0 | 1000 | $1,638 | $1.64 | 1d | 15 | 1.49mi |
HOA detail
- Monthly dues
- $302 · $3,624/yr
Listing history 7 events
-
2026-06-18days on market $210,000 Active 7 DOM
-
2026-06-17days on market $210,000 Active 6 DOM
-
2026-06-16days on market $210,000 Active 5 DOM
-
2026-06-15days on market $210,000 Active 4 DOM
-
2026-06-13days on market $210,000 Active 2 DOM
-
2026-06-13remarks 699-char remark
-
2026-06-13$210,000 Active 1 DOM
ⓘ Source: listings_history table (triggers on properties + properties_extension) + one-shot
backfill from property_details.listing_events for pre-trigger history.
Tax reassessment forecast OH · Partial reset (capped growth)
- Current annual tax
- $2,422 · $202/mo
- Projected year-2 tax
- $2,849 · $237/mo
- Expected delta
- +$427/yr (+$36/mo · 17.6%)
ⓘ Screening estimate from a state-policy table — verify with the county assessor before closing.
Climate risk First Street
- Flood 1/10 Low FEMA zone X (unshaded) · 0% chance over 30 yrs
- Wildfire 1/10 Low
- Heat 4/10 Moderate 7 d/yr ≥102°F today · 20 d/yr by 30 yrs out
- Wind 2/10 Low 100% chance of damaging wind over 30 yrs
- Air quality 4/10 Moderate 5 unhealthy d/yr today · 7 by 30 yrs out
Nearby sold comps map
Loading sold comps map…
Walkable amenities ~0.75 mi
Loading nearby amenities…
Taxation est. · year 1
- Rental income
- $23,578
- − Mortgage interest
- −$11,763
- − Property taxes
- −$2,422
- − Insurance
- −$1,050
- − Repairs & maintenance
- −$1,886
- − Management
- −$1,886
- − HOA
- −$3,624
- − Depreciation
- −$6,109
- Taxable loss
- −$5,163
- Est. tax savings @ 24.0%
- +$1,239
- After-tax cash flow
- $-446/yr
For passive investors: Depreciation is non-cash, so a rental often shows a tax loss while cash-flowing — sheltering income. Rental losses are passive: they offset passive income freely, and up to $25,000/yr can offset ordinary (W-2) income if you actively participate and your MAGI is under $100k (phasing out to $0 by $150k); unused losses carry forward. On sale, claimed depreciation is recaptured at up to 25%, and gains may owe capital-gains tax (a 1031 exchange can defer both). Figures are a year-1 estimate at your 24.0% rate — not tax advice; consult a CPA.
Schools (NCES district)
- District
- Kings Local
- NCES district ID
- 3905043
- Math proficiency
- 76% ▼ -6.00%
- Reading proficiency
- 78% ▼ -4.00%
- Median HH income
- $70,803
- Composite
- 67.16/100
- National rank
- #390
- State rank
- #61 of 656 in OH
Livability — Landen
- Score
- 80/100
- State rank
- #121
- US rank
- #1779
Category grades
Schools grade is shown separately in the Schools card above.
Census & demographics
- Census place
- Landen, OH
- County
- Warren County · 196,906 people
- City population
- 7,053
- Metro
- Cincinnati, OH-KY-IN
- Population (ZIP)
- 28,335
- Household income
- $108,794
- Rent vs Own
- Severe rent burden
- 307.0
Population outlook (Warren County) Hauer SSP2
- Today (2025)
- 248,603 people
- By 2030
- 259,345 · +4.3%
- By 2040
- 277,666 · +11.7%
- By 2050
- 289,599 · +16.5%
- By 2075
- 311,681 · +25.4%
- By 2100
- 302,738 · +21.8%
Race, ethnicity, and origin ACS 2023
- Neighborhood character
- Predominantly White (88%)
- Race & ethnicity
- White 88% Hispanic / Latino 5% Two or more races 5% Asian 3% Black 2%
- Common ancestry
- Romanian 2% Scotch-Irish 2% Lithuanian 2%
- Foreign-born
- 8% · Canada, Jamaica
- Languages at home
- 92% English-only · Spanish 3% Russian/Polish/Slavic 2% Other Indo-European 1%
Political lean MEDSL · Warren
- 2024 margin
- Solid R (+31.5) · D 33.8% · R 65.3%
- 2008→2024 swing
- +4.5pp toward D · 2008: -36.1pp · 2024: -31.5pp
- All cycles
- 2024: R+31.5 2020: R+30.8 2016: R+37.6 2012: R+39.5 2008: R+36.1
Not yet ingested
- Civics
- —
Market trends
- HPI YoY
- ▲ 38.63%
- Current HPI
- 568.09
- Rent YoY
- ▲ 7.42%
- Metro
- Cincinnati, OH-KY-IN
- State GDP YoY
- ▲ 1.98%
- F500 in state
- 48
Industry mix (Fortune 500 HQ in OH)
| Industry | F500 HQs | Revenue |
|---|---|---|
| Insurance | 3 | $145B |
|
||
| Industrial Machinery | 3 | $49B |
|
||
| Financial Services | 3 | $24B |
|
||
| Consumer Goods | 2 | $93B |
|
||
| Aerospace / Defense | 2 | $47B |
|
||
| Utilities | 2 | $33B |
|
||
Price history
+281.8% since first listed6 events — show timeline
- 2026-06-11 Listed $210,000 Cincy MLS
- 2021-09-15 Sold (Public Records) $126,700 Public Records
- 2012-08-28 Sold (Public Records) $55,000 Public Records
- 2012-08-22 Sold (MLS) $55,000 Cincy MLS
- 2012-07-23 Listed $57,000 Cincy MLS
- 1988-04-06 Sold (Public Records) $55,000 Public Records
Property tax history
+8.4%/yrLatest (2025): $2,422 · -1.9% YoY. Source: county tax records.
Cash-flow waterfall
monthlySold comps — $/sqft
last 12 mo · ≤1 miLoading sold comps…