None · Cool Valley, MO
Flood risk 1/10 · Minimal
- FEMA flood zone
- X (unshaded)
- Chance of flooding over 30 yrs
- 0.0%
- Est. flood insurance / yr
- $473 – $860
Fire risk 1/10 · Minimal
- Est. fire insurance / yr
- $1,054 – $1,958
Heat risk 5/10 · Moderate
- Hot days now (above 107°F)
- 7 days/yr
- Hot days in 30 yrs
- 21 days/yr
Wind risk 2/10 · Minimal
- Chance of severe wind over 30 yrs
- 1.0%
Air-quality risk 4/10 · Minor
- Unhealthy air days now
- 4 days/yr
- Unhealthy air days in 30 yrs
- 5 days/yr
Risk factors via First Street. Map © Google.
Why this score? — see what drove the D grade
The composite is a weighted blend of 9 inputs, each scored 0–100. Each bar is that input's sub-score; the figure is the points it added to the 100-point composite (weight × sub-score).
- Cash flow +20.3/30.0
- DSCR +6.4/10.0
- 1% rule +5.1/10.0
- Rent growth +3.8/5.0
- Livability +3.6/5.0
- Condition / age +2.5/5.0
- Schools +1.2/10.0
- ARV discount +0.0/15.0
- Appreciation +0.0/10.0
$135,000
🖨 Deal sheet (PDF) 📄 Offer letter ✓ Due diligence
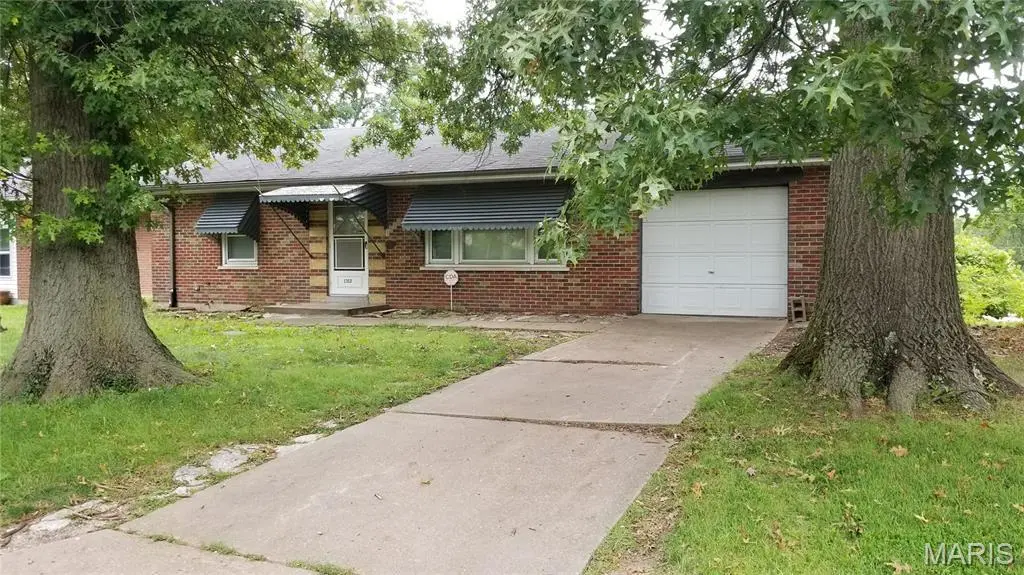
Listing remarks MLS
Great investment opportunity! 3 bedroom 2 full bath brick ranch home, less than 2 miles from UMSL. Would make a great college rental. Spacious living room with huge family room addition in the back. Larger inside than it looks from the road. 1 car garage. Basement is partially finished with a full bath. Newer furnace. Don't wait on this one!
Key facts
- 8,102 sq ft lot
- Garage
- Built 1955
Property features AI
Finance
- Other: Private ownership; No pool
- Financial info: Seller may consider concessions; Lease not considered
Exterior
- Parking: Attached garage (1 car)
- Utilities: Public water; Public sewer; Electric service by Ameren; Electricity, natural gas, and water connected
- Home design: Single family residence; Private ownership; One-story house; Basement entry level; Above-grade finished living area: 1,404 (per public records)
- Construction: Brick construction; Architectural shingle roof; Concrete perimeter foundation; Basement (concrete)
- Exterior features: Back yard fencing; Back yard and front yard; Some trees; Adjoins government land
Interior
- Kitchen: Refrigerator
- Bedrooms: Three bedrooms (all on the main level)
- Flooring: Wood flooring; Linoleum flooring
- Bathrooms: Two full bathrooms
- Heating & cooling: Forced air heating; Central air conditioning
- Interior features: Refrigerator included; Basement with concrete construction
- Laundry & utility: Utilities connected: electricity, natural gas, water
Neighborhood map
What this means for you Summary
Snapshot
- This is a 3-bed/1.5-bath single-family listed at $135k.
Deal economics
- At list price, monthly cash flow is $173 ($2k/yr) — positive.
- The deal already cash-flows at list — no discount required.
- Meets the 1% rule at list price ($1k rent vs $135k).
- Recommended offer: $131k (3.0% below list) — sets the bar for market timing.
Location & tenants
- Location reads 71/100 on livability (#116 in MO) — a middle-class / working-renter tenant base. Strengths: commute A+, cost of living A+, housing A+; Watch: amenities F, health & safety F.
- Ferguson-Florissant R-II (suburban): math 7% / reading 20% proficiency, ranked #311 of 324 in MO (top 96%) — low school quality limits family demand, transient renter base, plan for 1-2y turnover; 70% free/reduced lunch — lower-income household profile, screen leases tightly.
- Zoned schools: Mccluer High (math 0% / reading 17%, grade F, #511 of 521 statewide, top 98%, 1,181 students, 100% FRL) — zoned schools average 100% FRL vs 70% district-wide (30 pts higher); higher-poverty schools than district average — tighter screening recommended.
- Market conditions: Rents rising fast (+5.2%/yr); 23 active listings in the ZIP; 30 comparable units currently listed for rent nearby; rentals at typical pace (median 26d on market — plan ~3-4 weeks tenant-placement turnaround); 40% of comp listings sitting > 30 days — soft ceiling on asking rent; lower-income renter base — watch delinquency; 920 units permitted in St. Louis County in 2024 (250 in 5+ unit buildings).
- This rent runs 38% of the median local income ($43k/yr) — at the standard rent-burdened threshold; future hikes will face affordability resistance.
Forward outlook
- Local home prices are declining (-3.0%/yr); year-one equity from $933 of loan paydown is wiped out by about $4k of value loss. Plan a longer hold.
Negotiation context
- It's been on market 54 days — a 3% lower offer ($131k) is reasonable based on typical stale-listing flexibility.
- 2 sale attempts since 7y ago with the ask held roughly flat each time — persistent listings suggest the price (not the market) is what's stuck; bring a comps-based counter.
- Current owner paid $32k; list at $135k implies a 325% gain — meaningful room to come down on a strong offer.
Risks & watch-outs
- Watch-outs: built in 1955 — expect roof / HVAC / electrical / plumbing capex.
- Climate carrying-cost: extreme-heat days projected 7→21/yr by 2055 (HVAC capex compounding) — expect insurance premiums to compound above CPI over the hold.
Questions for the listing agent
- It's been on market 54 days. Have you received any prior offers? Is the seller open to a 3% concession, seller financing, or rate buy-down credit?
- Built in 1955 — when were the roof, HVAC, electrical panel, plumbing, and water heater last replaced?
- Is there a deadline driving the sale (1031 exchange, divorce, estate, relocation)? That informs how much negotiation room exists.
- Schools are D-rated, which usually means shorter tenancies and higher turnover. Who's the typical renter profile here, and what's been the actual vacancy rate?
- The area grade is low — what's the realistic commute time and amenity access for the typical tenant pool here? Any planned neighborhood developments (good or bad) we should know about?
- What's the average days-on-market for RENTAL listings here right now (not sales)? A rising rental-DOM trend means longer vacancies and softer asking-rent achievability than the comps imply.
- What's the recent tenant-quality profile in this submarket — average credit score on applications, eviction rate, late-payment / NSF rate, and stable-employment percentage? A property-management company in the area should have these aggregated.
- How much new for-sale + rental construction is in the pipeline within 1–3 miles? Heavy new supply typically softens prices + rents 12–24 months out; constrained supply supports both.
Investment metrics
- 1% rule
- 1.01% ✓
- Cap rate
- 7.83%
- Cash-on-cash
- 5.49%
- DSCR
- 1.24
- GRM
- 8.2
CMA / ARV
- ARV (on-the-fly)
- $110,916
- Comps found
- 12
Show comp detail 12 sales within ~0.75 mi
| Address | Dist | Beds/Ba | Sqft | Sold | Price | $/sf | Match |
|---|---|---|---|---|---|---|---|
| 1312 Willingham Dr | 0.00mi | 3/2.0 | 1,404 (0%) | 0mo | $135,000 | $96 | 98 |
| 8445 Hawkesbury Dr | 0.37mi | 3/1.5 | 1,311 (-7%) | 5mo | $88,650 | $68 | 67 |
| 8408 Hawkesbury Dr | 0.29mi | 3/1.5 | 1,227 (-13%) | 2mo | $149,900 | $122 | 64 |
| 8307 Edna Ave | 0.46mi | 3/1.0 | 1,259 (-10%) | 4mo | $59,900 | $48 | 56 |
| 5533 Donbar Dr | 0.54mi | 4/1.5 (+1) | 1,282 (-9%) | 2mo | $180,000 | $140 | 54 |
| 1213 Haley Ave | 0.30mi | 3/2.5 | 1,196 (-15%) | 5mo | $95,000 | $79 | 53 |
| 5515 Holborn Dr | 0.70mi | 3/1.0 | 1,320 (-6%) | 3mo | $115,000 | $87 | 53 |
| 7832 Dartmoor Dr | 0.56mi | 4/1.0 (+1) | 1,296 (-8%) | 3mo | $78,900 | $61 | 52 |
| 337 Wiegel Dr | 0.51mi | 3/1.0 | 1,220 (-13%) | 7mo | $59,900 | $49 | 47 |
| 223 Wiegel Dr | 0.54mi | 3/1.0 | 1,200 (-14%) | 3mo | $95,000 | $79 | 46 |
| 6009 Bermuda Dr | 0.65mi | 4/2.0 (+1) | 1,575 (+12%) | 1mo | $110,000 | $70 | 42 |
| 230 Randolph Ave | 0.73mi | 2/1.0 (-1) | 1,243 (-12%) | 4mo | $85,000 | $68 | 37 |
Match score weights: distance 35% · size 25% · config 20% · recency 20%. Top-matched comps best support the ARV.
Projected returns pro-forma
-3.0% appreciation · 5.21% rent growth · sell at horizon
- IRR
- -5.4%
- Equity multiple
- 0.79×
- Total profit
- $-7,751
- Equity at exit
- $20,129
- IRR
- 6.7%
- Equity multiple
- 1.55×
- Total profit
- $20,813
- Equity at exit
- $11,672
Cash invested: $37,800 (down + closing). Projections, not guarantees.
Landlord ↔ Tenant lean methodology
- Overall (STATE)
- 81 Strongly Landlord-Friendly
- State Missouri
- 81 Strongly Landlord-Friendly · R+10
- County
- — inherits STATE
- City
- — inherits STATE
ZIP-level market 63121
- Rents YoY
- 5.2%
- Active inventory
- 23
- Price-to-rent
- 8.2×
Monthly cashflow live
- Estimated rent
- $1,370 high interval (Pro) →
- Mortgage (P&I)
- −$708
- Tax from tax record
- −$145 /mo · $1,742/yr
- Insurance
- −$56
- HOA
- −$0
- Vacancy / Maint / Mgmt
- −$288
- Net cashflow
- $173
Break-even live
Sensitivity live
| Price | -10% $249 | -5% $211 | +0% $173 | +5% $135 | +10% $96 |
|---|---|---|---|---|---|
| Rent | -10% $65 | -5% $119 | +0% $173 | +5% $227 | +10% $281 |
| Rate | -1.0pp $241 | -0.5pp $207 | base $173 | +0.5pp $138 | +1.0pp $102 |
UW: 25.0% down · 7.5% · 30yr · 1.5% tax · 5.0% vac · 8.0% maint · 8.0% mgmt
Financing live
Cash to close
- Down payment
- $33,750
- Closing costs
- $4,050
- Reserves months
- —
- Total cash needed
- —
Loan-product check · same deal, 3 products live
Conventional
25% down · 7.5% · 30yr
- Down + closing
- —
- Monthly P&I
- —
- Monthly cashflow
- —
- DSCR
- —
- Eligible?
- —
Personal DTI + credit; lowest rate.
DSCR
20% down · 8.5% · 30yr
- Down + closing
- —
- Monthly P&I
- —
- Monthly cashflow
- —
- DSCR
- —
- Eligible?
- —
No personal income docs; deal must DSCR.
Hard money
10% down · 12.0% · 12mo
- Down + closing
- —
- Monthly P&I
- —
- Monthly cashflow
- —
- DSCR
- —
- Eligible?
- —
Short-term bridge; refi at stabilization.
Rent comps 30 comps
| Address | Beds | Baths | Sqft | Rent | $/sqft | DOM | Units | Dist |
|---|---|---|---|---|---|---|---|---|
| 8408 Hill Ave Saint Louis, MO | 3.0 | 2.0 | 1040 | $1,550 | $1.49 | 25d | 1 | 0.20mi |
| 846 Elsworth Pl Saint Louis, MO | 4.0 | 1.0 | 1352 | $1,600 | $1.18 | 6d | 1 | 0.43mi |
| 5925 Brand Ave Saint Louis, MO | 3.0 | 1.0 | 951 | $1,200 | $1.26 | 45d | 1 | 0.48mi |
| 617 Tesmore Pl Saint Louis, MO | 2.0 | 1.0 | 877 | $1,200 | $1.37 | 45d | 1 | 0.60mi |
| 709 Suburban Ave Saint Louis, MO | 2.0 | 1.0 | 975 | $1,400 | $1.44 | 45d | 1 | 0.60mi |
| 7816 Dartmoor Dr Saint Louis, MO | 3.0 | 1.0 | 950 | $1,195 | $1.26 | 45d | 1 | 0.62mi |
| 450 S Dade Ave Saint Louis, MO | 2.0 | 1.0 | 1040 | $1,200 | $1.15 | 25d | 1 | 0.64mi |
| 7808 Winward Dr Saint Louis, MO | 3.0 | 1.0 | 1434 | $1,425 | $0.99 | 24d | 1 | 0.67mi |
| 519 Graf Ave Saint Louis, MO | 3.0 | 2.0 | 887 | $1,297 | $1.46 | 22d | 1 | 0.69mi |
| 360 S Harvey Ave Saint Louis, MO | 2.0 | 1.0 | 936 | $925 | $0.99 | 45d | 1 | 0.69mi |
| 222 Randolph Ave Saint Louis, MO | 2.0 | 1.0 | 964 | $1,400 | $1.45 | 9d | 1 | 0.71mi |
| 5830 Bermuda Dr Unit 30B St. Louis, MO | 2.0 | 1.0 | 900 | $895 | $0.99 | 25d | 1 | 0.76mi |
| 246 Louisa Ave Saint Louis, MO | 3.0 | 1.0 | 1036 | $1,600 | $1.54 | 45d | 1 | 0.76mi |
| 419 S Florissant Rd Ferguson, MO | 2.0 | 1.0 | 1100 | $1,200 | $1.09 | 45d | 1 | 0.77mi |
| 265 S Harvey Ave Saint Louis, MO | 3.0 | 1.5 | 1240 | $1,350 | $1.09 | 45d | 1 | 0.80mi |
| 110 Paul Ave Saint Louis, MO | 3.0 | 1.0 | 875 | $1,025 | $1.17 | 0d | 1 | 0.81mi |
| 6170 Emerald Ave Saint Louis, MO | 3.0 | 1.0 | 1286 | $1,500 | $1.17 | 16d | 1 | 0.86mi |
| 6170 Emerald Ave Saint Louis, MO | 3.0 | 1.0 | 1286 | $1,425 | $1.11 | 4d | 1 | 0.86mi |
| 338 Saint Louis Ave Saint Louis, MO | 3.0 | 1.0 | 1200 | $1,200 | $1.00 | 45d | 1 | 0.92mi |
| 6188 Dupree Ave Saint Louis, MO | 3.0 | 1.5 | 972 | $1,300 | $1.34 | 45d | 1 | 0.92mi |
| 224 S Harvey Ave Saint Louis, MO | 2.0 | 1.0 | 936 | $995 | $1.06 | 0d | 1 | 0.93mi |
| 249 S Hartnett Ave Saint Louis, MO | 3.0 | 1.0 | 960 | $1,220 | $1.27 | 25d | 1 | 1.19mi |
| 296 Meadowcrest Dr Saint Louis, MO | 3.0 | 1.0 | 960 | $1,550 | $1.61 | 16d | 1 | 1.20mi |
| 324 Emmett Ave Saint Louis, MO | 3.0 | 2.0 | 1357 | $1,650 | $1.22 | 25d | 1 | 1.20mi |
| 227 Meadowcrest Dr Saint Louis, MO | 3.0 | 1.0 | 960 | $1,500 | $1.56 | 45d | 1 | 1.29mi |
| 35 S Barat Ave Saint Louis, MO | 2.0 | 1.0 | 984 | $1,150 | $1.17 | 0d | 1 | 1.34mi |
| 910 Disco Dr Saint Louis, MO | 3.0 | 1.0 | 924 | $1,235 | $1.34 | 0d | 1 | 1.35mi |
| 60 Mayme Dr Saint Louis, MO | 3.0 | 1.0 | 960 | $1,225 | $1.28 | 0d | 1 | 1.38mi |
| 945 Edgehill Dr Saint Louis, MO | 3.0 | 1.0 | 1110 | $1,575 | $1.42 | 45d | 1 | 1.39mi |
| 13 N Hartnett Ave Saint Louis, MO | 3.0 | 1.0 | 1140 | $1,400 | $1.23 | 12d | 1 | 1.47mi |
Listing history 8 events
-
2026-05-31status $135,000 Pending 54 DOM
-
2026-04-12historical Active Under Contract
-
2026-04-07$135,000 Active
-
2026-04-03historical $135,000
-
2019-02-26soldstatus $31,760
-
2019-02-22soldstatus Closed 350-char remark
Show marketing remark (350 chars)
Great investment opportunity! 3 bedroom 2 full bath brick ranch home, less than 2 miles from UMSL. Would make a great college rental. Spacious living room with huge family room addition in the back. Larger inside than it looks from the road. 1 car garage. Basement is partially finished with a full bath. Newer furnace. Don't wait on this one!
-
2019-02-02status Pending 350-char remark
Show marketing remark (350 chars)
Great investment opportunity! 3 bedroom 2 full bath brick ranch home, less than 2 miles from UMSL. Would make a great college rental. Spacious living room with huge family room addition in the back. Larger inside than it looks from the road. 1 car garage. Basement is partially finished with a full bath. Newer furnace. Don't wait on this one!
-
2019-01-31$24,900 Active 350-char remark
Show marketing remark (350 chars)
Great investment opportunity! 3 bedroom 2 full bath brick ranch home, less than 2 miles from UMSL. Would make a great college rental. Spacious living room with huge family room addition in the back. Larger inside than it looks from the road. 1 car garage. Basement is partially finished with a full bath. Newer furnace. Don't wait on this one!
ⓘ Source: listings_history table (triggers on properties + properties_extension) + one-shot
backfill from property_details.listing_events for pre-trigger history.
Tax reassessment forecast MO · Resets to sale price
- Current annual tax
- $1,742 · $145/mo
- Projected year-2 tax
- $1,742 · $145/mo
- Expected delta
- $0/yr ($0/mo · 0.0%)
ⓘ Screening estimate from a state-policy table — verify with the county assessor before closing.
Climate risk First Street
- Flood 1/10 Low FEMA zone X (unshaded) · 0% chance over 30 yrs
- Wildfire 1/10 Low
- Heat 5/10 Major 7 d/yr ≥107°F today · 21 d/yr by 30 yrs out
- Wind 2/10 Low 100% chance of damaging wind over 30 yrs
- Air quality 4/10 Moderate 4 unhealthy d/yr today · 5 by 30 yrs out
Nearby sold comps map
Loading sold comps map…
Walkable amenities ~0.75 mi
Loading nearby amenities…
Taxation est. · year 1
- Rental income
- $16,438
- − Mortgage interest
- −$7,562
- − Property taxes
- −$1,742
- − Insurance
- −$675
- − Repairs & maintenance
- −$1,315
- − Management
- −$1,315
- − Depreciation
- −$3,927
- Taxable loss
- −$98
- Est. tax savings @ 24.0%
- +$24
- After-tax cash flow
- $2,097/yr
For passive investors: Depreciation is non-cash, so a rental often shows a tax loss while cash-flowing — sheltering income. Rental losses are passive: they offset passive income freely, and up to $25,000/yr can offset ordinary (W-2) income if you actively participate and your MAGI is under $100k (phasing out to $0 by $150k); unused losses carry forward. On sale, claimed depreciation is recaptured at up to 25%, and gains may owe capital-gains tax (a 1031 exchange can defer both). Figures are a year-1 estimate at your 24.0% rate — not tax advice; consult a CPA.
Schools (NCES district)
- District
- Ferguson-Florissant R-II
- NCES district ID
- 2912010
- Math proficiency
- 7% ▼ -9.00%
- Reading proficiency
- 20% ▼ -6.00%
- Median HH income
- $44,610
- Composite
- 11.96/100
- National rank
- #9666
- State rank
- #311 of 324 in MO
Livability — Cool Valley
- Score
- 71/100
- State rank
- #116
- US rank
- #7242
Category grades
Schools grade is shown separately in the Schools card above.
Census & demographics
- Census place
- Cool Valley, MO
- County
- Saint Louis County · 888,823 people
- Metro
- St. Louis, MO-IL
- Population (ZIP)
- 25,008
- Household income
- $42,701
- Rent vs Own
- Severe rent burden
- 1611.0
Population outlook (St. Louis County) Hauer SSP2
- Today (2025)
- 1,025,227 people
- By 2030
- 1,028,023 · +0.3%
- By 2040
- 1,020,940 · -0.4%
- By 2050
- 1,007,280 · -1.8%
- By 2075
- 987,277 · -3.7%
- By 2100
- 921,984 · -10.1%
Race, ethnicity, and origin ACS 2023
- Neighborhood character
- Predominantly Black (80%)
- Race & ethnicity
- Black 80% White 14% Two or more races 4% Hispanic / Latino 2% Asian 2%
- Common ancestry
- Lithuanian 1%
- Foreign-born
- 2% · Canada
- Languages at home
- 96% English-only · Spanish 2% Other Indo-European 1%
Political lean MEDSL · St. Louis
- 2024 margin
- Strong D (+23.4) · D 60.8% · R 37.4% · Other 1.7%
- 2008→2024 swing
- +3.5pp toward D · 2008: 19.9pp · 2024: 23.4pp
- All cycles
- 2024: D+23.4 2020: D+24.0 2016: D+16.2 2012: D+13.7 2008: D+19.9
Not yet ingested
- Civics
- —
Market trends
- HPI YoY
- ▼ -177.84%
- Current HPI
- 100.4494
- Rent YoY
- ▲ 5.21%
- Metro
- St. Louis, MO-IL
- State GDP YoY
- ▲ 1.84%
- F500 in state
- 20
Industry mix (Fortune 500 HQ in MO)
| Industry | F500 HQs | Revenue |
|---|---|---|
| Healthcare | 1 | $163B |
|
||
| Insurance | 1 | $21B |
|
||
| Industrial Technology | 1 | $17B |
|
||
| Retail | 1 | $16B |
|
||
| Industrial Distribution | 1 | $10B |
|
||
| Utilities | 1 | $9B |
|
||
Price history
+442.2% since first listed7 events — show timeline
- 2026-04-12 Contingent — MARIS as Distributed by MLS Grid
- 2026-04-07 Listed $135,000 MARIS as Distributed by MLS Grid
- 2026-04-03 Coming Soon $135,000 MARIS as Distributed by MLS Grid
- 2019-02-26 Sold (Public Records) $31,760 Public Records
- 2019-02-22 Sold (MLS) — MARIS as Distributed by MLS Grid
- 2019-02-02 Pending — MARIS as Distributed by MLS Grid
- 2019-01-31 Listed $24,900 MARIS as Distributed by MLS Grid
Property tax history
+4.5%/yrLatest (2022): $1,742 · +0.3% YoY. Source: county tax records.
Cash-flow waterfall
monthlySold comps — $/sqft
last 12 mo · ≤1 miLoading sold comps…