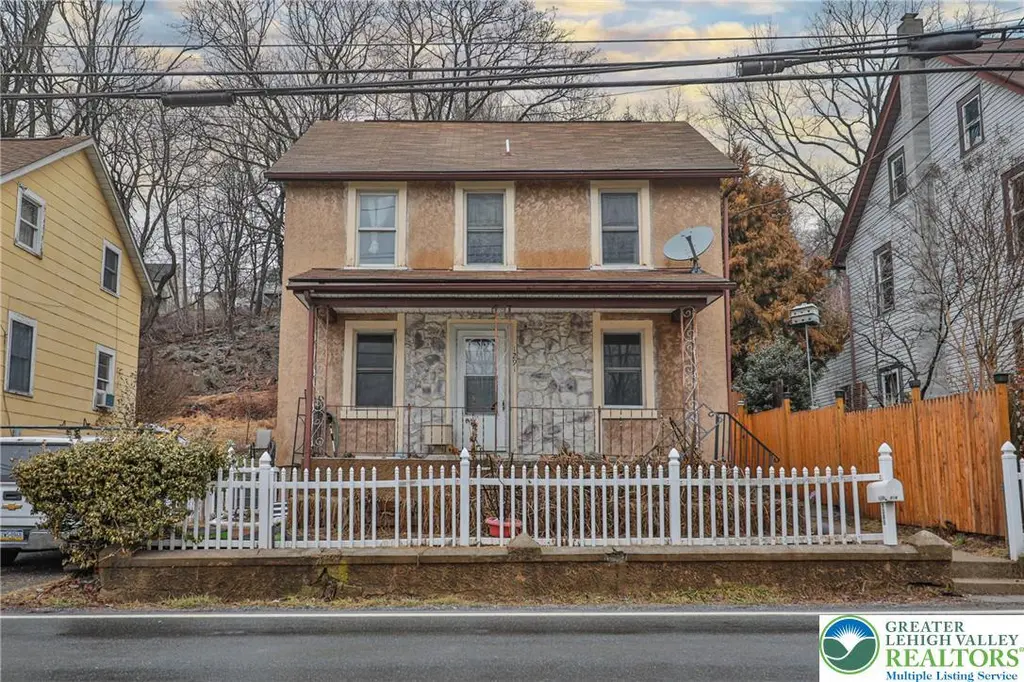
1291 Seidersville Rd · Lower Saucon, PA
Flood risk 1/10 · Minimal
- FEMA flood zone
- X (unshaded)
- Chance of flooding over 30 yrs
- 0.0%
- Est. flood insurance / yr
- $473 – $860
Fire risk 5/10 · Moderate
- Est. fire insurance / yr
- $511 – $949
Heat risk 4/10 · Minor
- Hot days now (above 100°F)
- 7 days/yr
- Hot days in 30 yrs
- 14 days/yr
Wind risk 4/10 · Minor
- Chance of severe wind over 30 yrs
- 16.0%
Air-quality risk 4/10 · Minor
- Unhealthy air days now
- 3 days/yr
- Unhealthy air days in 30 yrs
- 6 days/yr
Risk factors via First Street. Map © Google.
Why this score? — see what drove the C+ grade
The composite is a weighted blend of 9 inputs, each scored 0–100. Each bar is that input's sub-score; the figure is the points it added to the 100-point composite (weight × sub-score).
- Cash flow +20.5/30.0
- ARV discount +15.0/15.0
- DSCR +6.5/10.0
- Schools +5.4/10.0
- 1% rule +5.3/10.0
- Rent growth +4.3/5.0
- Livability +2.5/5.0
- Condition / age +2.5/5.0
- Appreciation +0.0/10.0
$180,000
🖨 Deal sheet 📄 Offer letter ✓ Due diligence
Listing remarks MLS
Welcome to this inviting single-family home located in the sought-after Saucon Valley School District. Offering a wonderful opportunity for investors or buyers looking to add their personal touch, this home combines character, potential, and an outdoor space designed for relaxation and entertaining. The home features two bedrooms on the second floor, plus a finished attic that serves as a spacious third bedroom, home office, or flex space. With a little cosmetic attention and fresh paint, this property has the potential to truly shine. All the appliances are less than 3 years old and the bathroom has been updated. Step outside and discover a backyard retreat that’s ready to enjoy. Recent improvements include newer decking, fencing, and walkway out back, creating a private and welcoming outdoor environment. The yard also features an above-ground pool, a shed for additional storage, and plenty of space for entertaining, gardening, or relaxing on summer evenings. This property needs work and is priced accordingly, making it a great opportunity for buyers who appreciate value and the chance to customize a home to their style while benefiting from a super convenient location. Close proximity to Lehigh University, Historic Bethlehem, the Casino, St Luke’s hospital, and the promenade shops, with easy access to routes 78, 378 and 309!
Key facts
- Newer decking
- Finished attic
- Fencing
Tags
Property features AI
Exterior
- Parking: Parking lot
- Utilities: Public water; Public sewer; Electric power
- Home design: 2-story property; Stone and stucco exterior; Asphalt/fiberglass roof; Above-grade living area reported
- Construction: Built with stone and stucco; Asphalt/fiberglass roof
- Exterior features: Front porch; Patio; Lot approximately 0.10 acres
Interior
- Kitchen: Kitchen island; Eat-in kitchen
- Flooring: Carpet; Laminate; Luxury vinyl / luxury vinyl plank; Resilient vinyl
- Bathrooms: 1 full bathroom
- Heating & cooling: Electric heating
- Interior features: Dining area and separate/formal dining room; Eat-in kitchen with kitchen island
- Laundry & utility: Washer hookup on main level; Dryer hookup on main level; Electric water heater
Neighborhood map
What this means for you Summary
Snapshot
- This is a 3-bed/1.0-bath single-family listed at $180k.
Deal economics
- At list price, monthly cash flow is $237 ($3k/yr) — positive.
- The deal already cash-flows at list — no discount required.
- Meets the 1% rule at list price ($2k rent vs $180k).
- Recommended offer: $175k (3.0% below list) — sets the bar for market timing.
Location & tenants
- Location reads: area grade C — affects rentability + tenant quality, not the cash-flow math above.
- Saucon Valley SD (suburban): math 57% / reading 66% proficiency, ranked #58 of 539 in PA (top 11%) — acceptable for families but not a draw, mixed tenant base, ~2y average lease; only 18% free/reduced lunch — higher-income household profile.
- Market conditions: Rents rising fast (+7.2%/yr); 156 active listings in the ZIP; 15 comparable units currently listed for rent nearby; rentals at typical pace (median 24d on market — plan ~3-4 weeks tenant-placement turnaround); 40% of comp listings sitting > 30 days — soft ceiling on asking rent; 567 units permitted in Northampton County in 2024 (151 in 5+ unit buildings).
- This rent runs 37% of the median local income ($61k/yr) — at the standard rent-burdened threshold; future hikes will face affordability resistance.
Forward outlook
- Local home prices are declining (-3.0%/yr); year-one equity from $1k of loan paydown is wiped out by about $5k of value loss. Plan a longer hold.
- At projected returns (-3.0% appreciation + 7.2% rent growth), your $50k cash investment doubles in ~10 years — after that, you're playing with house money.
Negotiation context
- It's been on market 43 days — a 3% lower offer ($175k) is reasonable based on typical stale-listing flexibility.
- 15 sale attempts since 18y ago; this cycle's ask has dropped $25k (12%) from the opening price — seller is motivated, your offer sets the floor, not the list.
- Current owner paid $103k; list at $180k implies a 75% gain — meaningful room to come down on a strong offer.
Risks & watch-outs
- Watch-outs: built in 1900 — expect roof / HVAC / electrical / plumbing capex.
- Climate carrying-cost: moderate wildfire risk — expect insurance premiums to compound above CPI over the hold.
Questions for the listing agent
- It's been on market 43 days. Have you received any prior offers? Is the seller open to a 3% concession, seller financing, or rate buy-down credit?
- Built in 1900 — when were the roof, HVAC, electrical panel, plumbing, and water heater last replaced?
- Is there a deadline driving the sale (1031 exchange, divorce, estate, relocation)? That informs how much negotiation room exists.
- What's the average days-on-market for RENTAL listings here right now (not sales)? A rising rental-DOM trend means longer vacancies and softer asking-rent achievability than the comps imply.
- What's the recent tenant-quality profile in this submarket — average credit score on applications, eviction rate, late-payment / NSF rate, and stable-employment percentage? A property-management company in the area should have these aggregated.
- How much new for-sale + rental construction is in the pipeline within 1–3 miles? Heavy new supply typically softens prices + rents 12–24 months out; constrained supply supports both.
Investment metrics
- 1% rule
- 1.03% ✓
- Cap rate
- 7.87%
- Cash-on-cash
- 5.65%
- DSCR
- 1.25
- GRM
- 8.1
CMA / ARV
- ARV (median comp)
- $261,888
- List price
- $180,000
- Delta
- -31.27%
- Verdict
- UNDERPRICED
- Comps
- 20 within 1.0 mi
Show comp detail 6 sales within ~0.75 mi
| Address | Dist | Beds/Ba | Sqft | Sold | Price | $/sf | Match |
|---|---|---|---|---|---|---|---|
| 1021 Wyandotte St | 0.70mi | 3/2.0 | 1,180 (+0%) | 9mo | $250,000 | $212 | 55 |
| 22 Warren | 0.61mi | 2/1.0 (-1) | 1,103 (-6%) | 4mo | $255,000 | $231 | 53 |
| 613 S Hoffert St | 0.74mi | 3/1.5 | 1,125 (-4%) | 11mo | $285,000 | $253 | 47 |
| 711 S Hoffert St | 0.68mi | 2/2.0 (-1) | 1,125 (-4%) | 12mo | $265,000 | $236 | 42 |
| 1344 Moravia St | 0.70mi | 3/1.5 | 1,046 (-11%) | 19mo | $280,000 | $268 | 31 |
| 737 Finady Ave | 0.75mi | 3/2.5 | 1,340 (+14%) | 11mo | $330,000 | $246 | 27 |
Match score weights: distance 35% · size 25% · config 20% · recency 20%. Top-matched comps best support the ARV.
Projected returns pro-forma
-3.0% appreciation · 7.18% rent growth · sell at horizon
- IRR
- -3.0%
- Equity multiple
- 0.88×
- Total profit
- $-5,901
- Equity at exit
- $26,839
- IRR
- 10.8%
- Equity multiple
- 2.01×
- Total profit
- $50,806
- Equity at exit
- $15,563
Cash invested: $50,400 (down + closing). Projections, not guarantees.
Landlord ↔ Tenant lean methodology
- Overall (STATE)
- 62 Landlord-Friendly
- State Pennsylvania
- 62 Landlord-Friendly · EVEN
- County
- — inherits STATE
- City
- — inherits STATE
ZIP-level market 18015
- Home prices YoY
- -30.7%
- Rents YoY
- 7.2%
- Active inventory
- 156
- Price-to-rent
- 8.1×
Monthly cashflow live
- Estimated rent
- $1,857 high interval (Pro) →
- Mortgage (P&I)
- −$944
- Tax from tax record
- −$211 /mo · $2,533/yr
- Insurance
- −$75
- HOA
- −$0
- Vacancy / Maint / Mgmt
- −$390
- Net cashflow
- $237
Break-even live
UW: 25.0% down · 7.5% · 30yr · 1.5% tax · 5.0% vac · 8.0% maint · 8.0% mgmt
Financing live
Cash to close
- Down payment
- $45,000
- Closing costs
- $5,400
- Reserves months
- —
- Total cash needed
- —
Loan-product check · same deal, 3 products live
Conventional
25% down · 7.5% · 30yr
- Down + closing
- —
- Monthly P&I
- —
- Monthly cashflow
- —
- DSCR
- —
- Eligible?
- —
Personal DTI + credit; lowest rate.
DSCR
20% down · 8.5% · 30yr
- Down + closing
- —
- Monthly P&I
- —
- Monthly cashflow
- —
- DSCR
- —
- Eligible?
- —
No personal income docs; deal must DSCR.
Hard money
10% down · 12.0% · 12mo
- Down + closing
- —
- Monthly P&I
- —
- Monthly cashflow
- —
- DSCR
- —
- Eligible?
- —
Short-term bridge; refi at stabilization.
Rent comps 15 comps
| Address | Beds | Baths | Sqft | Rent | $/sqft | DOM | Units | Dist |
|---|---|---|---|---|---|---|---|---|
| 2443 Black River Rd Bethlehem, PA | 2.0 | 2.0 | 750 | $1,659 | $2.21 | 2d | 1 | 0.76mi |
| 14 Finady Ave Bethlehem, PA | 3.0 | 1.5 | 1500 | $1,600 | $1.07 | 21d | 1 | 0.79mi |
| 406 W 9th St Bethlehem, PA | 3.0 | 1.0 | 1152 | $2,100 | $1.82 | 21d | 1 | 0.88mi |
| 1217 Broadway Unit 2 Fountain Hill, PA | 2.0 | 1.0 | 1340 | $1,550 | $1.16 | 23d | 1 | 0.88mi |
| 541 Jischke St Bethlehem, PA | 3.0 | 1.0 | 1090 | $1,800 | $1.65 | 23d | 1 | 1.07mi |
| 1129 Russell Ave Fountain Hill, PA | 3.0 | 1.0 | 1376 | $1,750 | $1.27 | 23d | 1 | 1.08mi |
| 1129 Russell Ave Fountain Hill, PA | 3.0 | 1.0 | 1376 | $1,900 | $1.38 | 43d | 1 | 1.08mi |
| 521 Hess St Bethlehem, PA | 3.0 | 1.0 | 1120 | $1,500 | $1.34 | 21d | 1 | 1.18mi |
| 708 Cherokee St Bethlehem, PA | 3.0 | 1.5 | 1200 | $2,500 | $2.08 | 43d | 1 | 1.18mi |
| 540 Seneca St Apt 2 Bethlehem, PA | 2.0 | 1.0 | 950 | $1,520 | $1.60 | 2d | 1 | 1.22mi |
| 517 Seneca St Unit 3 Bethlehem, PA | 2.0 | 1.0 | 750 | $1,600 | $2.13 | 43d | 1 | 1.28mi |
| 517 Seneca St Unit 1 Bethlehem, PA | 2.0 | 1.5 | 1500 | $2,200 | $1.47 | 43d | 1 | 1.28mi |
| 414 Cherokee St Unit 414 2nd Fl Bethlehem, PA | 2.0 | 1.0 | 800 | $1,800 | $2.25 | 14d | 1 | 1.35mi |
| 228 W 3rd St Bethlehem, PA | 2.0 | 1.0 | 750 | $1,595 | $2.13 | 43d | 1 | 1.44mi |
| 824 E 8th St Bethlehem, PA | 2.0 | 1.5 | 952 | $1,400 | $1.47 | 43d | 1 | 1.46mi |
Listing history 50 events
-
2026-06-18days on market $180,000 Active 43 DOM
-
2026-06-17days on market $180,000 Active 42 DOM
-
2026-06-16days on market $180,000 Active 41 DOM
-
2026-06-15price $180,000 Active 40 DOM
Show marketing remark (1361 chars)
Welcome to this inviting single-family home located in the sought-after Saucon Valley School District. Offering a wonderful opportunity for investors or buyers looking to add their personal touch, this home combines character, potential, and an outdoor space designed for relaxation and entertaining. The home features two bedrooms on the second floor, plus a finished attic that serves as a spacious third bedroom, home office, or flex space. With a little cosmetic attention and fresh paint, this property has the potential to truly shine. All the appliances are less than 3 years old and the bathroom has been updated. Step outside and discover a backyard retreat that’s ready to enjoy. Recent improvements include newer decking, fencing, and walkway out back, creating a private and welcoming outdoor environment. The yard also features an above-ground pool, a shed for additional storage, and plenty of space for entertaining, gardening, or relaxing on summer evenings. This property needs work and is priced accordingly, making it a great opportunity for buyers who appreciate value and the chance to customize a home to their style while benefiting from a super convenient location. Close proximity to Lehigh University, Historic Bethlehem, the Casino, St Luke’s hospital, and the promenade shops, with easy access to routes 78, 378 and 309!
-
2026-06-15days on market $205,000 Active 40 DOM
Show marketing remark (1361 chars)
Welcome to this inviting single-family home located in the sought-after Saucon Valley School District. Offering a wonderful opportunity for investors or buyers looking to add their personal touch, this home combines character, potential, and an outdoor space designed for relaxation and entertaining. The home features two bedrooms on the second floor, plus a finished attic that serves as a spacious third bedroom, home office, or flex space. With a little cosmetic attention and fresh paint, this property has the potential to truly shine. All the appliances are less than 3 years old and the bathroom has been updated. Step outside and discover a backyard retreat that’s ready to enjoy. Recent improvements include newer decking, fencing, and walkway out back, creating a private and welcoming outdoor environment. The yard also features an above-ground pool, a shed for additional storage, and plenty of space for entertaining, gardening, or relaxing on summer evenings. This property needs work and is priced accordingly, making it a great opportunity for buyers who appreciate value and the chance to customize a home to their style while benefiting from a super convenient location. Close proximity to Lehigh University, Historic Bethlehem, the Casino, St Luke’s hospital, and the promenade shops, with easy access to routes 78, 378 and 309!
-
2026-06-14days on market $205,000 Active 38 DOM
-
2026-06-10days on market $205,000 Active 35 DOM
-
2026-06-09days on market $205,000 Active 34 DOM
-
2026-06-08days on market $205,000 Active 33 DOM
-
2026-06-07days on market $205,000 Active 32 DOM
-
2026-06-05days on market $205,000 Active 29 DOM
-
2026-06-03days on market $205,000 Active 28 DOM
-
2026-06-02days on market $205,000 Active 27 DOM
-
2026-06-01days on market $205,000 Active 26 DOM
-
2026-05-31days on market $205,000 Active 25 DOM
-
2026-05-31days on market $205,000 Active 24 DOM
-
2026-05-16price $205,000 1330-char remark
-
2026-05-05historical
-
2026-04-06price $225,000
-
2026-03-07$225,000 Active 1330-char remark
-
2026-03-07$235,000 Active
-
2019-08-16soldstatus $103,000
-
2019-08-15soldstatus $103,000 Sold
-
2019-08-15soldstatus $103,000 Closed
-
2019-07-25status Pending
-
2019-07-25status Pending
-
2019-07-25historical
-
2019-05-30$105,999 Active
-
2019-05-30$105,999 Active
-
2019-05-30$105,999 Active
-
2019-05-29historical
-
2019-05-29historical
-
2019-05-29historical
-
2019-05-06price $106,500
-
2019-05-06price $106,500
-
2019-05-06price $106,500
-
2019-04-08$109,400 Active
-
2019-03-12$109,400 Active
-
2019-03-12$109,400 Active
-
2019-03-08historical
-
2019-03-08historical
-
2019-03-08historical
-
2019-02-07price $99,000
-
2019-02-07price $99,000
-
2019-02-07price $99,000
-
2019-01-30price $107,500
-
2019-01-30price $107,500
-
2019-01-30price $107,500
-
2018-12-03$109,900 Active
-
2018-12-03$109,900 Active
ⓘ Source: listings_history table (triggers on properties + properties_extension) + one-shot
backfill from property_details.listing_events for pre-trigger history.
Tax reassessment forecast PA · Partial reset (capped growth)
- Current annual tax
- $2,533 · $211/mo
- Projected year-2 tax
- $2,688 · $224/mo
- Expected delta
- +$156/yr (+$13/mo · 6.1%)
ⓘ Screening estimate from a state-policy table — verify with the county assessor before closing.
Climate risk First Street
- Flood 1/10 Low FEMA zone X (unshaded) · 0% chance over 30 yrs
- Wildfire 5/10 Major
- Heat 4/10 Moderate 7 d/yr ≥100°F today · 14 d/yr by 30 yrs out
- Wind 4/10 Moderate 16% chance of damaging wind over 30 yrs
- Air quality 4/10 Moderate 3 unhealthy d/yr today · 6 by 30 yrs out
Nearby sold comps map
Loading sold comps map…
Walkable amenities ~0.75 mi
Loading nearby amenities…
Taxation est. · year 1
- Rental income
- $22,287
- − Mortgage interest
- −$10,083
- − Property taxes
- −$2,533
- − Insurance
- −$900
- − Repairs & maintenance
- −$1,783
- − Management
- −$1,783
- − Depreciation
- −$5,236
- Taxable loss
- −$31
- Est. tax savings @ 24.0%
- +$7
- After-tax cash flow
- $2,854/yr
For passive investors: Depreciation is non-cash, so a rental often shows a tax loss while cash-flowing — sheltering income. Rental losses are passive: they offset passive income freely, and up to $25,000/yr can offset ordinary (W-2) income if you actively participate and your MAGI is under $100k (phasing out to $0 by $150k); unused losses carry forward. On sale, claimed depreciation is recaptured at up to 25%, and gains may owe capital-gains tax (a 1031 exchange can defer both). Figures are a year-1 estimate at your 24.0% rate — not tax advice; consult a CPA.
Schools (NCES district)
- District
- Saucon Valley SD
- NCES district ID
- 4211730
- Math proficiency
- 57% ▬ 0.00%
- Reading proficiency
- 66% ▼ -9.00%
- Median HH income
- $67,374
- Composite
- 53.95/100
- National rank
- #1401
- State rank
- #58 of 539 in PA
Livability — Lower Saucon
No livability data for this city. (Only ~50 U.S. cities are tracked.)
Census & demographics
- County
- Northampton County · 236,814 people
- Metro
- Allentown-Bethlehem-Easton, PA-NJ
- Population (ZIP)
- 34,852
- Household income
- $60,800
- Rent vs Own
- Severe rent burden
- 1525.0
Population outlook (Northampton County) Hauer SSP2
- Today (2025)
- 312,227 people
- By 2030
- 314,769 · +0.8%
- By 2040
- 316,914 · +1.5%
- By 2050
- 318,037 · +1.9%
- By 2075
- 334,003 · +7.0%
- By 2100
- 344,696 · +10.4%
Race, ethnicity, and origin ACS 2023
- Neighborhood character
- Diverse neighborhood (Simpson 0.62)
- Race & ethnicity
- White 53% Hispanic / Latino 29% Two or more races 14% Black 10% Asian 5%
- Hispanic origin (detail)
- Mexican 2% Puerto Rican 19% Dominican 3%
- Common ancestry
- Romanian 4% Danish 1% Iranian 1%
- Foreign-born
- 12% · Canada, China, Jamaica
- Languages at home
- 73% English-only · Spanish 21% Chinese 2% Other Indo-European 2%
Political lean MEDSL · Northampton
- 2024 margin
- Toss-up / Even · D 48.6% · R 50.4%
- 2008→2024 swing
- -14.1pp toward R · 2008: 12.3pp · 2024: -1.8pp
- All cycles
- 2024: R+1.8 2020: D+0.7 2016: R+3.8 2012: D+4.6 2008: D+12.3
Not yet ingested
- Civics
- —
Market trends
- HPI YoY
- ▼ -122.95%
- Current HPI
- 277.4721
- Rent YoY
- ▲ 7.18%
- Metro
- Allentown-Bethlehem-Easton, PA-NJ
- State GDP YoY
- ▲ 1.68%
- F500 in state
- 34
Industry mix (Fortune 500 HQ in PA)
| Industry | F500 HQs | Revenue |
|---|---|---|
| Healthcare | 2 | $309B |
|
||
| Insurance | 2 | $27B |
|
||
| Telecommunications / Media | 1 | $124B |
|
||
| Industrial Distribution | 1 | $22B |
|
||
| Financial Services | 1 | $20B |
|
||
| Chemicals / Materials | 1 | $18B |
|
||
Price history
+38.6% since first listed47 events — show timeline
- 2026-06-15 Price Changed $180,000 GLVRMLS
- 2026-06-15 Price Changed $180,000 GLVRMLS
- 2026-06-06 Listed $205,000 GLVRMLS
- 2026-05-16 Price Changed $205,000 GLVRMLS
- 2026-05-05 Listing Removed — GLVRMLS
- 2026-04-06 Price Changed $225,000 GLVRMLS
- 2026-03-07 Listed $235,000 GLVRMLS
- 2026-03-07 Listed $225,000 GLVRMLS
- 2019-08-16 Sold (Public Records) $103,000 Public Records
- 2019-08-15 Sold (MLS) $103,000 BRIGHT MLS
- 2019-08-15 Sold (MLS) $103,000 GLVRMLS
- 2019-07-25 Pending — BRIGHT MLS
- 2019-07-25 Pending — GLVRMLS
- 2019-07-25 Listing Removed — GLVRMLS
- 2019-05-30 Listed $105,999 BRIGHT MLS
- 2019-05-30 Listed $105,999 GLVRMLS
- 2019-05-30 Listed $105,999 GLVRMLS
- 2019-05-29 Listing Removed — BRIGHT MLS
- 2019-05-29 Listing Removed — GLVRMLS
- 2019-05-29 Listing Removed — GLVRMLS
- 2019-05-06 Price Changed $106,500 BRIGHT MLS
- 2019-05-06 Price Changed $106,500 GLVRMLS
- 2019-05-06 Price Changed $106,500 GLVRMLS
- 2019-04-08 Listed $109,400 GLVRMLS
- 2019-03-12 Listed $109,400 BRIGHT MLS
- 2019-03-12 Listed $109,400 GLVRMLS
- 2019-03-08 Listing Removed — BRIGHT MLS
- 2019-03-08 Listing Removed — GLVRMLS
- 2019-03-08 Listing Removed — GLVRMLS
- 2019-02-07 Price Changed $99,000 BRIGHT MLS
- 2019-02-07 Price Changed $99,000 GLVRMLS
- 2019-02-07 Price Changed $99,000 GLVRMLS
- 2019-01-30 Price Changed $107,500 BRIGHT MLS
- 2019-01-30 Price Changed $107,500 GLVRMLS
- 2019-01-30 Price Changed $107,500 GLVRMLS
- 2018-12-03 Listed $109,900 BRIGHT MLS
- 2018-12-03 Listed $109,900 GLVRMLS
- 2018-12-03 Listed $109,900 GLVRMLS
- 2018-11-30 Listing Removed — BRIGHT MLS
- 2018-11-30 Listing Removed — GLVRMLS
- 2018-09-25 Price Changed $114,900 BRIGHT MLS
- 2018-09-25 Price Changed $114,900 GLVRMLS
- 2018-08-20 Listed $119,900 BRIGHT MLS
- 2018-08-10 Listed $119,900 GLVRMLS
- 2009-08-11 Sold (Public Records) $118,000 Public Records
- 2009-07-13 Sold (MLS) $118,000 GLVRMLS
- 2008-10-10 Listed $129,900 GLVRMLS
Property tax history
+0.4%/yrLatest (2026): $2,533 · +0.8% YoY. Source: county tax records.
Cash-flow waterfall
monthlySold comps — $/sqft
last 12 mo · ≤1 miLoading sold comps…