 Duplex
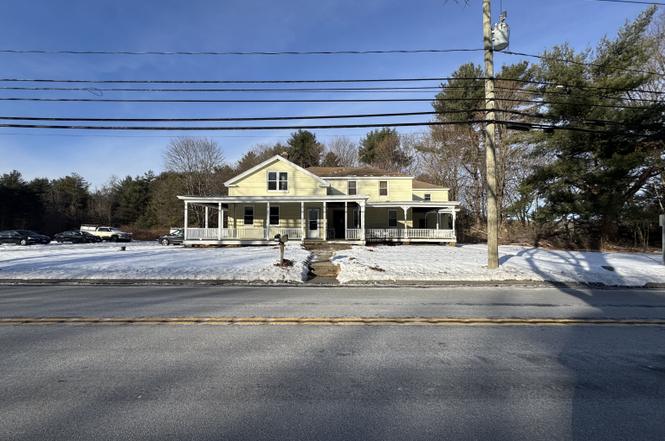
131 River Rd · Storrs, CT
Flood risk No data
- FEMA flood zone
- —
- Chance of flooding over 30 yrs
- —
- Est. flood insurance / yr
- —
Fire risk No data
- Est. fire insurance / yr
- —
Heat risk No data
- Hot days now (above threshold)
- —
- Hot days in 30 yrs
- —
Wind risk No data
- Chance of severe wind over 30 yrs
- —
Air-quality risk No data
- Unhealthy air days now
- —
- Unhealthy air days in 30 yrs
- —
Risk factors via First Street. Map © Google.
Why this score? — see what drove the B grade
The composite is a weighted blend of 9 inputs, each scored 0–100. Each bar is that input's sub-score; the figure is the points it added to the 100-point composite (weight × sub-score).
- Cash flow +30.0/30.0
- 1% rule +10.0/10.0
- DSCR +10.0/10.0
- ARV discount +7.5/15.0
- Livability +4.1/5.0
- Schools +4.0/10.0
- Rent growth +2.5/5.0
- Condition / age +2.5/5.0
- Appreciation +0.0/10.0
$339,900
🖨 Deal sheet 📄 Offer letter ✓ Due diligence
Multi-family units
County records classify this as Multi-Family (2-4 Unit). Listing-text estimate: 2 units. confirmed
Listing remarks
Welcome to this beautiful two-family property offering large, spacious apartments and excellent flexibility for investors or owner-occupants. One unit is currently leased, providing immediate rental income, while the second unit is unoccupied and ready for occupancy. Both apartments offer generous layouts with plenty of living space throughout. Enjoy relaxing or entertaining on the homes beautiful wrap-around porch, adding charm and curb appeal. Apartment B will be refreshed prior to closing, including fresh paint, completion of the kitchen flooring and backsplash. Will update pictures once work is complete. Septic system is new (2023). Just 10 minutes from UConn and 20 minutes from ECSU. W
Key facts
- 20 minutes from ecsu
- New septic system
- Wrap-around porch
Tags
Property features AI
Finance
- Other: Nearby amenities include basketball court, park, and playground/tot lot; Located in Tolland County, Connecticut
- Financial info: Assessed value listed
Exterior
- Utilities: Public water connected; Septic system
- Home design: Multi-family (2-family) property
- Construction: Frame construction; Vinyl siding; Asphalt shingle roof; Stone foundation; Built prior to or includes living area of 3118 sq ft (per public record)
- Exterior features: Wrap-around deck; Lightly wooded, level lot
Interior
- Bedrooms: Six bedrooms total (across the multi-family units)
- Bathrooms: Two full bathrooms; One half bathroom
- Heating & cooling: Hot water heat; Oil-fueled heating (fuel tank located in basement)
- Interior features: Ceiling fans and window units for cooling; One fireplace; Full unfinished basement with dirt floor and hatchway
- Laundry & utility: All units have laundry hook-ups; Tankless hot water (oil); Hot water heated by oil
Neighborhood map
What this means for you Summary
Snapshot
- This is a 2 × 3-bed/1.2-bath units multifamily listed at $340k.
Deal economics
- At list price, monthly cash flow is $2k ($27k/yr) — positive. Per door: $1k/mo.
- The deal already cash-flows at list — no discount required.
- Meets the 1% rule at list price ($6k rent vs $340k).
- Recommended offer: $299k (12.0% below list) — sets the bar for market timing.
Location & tenants
- Location reads 82/100 on livability (#8 in CT, #1,066 nationally) — a professional / high-income tenant draw. Strengths: amenities A+, commute A+, health & safety A+; Watch: employment F, housing F.
- Willington School District (rural): math 36% / reading 53% proficiency, ranked #90 of 153 in CT (top 59%) — families likely to look elsewhere, expect single-tenant / working-renter base with shorter leases; only 14% free/reduced lunch — higher-income household profile.
- Market conditions: 28 active listings in the ZIP; 1,867 units permitted in Capitol Planning Region in 2024 (1,399 in 5+ unit buildings).
Forward outlook
- Local home prices are declining (-3.0%/yr); year-one equity from $2k of loan paydown is wiped out by about $10k of value loss. Plan a longer hold.
- At projected returns (-3.0% appreciation + 3.0% rent growth), your $95k cash investment doubles in ~5 years — after that, you're playing with house money.
Negotiation context
- It's been on market 129 days — a 12% lower offer ($299k) is reasonable based on typical stale-listing flexibility.
Risks & watch-outs
- Watch-outs: built in 1900 — expect roof / HVAC / electrical / plumbing capex.
Questions for the listing agent
- It's been on market 129 days. Have you received any prior offers? Is the seller open to a 12% concession, seller financing, or rate buy-down credit?
- Can we see the unit-by-unit rent roll, current vacancy, and any below-market leases? What's the average tenancy length?
- What capital expenditures (roof, boiler, parking lot, exteriors) have been made in the last 5 years, and what's planned in the next 2?
- Built in 1900 — when were the roof, HVAC, electrical panel, plumbing, and water heater last replaced?
- Why hasn't it sold? Are there any deal-killer items the seller is aware of (foundation, flood, title, zoning, code violations)?
- Is there a deadline driving the sale (1031 exchange, divorce, estate, relocation)? That informs how much negotiation room exists.
- Schools are A-rated — typically a magnet for longer-tenancy family renters. What's the average tenant stay here, and is there a school-zone premium baked into asking?
- What's the average days-on-market for RENTAL listings here right now (not sales)? A rising rental-DOM trend means longer vacancies and softer asking-rent achievability than the comps imply.
- What's the recent tenant-quality profile in this submarket — average credit score on applications, eviction rate, late-payment / NSF rate, and stable-employment percentage? A property-management company in the area should have these aggregated.
- How much new apartment / multifamily construction is in the pipeline within 1–3 miles? Heavy new supply (>2% of stock underway) typically softens rents 12–24 months out; light construction supports rent growth.
Investment metrics
- 1% rule
- 1.68% ✓
- Cap rate
- 14.18%
- Cash-on-cash
- 28.17%
- DSCR
- 2.25
- GRM
- 5.0
CMA / ARV
No comps found within radius.
Projected returns pro-forma
-3.0% appreciation · 3.0% rent growth · sell at horizon
- IRR
- 22.4%
- Equity multiple
- 1.92×
- Total profit
- $87,274
- Equity at exit
- $50,680
- IRR
- 30.4%
- Equity multiple
- 3.73×
- Total profit
- $259,399
- Equity at exit
- $29,388
Cash invested: $95,172 (down + closing). Projections, not guarantees.
Landlord ↔ Tenant lean methodology
- Overall (STATE)
- 27 Tenant-Leaning
- State Connecticut
- 27 Tenant-Leaning · D+7
- County
- — inherits STATE
- City
- — inherits STATE
ZIP-level market 06279
- Home prices YoY
- -4.5%
- Active inventory
- 28
- Price-to-rent
- 9.9×
Monthly cashflow live
- Estimated rent
- $5,700 medium interval (Pro) →
- Mortgage (P&I)
- −$1,782
- Tax from tax record
- −$344 /mo · $4,133/yr
- Insurance
- −$142
- HOA
- −$0
- Vacancy / Maint / Mgmt
- −$1,197
- Net cashflow
- $2,234
Break-even live
2-unit breakdown (identical units grouped — click to expand)
| Units | Beds | Baths | Est. rent |
|---|---|---|---|
| 2× units | 3 | 1.2 | $5,700 |
| #1 | 3 | 1.2 | $2,850 |
| #2 | 3 | 1.2 | $2,850 |
| Total (2 units) | $5,700 | ||
UW: 25.0% down · 7.5% · 30yr · 1.5% tax · 5.0% vac · 8.0% maint · 8.0% mgmt
Financing live
Cash to close
- Down payment
- $84,975
- Closing costs
- $10,197
- Reserves months
- —
- Total cash needed
- —
Loan-product check · same deal, 3 products live
Conventional
25% down · 7.5% · 30yr
- Down + closing
- —
- Monthly P&I
- —
- Monthly cashflow
- —
- DSCR
- —
- Eligible?
- —
Personal DTI + credit; lowest rate.
DSCR
20% down · 8.5% · 30yr
- Down + closing
- —
- Monthly P&I
- —
- Monthly cashflow
- —
- DSCR
- —
- Eligible?
- —
No personal income docs; deal must DSCR.
Hard money
10% down · 12.0% · 12mo
- Down + closing
- —
- Monthly P&I
- —
- Monthly cashflow
- —
- DSCR
- —
- Eligible?
- —
Short-term bridge; refi at stabilization.
Listing history 6 events
-
2026-05-17status Under Contract
-
2026-04-19price $339,900
-
2026-04-06price $359,900
-
2026-03-26price $369,900
-
2026-02-28price $389,900
-
2026-01-08$399,900 Active
ⓘ Source: listings_history table (triggers on properties + properties_extension) + one-shot
backfill from property_details.listing_events for pre-trigger history.
Tax reassessment forecast CT · Partial reset (capped growth)
- Current annual tax
- $4,133 · $344/mo
- Projected year-2 tax
- $5,703 · $475/mo
- Expected delta
- +$1,570/yr (+$131/mo · 38.0%)
ⓘ Screening estimate from a state-policy table — verify with the county assessor before closing.
Nearby sold comps map
Loading sold comps map…
Walkable amenities ~0.75 mi
Loading nearby amenities…
Taxation est. · year 1
- Rental income
- $68,400
- − Mortgage interest
- −$19,040
- − Property taxes
- −$4,133
- − Insurance
- −$1,700
- − Repairs & maintenance
- −$5,472
- − Management
- −$5,472
- − Depreciation
- −$9,888
- Taxable income
- $22,696
- Est. tax owed @ 24.0%
- −$5,447
- After-tax cash flow
- $21,367/yr
For passive investors: Depreciation is non-cash, so a rental often shows a tax loss while cash-flowing — sheltering income. Rental losses are passive: they offset passive income freely, and up to $25,000/yr can offset ordinary (W-2) income if you actively participate and your MAGI is under $100k (phasing out to $0 by $150k); unused losses carry forward. On sale, claimed depreciation is recaptured at up to 25%, and gains may owe capital-gains tax (a 1031 exchange can defer both). Figures are a year-1 estimate at your 24.0% rate — not tax advice; consult a CPA.
Schools (NCES district)
- District
- Willington School District
- NCES district ID
- 0905100
- Math proficiency
- 36% ▼ -20.00%
- Reading proficiency
- 53% ▼ -2.00%
- Median HH income
- $68,267
- Composite
- 39.91/100
- National rank
- #3851
- State rank
- #90 of 153 in CT
Livability — Storrs
- Score
- 82/100
- State rank
- #8
- US rank
- #1066
Category grades
Schools grade is shown separately in the Schools card above.
Census & demographics
- City population
- 17,505
- Population (ZIP)
- 5,563
Population outlook (Capitol County) Hauer SSP2
- By 2040
- 1,063,519
Race, ethnicity, and origin ACS 2023
- Neighborhood character
- Predominantly White (82%)
- Race & ethnicity
- White 82% Asian 7% Two or more races 5% Hispanic / Latino 5%
- Common ancestry
- Lithuanian 11% Romanian 8% Serbian 3%
- Foreign-born
- 9% · China, Canada
- Languages at home
- 92% English-only · Tagalog/Filipino 2% Spanish 2% Chinese 2%
Political lean MEDSL · Capitol
- 2024 margin
- Strong D (+21.9) · D 60.1% · R 38.2% · Other 1.7%
- All cycles
- 2024: D+21.9
Not yet ingested
- Civics
- —
Market trends
- HPI YoY
- ▼ -12.63%
- Current HPI
- 270.5381
- Rent YoY
- —
- Metro
- —
- State GDP YoY
- ▲ 1.06%
- F500 in state
- 38
Industry mix (Fortune 500 HQ in CT)
| Industry | F500 HQs | Revenue |
|---|---|---|
| Industrial Machinery | 4 | $38B |
|
||
| Insurance | 3 | $71B |
|
||
| Financial Services | 2 | $25B |
|
||
| Transportation / Logistics | 2 | $18B |
|
||
| Healthcare | 1 | $247B |
|
||
| Telecommunications | 1 | $55B |
|
||
Price history
-15.0% since first listed6 events — show timeline
- 2026-05-17 Pending — Smart MLS
- 2026-04-19 Price Changed $339,900 Smart MLS
- 2026-04-06 Price Changed $359,900 Smart MLS
- 2026-03-26 Price Changed $369,900 Smart MLS
- 2026-02-28 Price Changed $389,900 Smart MLS
- 2026-01-08 Listed $399,900 Smart MLS
Property tax history
+0.8%/yrLatest (2023): $4,133 · +2.8% YoY. Source: county tax records.
Cash-flow waterfall
monthlySold comps — $/sqft
last 12 mo · ≤1 miLoading sold comps…