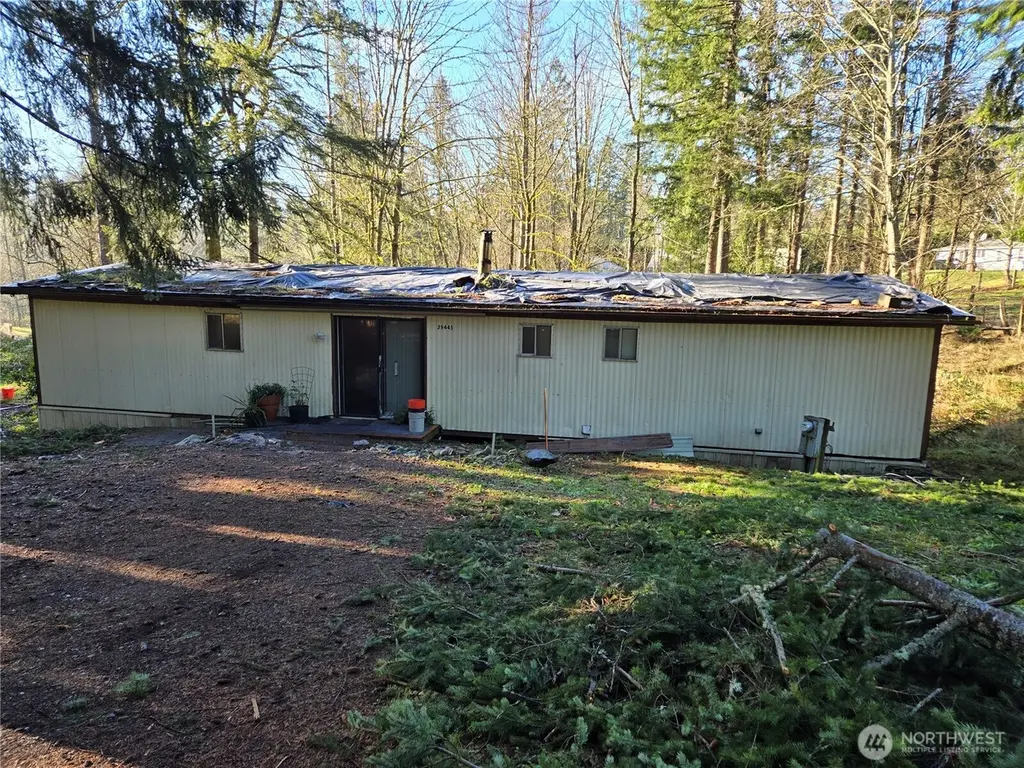
29445 SE 371st St · Black Diamond, WA
Flood risk 1/10 · Minimal
- FEMA flood zone
- X (unshaded)
- Chance of flooding over 30 yrs
- 0.0%
- Est. flood insurance / yr
- $507 – $1,088
Fire risk 2/10 · Minimal
- Est. fire insurance / yr
- $604 – $1,122
Heat risk 2/10 · Minimal
- Hot days now (above 85°F)
- 7 days/yr
- Hot days in 30 yrs
- 15 days/yr
Wind risk 1/10 · Minimal
- Chance of severe wind over 30 yrs
- —
Air-quality risk 7/10 · Major
- Unhealthy air days now
- 11 days/yr
- Unhealthy air days in 30 yrs
- 15 days/yr
Risk factors via First Street. Map © Google.
Why this score? — see what drove the D grade
The composite is a weighted blend of 9 inputs, each scored 0–100. Each bar is that input's sub-score; the figure is the points it added to the 100-point composite (weight × sub-score).
- ARV discount +12.4/15.0
- Cash flow +9.9/30.0
- Schools +5.5/10.0
- Livability +4.0/5.0
- Rent growth +3.6/5.0
- DSCR +2.8/10.0
- 1% rule +2.5/10.0
- Condition / age +2.5/5.0
- Appreciation +0.0/10.0
$339,000
🖨 Deal sheet (PDF) 📄 Offer letter ✓ Due diligence
Listing remarks
Enumclaw North of town. Lovely, wooded 1 acre lot with a GREAT OPPORTUNITY. .. .. fix up the existing doublewide or bring in a new mobile or have a building site for new home. Three-bedroom septic and community water on site. 1976 KWOOD 56/24 Double-Wide that need to be fixed up or replaced. The home is 1344 sq ft with 3 bedrooms, one bathroom. Fenced, private and it is a blank canvas for your creativity. With the age of the home, it has limited financing and may have to be a cash sale. Back on the market and a reduced Priced to sell and is surplus property for the owner that they do not want any longer. Reduced to Sell. SELLER SAYS TO BRING OFFERS, Seller will consider all reasonable offer
Key facts
- Wooded 1 acre lot
- Three-bedroom septic
- Fenced private
Tags
Neighborhood map
What this means for you Summary
Snapshot
- This is a 3-bed/1.0-bath manufactured listed at $339k.
Deal economics
- At list price, monthly cash flow is $-210 ($-3k/yr) — negative.
- To cash-flow at today's rent, offer at most $302k (11.0% below list).
- To meet the 1% rule (rent ≥ 1% of price), the offer needs to be $255k (24.9% below list).
- Recommended offer: $255k (24.9% below list) — sets the bar for 1% rule.
- Cap rate 5.5% vs local median 2.2% in Black Diamond — top-decile yield for the area; either an underpriced asset or a hidden risk that comps aren't pricing in. Stress-test before assuming the spread holds.
Location & tenants
- Location reads 80/100 on livability (#87 in WA, #1,663 nationally) — a professional / high-income tenant draw. Strengths: crime A+, employment A+, housing A+; Watch: amenities D+, cost of living F.
- Enumclaw School District (suburban): math 54% / reading 68% proficiency, ranked #46 of 291 in WA (top 16%) — acceptable for families but not a draw, mixed tenant base, ~2y average lease.
- Zoned schools: Byron Kibler Elementary School (434 students, 41% FRL); Thunder Mountain Middle School (454 students, 31% FRL); Enumclaw Sr High School (1,339 students, 28% FRL).
- Market conditions: Rents rising fast (+4.3%/yr); 227 active listings in the ZIP; high-income renter base; 10,555 units permitted in King County in 2024 (7,119 in 5+ unit buildings).
Forward outlook
- Local home prices are declining (-3.0%/yr); year-one equity from $2k of loan paydown is wiped out by about $10k of value loss. Plan a longer hold.
- King County population projected at +44% by 2050 — long-run rental-demand tailwind backs the buy-and-hold thesis.
Negotiation context
- It's been on market 381 days — a 12% lower offer ($298k) is reasonable based on typical stale-listing flexibility.
- 2 sale attempts; this cycle's ask has dropped $20k (6%) from the opening price — seller is motivated, your offer sets the floor, not the list.
Questions for the listing agent
- What do current leases actually rent for vs. the listed asking? Can we see a recent rent roll and the last 12 months of T-12 income?
- It's been on market 381 days. Have you received any prior offers? Is the seller open to a 25% concession, seller financing, or rate buy-down credit?
- Built in 1976 — when were the roof, HVAC, electrical panel, plumbing, and water heater last replaced?
- Why hasn't it sold? Are there any deal-killer items the seller is aware of (foundation, flood, title, zoning, code violations)?
- Is there a deadline driving the sale (1031 exchange, divorce, estate, relocation)? That informs how much negotiation room exists.
- Schools are B-rated — typically a magnet for longer-tenancy family renters. What's the average tenant stay here, and is there a school-zone premium baked into asking?
- The area grade is low — what's the realistic commute time and amenity access for the typical tenant pool here? Any planned neighborhood developments (good or bad) we should know about?
- What's the average days-on-market for RENTAL listings here right now (not sales)? A rising rental-DOM trend means longer vacancies and softer asking-rent achievability than the comps imply.
- What's the recent tenant-quality profile in this submarket — average credit score on applications, eviction rate, late-payment / NSF rate, and stable-employment percentage? A property-management company in the area should have these aggregated.
- How much new for-sale + rental construction is in the pipeline within 1–3 miles? Heavy new supply typically softens prices + rents 12–24 months out; constrained supply supports both.
Investment metrics
- 1% rule
- 0.75% ✗
- Cap rate
- 5.55%
- Cash-on-cash
- -2.66%
- DSCR
- 0.88
- GRM
- 11.1
CMA / ARV
- ARV (median comp)
- $380,000
- List price
- $339,000
- Delta
- -10.79%
- Verdict
- UNDERPRICED
- Comps
- 1 within 2.0 mi
Projected returns pro-forma
-3.0% appreciation · 4.32% rent growth · sell at horizon
- IRR
- -19.4%
- Equity multiple
- 0.32×
- Total profit
- $-64,940
- Equity at exit
- $50,546
- IRR
- -9.7%
- Equity multiple
- 0.37×
- Total profit
- $-59,510
- Equity at exit
- $29,311
Cash invested: $94,920 (down + closing). Projections, not guarantees.
Landlord ↔ Tenant lean methodology
- Overall (STATE)
- 28 Tenant-Leaning
- State Washington
- 28 Tenant-Leaning · D+8
- County
- — inherits STATE
- City
- — inherits STATE
ZIP-level market 98022
- Rents YoY
- 4.3%
- Active inventory
- 227
- Price-to-rent
- 11.1×
Monthly cashflow live
- Estimated rent
- $2,545 medium interval (Pro) →
- Mortgage (P&I)
- −$1,778
- Tax from tax record
- −$302 /mo · $3,623/yr
- Insurance
- −$141
- HOA
- −$0
- Vacancy / Maint / Mgmt
- −$534
- Net cashflow
- $-210
Break-even live
Sensitivity live
| Price | -10% $-18 | -5% $-114 | +0% $-210 | +5% $-306 | +10% $-402 |
|---|---|---|---|---|---|
| Rent | -10% $-411 | -5% $-311 | +0% $-210 | +5% $-110 | +10% $-9 |
| Rate | -1.0pp $-40 | -0.5pp $-124 | base $-210 | +0.5pp $-298 | +1.0pp $-388 |
UW: 25.0% down · 7.5% · 30yr · 1.5% tax · 5.0% vac · 8.0% maint · 8.0% mgmt
Financing live
Cash to close
- Down payment
- $84,750
- Closing costs
- $10,170
- Reserves months
- —
- Total cash needed
- —
Loan-product check · same deal, 3 products live
Conventional
25% down · 7.5% · 30yr
- Down + closing
- —
- Monthly P&I
- —
- Monthly cashflow
- —
- DSCR
- —
- Eligible?
- —
Personal DTI + credit; lowest rate.
DSCR
20% down · 8.5% · 30yr
- Down + closing
- —
- Monthly P&I
- —
- Monthly cashflow
- —
- DSCR
- —
- Eligible?
- —
No personal income docs; deal must DSCR.
Hard money
10% down · 12.0% · 12mo
- Down + closing
- —
- Monthly P&I
- —
- Monthly cashflow
- —
- DSCR
- —
- Eligible?
- —
Short-term bridge; refi at stabilization.
Listing history 18 events
-
2026-06-21days on market $339,000 Active 381 DOM
-
2026-06-18days on market $339,000 Active 378 DOM
-
2026-06-17pricedays on market $339,000 Active 377 DOM
-
2026-06-16days on market $349,000 Active 376 DOM
-
2026-06-15days on market $349,000 Active 375 DOM
-
2026-06-13days on market $349,000 Active 373 DOM
-
2026-06-09days on market $349,000 Active 369 DOM
-
2026-06-08days on market $349,000 Active 368 DOM
-
2026-06-07days on market $349,000 Active 367 DOM
-
2026-06-04days on market $349,000 Active 364 DOM
-
2026-06-03days on market $349,000 Active 363 DOM
-
2026-06-02days on market $349,000 Active 362 DOM
-
2026-06-01days on market $349,000 Active 361 DOM
-
2026-05-31days on market $349,000 Active 360 DOM
-
2025-08-04price $349,000
-
2025-08-04price $349,000
-
2025-06-05$359,000 Active
-
2025-06-05$359,000 Active
ⓘ Source: listings_history table (triggers on properties + properties_extension) + one-shot
backfill from property_details.listing_events for pre-trigger history.
Tax reassessment forecast WA · Resets to sale price
- Current annual tax
- $3,623 · $302/mo
- Projected year-2 tax
- $3,623 · $302/mo
- Expected delta
- $0/yr ($0/mo · 0.0%)
ⓘ Screening estimate from a state-policy table — verify with the county assessor before closing.
Climate risk First Street
- Flood 1/10 Low FEMA zone X (unshaded) · 0% chance over 30 yrs
- Wildfire 2/10 Low
- Heat 2/10 Low 7 d/yr ≥85°F today · 15 d/yr by 30 yrs out
- Wind 1/10 Low
- Air quality 7/10 Severe 11 unhealthy d/yr today · 15 by 30 yrs out
Nearby sold comps map
Loading sold comps map…
Walkable amenities ~0.75 mi
Loading nearby amenities…
Taxation est. · year 1
- Rental income
- $30,540
- − Mortgage interest
- −$18,989
- − Property taxes
- −$3,623
- − Insurance
- −$1,695
- − Repairs & maintenance
- −$2,443
- − Management
- −$2,443
- − Depreciation
- −$9,862
- Taxable loss
- −$8,515
- Est. tax savings @ 24.0%
- +$2,044
- After-tax cash flow
- $-480/yr
For passive investors: Depreciation is non-cash, so a rental often shows a tax loss while cash-flowing — sheltering income. Rental losses are passive: they offset passive income freely, and up to $25,000/yr can offset ordinary (W-2) income if you actively participate and your MAGI is under $100k (phasing out to $0 by $150k); unused losses carry forward. On sale, claimed depreciation is recaptured at up to 25%, and gains may owe capital-gains tax (a 1031 exchange can defer both). Figures are a year-1 estimate at your 24.0% rate — not tax advice; consult a CPA.
Schools (NCES district)
- District
- Enumclaw School District
- NCES district ID
- 5300001
- Math proficiency
- 54% ▼ -1.00%
- Reading proficiency
- 68% ▬ 0.00%
- Median HH income
- $68,441
- Composite
- 55.21/100
- National rank
- #2736
- State rank
- #46 of 291 in WA
Livability — Black Diamond
- Score
- 80/100
- State rank
- #87
- US rank
- #1663
Category grades
Schools grade is shown separately in the Schools card above.
Census & demographics
- County
- King County · 2,251,916 people
- City population
- 6,857
- Metro
- Seattle-Tacoma-Bellevue, WA
- Population (ZIP)
- 22,418
- Household income
- $120,406
- Rent vs Own
- Severe rent burden
- 382.0
Population outlook (King County) Hauer SSP2
- Today (2025)
- 2,576,485 people
- By 2030
- 2,803,316 · +8.8%
- By 2040
- 3,255,921 · +26.4%
- By 2050
- 3,706,444 · +43.9%
- By 2075
- 4,746,063 · +84.2%
- By 2100
- 5,407,730 · +109.9%
Race, ethnicity, and origin ACS 2023
- Neighborhood character
- Predominantly White (78%)
- Race & ethnicity
- White 78% Hispanic / Latino 10% Two or more races 9% Asian 2% Native American 2%
- Hispanic origin (detail)
- Mexican 8%
- Common ancestry
- Portuguese 7% Italian 4% Slovak 3%
- Foreign-born
- 6% · Canada
- Languages at home
- 91% English-only · Spanish 6% Other Indo-European 1% German/W. Germanic 1%
Political lean MEDSL · King
- 2024 margin
- Solid D (+51.7) · D 74.2% · R 22.5% · Other 3.4%
- 2008→2024 swing
- +9.6pp toward D · 2008: 42.1pp · 2024: 51.7pp
- All cycles
- 2024: D+51.7 2020: D+52.7 2016: D+50.4 2012: D+39.9 2008: D+42.1
Not yet ingested
- Civics
- —
Market trends
- HPI YoY
- ▼ -605.16%
- Current HPI
- 297.9161
- Rent YoY
- ▲ 4.32%
- Metro
- Seattle-Tacoma-Bellevue, WA
- State GDP YoY
- ▲ 4.65%
- F500 in state
- 22
Industry mix (Fortune 500 HQ in WA)
| Industry | F500 HQs | Revenue |
|---|---|---|
| Retail | 2 | $269B |
|
||
| Technology / Retail | 1 | $638B |
|
||
| Technology | 1 | $245B |
|
||
| Telecommunications | 1 | $38B |
|
||
| Food / Beverage | 1 | $36B |
|
||
| Automotive / Trucks | 1 | $34B |
|
||
Price history
-2.8% since first listed4 events — show timeline
- 2025-08-04 Price Changed $349,000 NWMLS as Distributed by MLS Grid
- 2025-08-04 Price Changed $349,000 NWMLS as Distributed by MLS Grid
- 2025-06-05 Listed $359,000 NWMLS as Distributed by MLS Grid
- 2025-06-05 Listed $359,000 NWMLS as Distributed by MLS Grid
Property tax history
+4.0%/yrLatest (2025): $3,623 · +9.0% YoY. Source: county tax records.
Cash-flow waterfall
monthlySold comps — $/sqft
last 12 mo · ≤1 miLoading sold comps…