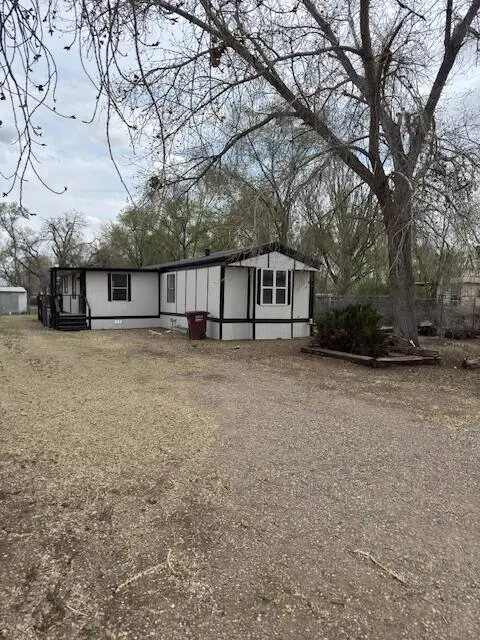
2910 Parklane Dr · Bosque Farms, NM
Flood risk 4/10 · Minor
- FEMA flood zone
- AE
- Chance of flooding over 30 yrs
- 0.24%
- Est. flood insurance / yr
- $1,737 – $8,500
Fire risk 4/10 · Minor
- Est. fire insurance / yr
- $706 – $1,312
Heat risk 5/10 · Moderate
- Hot days now (above 97°F)
- 7 days/yr
- Hot days in 30 yrs
- 19 days/yr
Wind risk 1/10 · Minimal
- Chance of severe wind over 30 yrs
- —
Air-quality risk 2/10 · Minimal
- Unhealthy air days now
- 1 days/yr
- Unhealthy air days in 30 yrs
- 1 days/yr
Risk factors via First Street. Map © Google.
Why this score? — see what drove the C- grade
The composite is a weighted blend of 9 inputs, each scored 0–100. Each bar is that input's sub-score; the figure is the points it added to the 100-point composite (weight × sub-score).
- Cash flow +17.7/30.0
- ARV discount +12.1/15.0
- DSCR +5.5/10.0
- Rent growth +5.0/5.0
- 1% rule +3.7/10.0
- Livability +3.6/5.0
- Schools +2.6/10.0
- Condition / age +2.5/5.0
- Appreciation +0.0/10.0
$245,000
🖨 Deal sheet (PDF) 📄 Offer letter ✓ Due diligence
Listing remarks MLS
Serene property in the heart of Bosque Farms. Single wide with additions on a half acre. Home has been updated with a New Roof, New AC/furnace & Duct work, New siding, New Gutters & Downspouts, Exterior & Interior paint and New windows are on order. Seller is in the process of having the title deactivated. Also home has possible loan approval with Directors Mortgage and a qualified buyer.
Key facts
- 0.5 acre lot
- Built 1985
- Listed 76 days
Neighborhood map
What this means for you Summary
Snapshot
- This is a 3-bed/2.0-bath other listed at $245k.
Deal economics
- At list price, monthly cash flow is $-228 ($-3k/yr) — negative.
- To cash-flow at today's rent, offer at most $205k (16.4% below list).
- To meet the 1% rule (rent ≥ 1% of price), the offer needs to be $212k (13.4% below list).
- Recommended offer: $205k (16.4% below list) — sets the bar for cash-flow.
Location & tenants
- Location reads 72/100 on livability (#11 in NM) — a middle-class / working-renter tenant base. Strengths: crime A+, housing A+, cost of living A-; Watch: schools F, amenities F, commute F.
- Los Lunas Public Schools (suburban): math 20% / reading 34% proficiency, ranked #34 of 95 in NM (top 36%) — low school quality limits family demand, transient renter base, plan for 1-2y turnover; 63% free/reduced lunch — lower-income household profile, screen leases tightly.
- Market conditions: Rents rising fast (+33.2%/yr); 567 active listings in the ZIP; 1 comparable units currently listed for rent nearby; 303 units permitted in Valencia County in 2024 (0 in 5+ unit buildings).
- This rent runs 42% of the median local income ($61k/yr) — at the standard rent-burdened threshold; future hikes will face affordability resistance.
Forward outlook
- Local home prices are declining (-3.0%/yr); year-one equity from $2k of loan paydown is wiped out by about $7k of value loss. Plan a longer hold.
- Valencia County population projected at -14% by 2050 — secular population decline; favor cash flow + early exit over multi-decade hold.
Negotiation context
- It's been on market 76 days — a 6% lower offer ($230k) is reasonable based on typical stale-listing flexibility.
- 3 sale attempts since 10y ago with the ask held roughly flat each time — persistent listings suggest the price (not the market) is what's stuck; bring a comps-based counter.
Risks & watch-outs
- Watch-outs: flood insurance adds $427/mo.
- Climate carrying-cost: in FEMA flood zone AE (mandatory federal flood insurance); extreme-heat days projected 7→19/yr by 2055 (HVAC capex compounding) — expect insurance premiums to compound above CPI over the hold.
Questions for the listing agent
- What do current leases actually rent for vs. the listed asking? Can we see a recent rent roll and the last 12 months of T-12 income?
- It's been on market 76 days. Have you received any prior offers? Is the seller open to a 16% concession, seller financing, or rate buy-down credit?
- What's the actual annual flood-insurance premium (NFIP or private), and is the property in a SFHA with mandatory coverage?
- Why hasn't it sold? Are there any deal-killer items the seller is aware of (foundation, flood, title, zoning, code violations)?
- Is there a deadline driving the sale (1031 exchange, divorce, estate, relocation)? That informs how much negotiation room exists.
- Schools are F-rated, which usually means shorter tenancies and higher turnover. Who's the typical renter profile here, and what's been the actual vacancy rate?
- What's the average days-on-market for RENTAL listings here right now (not sales)? A rising rental-DOM trend means longer vacancies and softer asking-rent achievability than the comps imply.
- What's the recent tenant-quality profile in this submarket — average credit score on applications, eviction rate, late-payment / NSF rate, and stable-employment percentage? A property-management company in the area should have these aggregated.
- How much new for-sale + rental construction is in the pipeline within 1–3 miles? Heavy new supply typically softens prices + rents 12–24 months out; constrained supply supports both.
Investment metrics
- 1% rule
- 0.87% ✗
- Cap rate
- 7.27%
- Cash-on-cash
- 3.48%
- DSCR
- 1.15
- GRM
- 9.6
CMA / ARV
- ARV (median comp)
- $273,173
- List price
- $245,000
- Delta
- -10.31%
- Verdict
- UNDERPRICED
- Comps
- 2 within 1.0 mi
Projected returns pro-forma
-3.0% appreciation · 8.0% rent growth · sell at horizon
- IRR
- -16.8%
- Equity multiple
- 0.38×
- Total profit
- $-42,816
- Equity at exit
- $36,530
- IRR
- -0.7%
- Equity multiple
- 0.94×
- Total profit
- $-4,246
- Equity at exit
- $21,183
Cash invested: $68,600 (down + closing). Projections, not guarantees.
Landlord ↔ Tenant lean methodology
- Overall (STATE)
- 55 Moderately Landlord-Leaning
- State New Mexico
- 55 Moderately Landlord-Leaning · D+3
- County
- — inherits STATE
- City
- — inherits STATE
ZIP-level market 87031
- Home prices YoY
- -29.8%
- Rents YoY
- 33.2%
- Active inventory
- 567
- Price-to-rent
- 9.6×
Monthly cashflow live
- Estimated rent
- $2,122 medium interval (Pro) →
- Mortgage (P&I)
- −$1,285
- Tax from tax record
- −$91 /mo · $1,086/yr
- Insurance
- −$102
- Flood insurance flood zone
- −$427 /mo · $5,118/yr
- HOA
- −$0
- Vacancy / Maint / Mgmt
- −$446
- Net cashflow
- $-228
Break-even live
Sensitivity live
| Price | -10% $-89 | -5% $-158 | +0% $-228 | +5% $-297 | +10% $-366 |
|---|---|---|---|---|---|
| Rent | -10% $-395 | -5% $-311 | +0% $-228 | +5% $-144 | +10% $-60 |
| Rate | -1.0pp $-104 | -0.5pp $-165 | base $-228 | +0.5pp $-291 | +1.0pp $-356 |
UW: 25.0% down · 7.5% · 30yr · 1.5% tax · 5.0% vac · 8.0% maint · 8.0% mgmt
Financing live
Cash to close
- Down payment
- $61,250
- Closing costs
- $7,350
- Reserves months
- —
- Total cash needed
- —
Loan-product check · same deal, 3 products live
Conventional
25% down · 7.5% · 30yr
- Down + closing
- —
- Monthly P&I
- —
- Monthly cashflow
- —
- DSCR
- —
- Eligible?
- —
Personal DTI + credit; lowest rate.
DSCR
20% down · 8.5% · 30yr
- Down + closing
- —
- Monthly P&I
- —
- Monthly cashflow
- —
- DSCR
- —
- Eligible?
- —
No personal income docs; deal must DSCR.
Hard money
10% down · 12.0% · 12mo
- Down + closing
- —
- Monthly P&I
- —
- Monthly cashflow
- —
- DSCR
- —
- Eligible?
- —
Short-term bridge; refi at stabilization.
Rent comps 1 comps
| Address | Beds | Baths | Sqft | Rent | $/sqft | DOM | Units | Dist |
|---|---|---|---|---|---|---|---|---|
| 58 Valencia Rd Peralta, NM | 3.0 | 2.0 | 1200 | $2,000 | $1.67 | 3d | 1 | 1.36mi |
Listing history 23 events
-
2026-06-22days on market $245,000 Active 76 DOM
-
2026-06-18days on market $245,000 Active 73 DOM
-
2026-06-17days on market $245,000 Active 72 DOM
-
2026-06-16days on market $245,000 Active 71 DOM
-
2026-06-15days on market $245,000 Active 70 DOM
-
2026-06-13days on market $245,000 Active 68 DOM
-
2026-06-10days on market $245,000 Active 65 DOM
-
2026-06-09days on market $245,000 Active 64 DOM
-
2026-06-08days on market $245,000 Active 63 DOM
-
2026-06-07days on market $245,000 Active 62 DOM
-
2026-06-05remarks 243-char remark
-
2026-06-05days on market $245,000 Active 59 DOM
-
2026-06-03days on market $245,000 Active 58 DOM
-
2026-06-02days on market $245,000 Active 57 DOM
-
2026-06-01days on market $245,000 Active 56 DOM
-
2026-05-31days on market $245,000 Active 55 DOM
-
2026-04-06$250,000 Active 409-char remark
Show marketing remark (409 chars)
Serene property in the heart of Bosque Farms. Single wide with additions on a half acre. Home has been updated with a New Roof, New AC/furnace & Duct work, New siding, New Gutters & Downspouts, Exterior & Interior paint and New windows are on order. Seller is in the process of having the title deactivated. Also home has possible loan approval with Directors Mortgage and a qualified buyer.
-
2016-10-03soldstatus
-
2016-08-22historical
-
2016-08-22historical
-
2016-06-26$75,000 Active
-
2016-05-16$75,000 Active
-
2013-01-11soldstatus
ⓘ Source: listings_history table (triggers on properties + properties_extension) + one-shot
backfill from property_details.listing_events for pre-trigger history.
Tax reassessment forecast NM · Resets to sale price
- Current annual tax
- $1,086 · $91/mo
- Projected year-2 tax
- $1,960 · $163/mo
- Expected delta
- +$874/yr (+$73/mo · 80.5%)
ⓘ Screening estimate from a state-policy table — verify with the county assessor before closing.
Climate risk First Street
- Flood 4/10 Moderate FEMA zone AE · 24% chance over 30 yrs
- Wildfire 4/10 Moderate
- Heat 5/10 Major 7 d/yr ≥97°F today · 19 d/yr by 30 yrs out
- Wind 1/10 Low
- Air quality 2/10 Low 1 unhealthy d/yr today · 1 by 30 yrs out
Nearby sold comps map
Loading sold comps map…
Walkable amenities ~0.75 mi
Loading nearby amenities…
Taxation est. · year 1
- Rental income
- $25,464
- − Mortgage interest
- −$13,724
- − Property taxes
- −$1,086
- − Insurance
- −$6,344
- − Repairs & maintenance
- −$2,037
- − Management
- −$2,037
- − Depreciation
- −$7,127
- Taxable loss
- −$6,891
- Est. tax savings @ 24.0%
- +$1,654
- After-tax cash flow
- $-1,077/yr
For passive investors: Depreciation is non-cash, so a rental often shows a tax loss while cash-flowing — sheltering income. Rental losses are passive: they offset passive income freely, and up to $25,000/yr can offset ordinary (W-2) income if you actively participate and your MAGI is under $100k (phasing out to $0 by $150k); unused losses carry forward. On sale, claimed depreciation is recaptured at up to 25%, and gains may owe capital-gains tax (a 1031 exchange can defer both). Figures are a year-1 estimate at your 24.0% rate — not tax advice; consult a CPA.
Schools (NCES district)
- District
- Los Lunas Public Schools
- NCES district ID
- 3501680
- Math proficiency
- 20% —
- Reading proficiency
- 34% —
- Median HH income
- $44,438
- Composite
- 26.11/100
- National rank
- #12724
- State rank
- #34 of 95 in NM
Livability — Bosque Farms
- Score
- 72/100
- State rank
- #11
- US rank
- #6093
Category grades
Schools grade is shown separately in the Schools card above.
Census & demographics
- Census place
- Bosque Farms, NM
- County
- Valencia County · 68,779 people
- Metro
- Albuquerque, NM
- Population (ZIP)
- 47,514
- Household income
- $60,902
- Rent vs Own
- Severe rent burden
- 602.0
Population outlook (Valencia County) Hauer SSP2
- Today (2025)
- 73,788 people
- By 2030
- 72,101 · -2.3%
- By 2040
- 67,930 · -7.9%
- By 2050
- 63,191 · -14.4%
- By 2075
- 53,644 · -27.3%
- By 2100
- 40,882 · -44.6%
Race, ethnicity, and origin ACS 2023
- Neighborhood character
- Majority Hispanic (63%)
- Race & ethnicity
- Hispanic / Latino 63% White 30% Two or more races 29% Native American 4% Black 1%
- Hispanic origin (detail)
- Mexican 38%
- Common ancestry
- Serbian 1% Russian 1% Slovak 1%
- Foreign-born
- 8% · Canada
- Languages at home
- 71% English-only · Spanish 27%
Political lean MEDSL · Valencia
- 2024 margin
- R (+16.4) · D 40.9% · R 57.3% · Other 1.8%
- 2008→2024 swing
- -24.1pp toward R · 2008: 7.7pp · 2024: -16.4pp
- All cycles
- 2024: R+16.4 2020: R+9.6 2016: R+8.7 2012: D+2.5 2008: D+7.7
Not yet ingested
- Civics
- —
Market trends
- HPI YoY
- ▼ -85.17%
- Current HPI
- 201.0508
- Rent YoY
- ▲ 33.16%
- Metro
- Albuquerque, NM
- State GDP YoY
- —
- F500 in state
- 0
Price history
+233.3% since first listed7 events — show timeline
- 2026-04-06 Listed $250,000 Southwest MLS
- 2016-10-03 Sold (Public Records) — Public Records
- 2016-08-22 Delisted — Southwest MLS
- 2016-08-22 Delisted — Southwest MLS
- 2016-06-26 Listed $75,000 Southwest MLS
- 2016-05-16 Listed $75,000 Southwest MLS
- 2013-01-11 Sold (Public Records) — Public Records
Property tax history
+1.7%/yrLatest (2025): $1,086 · +26.8% YoY. Source: county tax records.
Cash-flow waterfall
monthlySold comps — $/sqft
last 12 mo · ≤1 miLoading sold comps…