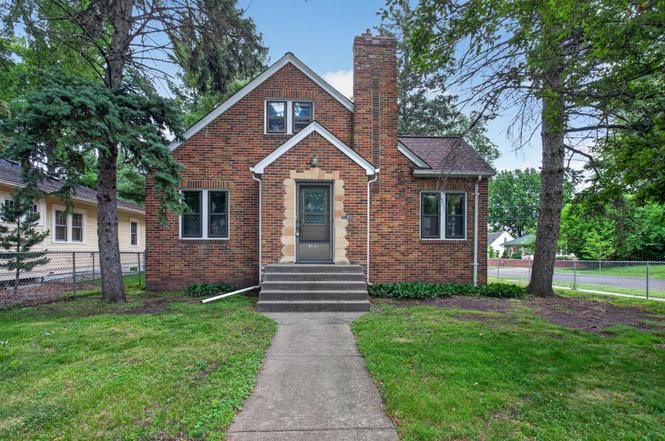
1262 Edgcumbe Rd · St. Paul, MN
Flood risk 1/10 · Minimal
- FEMA flood zone
- X (unshaded)
- Chance of flooding over 30 yrs
- 0.0%
- Est. flood insurance / yr
- $473 – $860
Fire risk 1/10 · Minimal
- Est. fire insurance / yr
- $888 – $1,650
Heat risk 2/10 · Minimal
- Hot days now (above 99°F)
- 7 days/yr
- Hot days in 30 yrs
- 14 days/yr
Wind risk 2/10 · Minimal
- Chance of severe wind over 30 yrs
- —
Air-quality risk 2/10 · Minimal
- Unhealthy air days now
- 1 days/yr
- Unhealthy air days in 30 yrs
- 1 days/yr
Risk factors via First Street. Map © Google.
Why this score? — see what drove the D- grade
The composite is a weighted blend of 9 inputs, each scored 0–100. Each bar is that input's sub-score; the figure is the points it added to the 100-point composite (weight × sub-score).
- Cash flow +12.8/30.0
- ARV discount +7.5/15.0
- 1% rule +4.2/10.0
- DSCR +3.8/10.0
- Rent growth +3.3/5.0
- Livability +2.5/5.0
- Condition / age +2.5/5.0
- Schools +2.4/10.0
- Appreciation +0.0/10.0
$299,900
🖨 Deal sheet (PDF) 📄 Offer letter ✓ Due diligence
Listing remarks
* * HIGHEST AND BEST DEADLINE MONDAY, JUNE 15 AT 9 PM * * Classic Brick Charm on Edgcumbe! This 2 bed, 1 bath home with tons of potential is available now! Traditional kitchen with built-in cabinetry, formal dining room, and brick decorative fireplace in the living room with hardwood floors. Oversized main level bedroom and a vintage full bathroom! Upstairs you have a smaller bedroom that could be expanded into the attic. Tons of potential in this home, or just love it as is! As-is sale for this property.
Key facts
- Brick charm
- Built-in cabinetry
- Decorative fireplace
Tags
Property features AI
Exterior
- Parking: Asphalt parking; Electric vehicle capability; 2-car garage
- Utilities: City water connected; City sewer connected; Natural gas fuel
- Home design: Residential property; One-and-one-half level design; Main floor primary bedroom
- Construction: Brick construction; Block foundation; Pitched roof; Foundation area listed as 1,115
- Exterior features: Stone exterior accents; Chain link fencing; Corner lot with light tree coverage; Public transit within about 6 blocks; Curbed, paved streets with sidewalks, street lights and storm sewer (public maintained road)
Interior
- Kitchen: Kitchen with breakfast bar and eat-in space; Kitchen/dining room layout
- Bedrooms: 2 bedrooms — one on the main level, one on the upper level
- Flooring: Hardwood and tile flooring
- Bathrooms: 1 full bathroom on the main floor
- Heating & cooling: Forced air heating; Central air conditioning
- Interior features: Hardwood floors; Tile floors; Natural woodwork; Kitchen window; Main floor primary bedroom; Basement partially finished with storage space; Brick decorative fireplace (1)
- Laundry & utility: Washer and dryer hookups; Laundry in basement with utility sink
Neighborhood map
What this means for you Summary
Snapshot
- This is a 2-bed/1.0-bath single-family listed at $300k.
Deal economics
- At list price, monthly cash flow is $-28 ($-333/yr) — negative.
- To cash-flow at today's rent, offer at most $295k (1.6% below list).
- To meet the 1% rule (rent ≥ 1% of price), the offer needs to be $277k (7.7% below list).
- Recommended offer: $277k (7.7% below list) — sets the bar for 1% rule.
Location & tenants
- Location reads: area grade D — affects rentability + tenant quality, not the cash-flow math above.
- St. Paul Public School District (urban): math 21% / reading 33% proficiency, ranked #270 of 301 in MN (top 90%) — low school quality limits family demand, transient renter base, plan for 1-2y turnover; 64% free/reduced lunch — lower-income household profile, screen leases tightly.
- Zoned schools: Randolph Heights Elementary (math 62% / reading 62%, grade B, #180 of 857 statewide, top 23%, 437 students, 31% FRL); Hidden River Middle School (math 21% / reading 39%, grade F, #199 of 258 statewide, top 78%, 559 students, 61% FRL); Central Senior High (math 52% / reading 67%, grade C+, #46 of 471 statewide, top 11%, 1,691 students, 49% FRL) — zoned schools average 47% FRL vs 64% district-wide (17 pts lower); this property's tenant base skews higher-income than the district average.
- Zoned-school proficiency averages 50% at this address vs 27% district-wide (+24 pts) — the actual schools serving this property are materially stronger than the St. Paul Public School District average implies; a family-tenant draw the district grade alone would hide.
- Market conditions: Rents rising (+3.1%/yr); 128 active listings in the ZIP; 3 comparable units currently listed for rent nearby; rentals leasing fast (median 4d on market — plan ~1-2 weeks tenant-placement turnaround); solid renter incomes; 1,202 units permitted in Ramsey County in 2024 (880 in 5+ unit buildings).
- This rent runs 31% of the median local income ($107k/yr) — at the standard rent-burdened threshold; future hikes will face affordability resistance.
Forward outlook
- Local home prices are declining (-3.0%/yr); year-one equity from $2k of loan paydown is wiped out by about $9k of value loss. Plan a longer hold.
- Ramsey County population projected at +27% by 2050 — long-run rental-demand tailwind backs the buy-and-hold thesis.
Negotiation context
- Only 5 days on market — expect competitive offers; lowballing is unlikely to land.
Risks & watch-outs
- Watch-outs: built in 1938 — expect roof / HVAC / electrical / plumbing capex.
Questions for the listing agent
- What do current leases actually rent for vs. the listed asking? Can we see a recent rent roll and the last 12 months of T-12 income?
- Built in 1938 — when were the roof, HVAC, electrical panel, plumbing, and water heater last replaced?
- Is there a deadline driving the sale (1031 exchange, divorce, estate, relocation)? That informs how much negotiation room exists.
- The area grade is low — what's the realistic commute time and amenity access for the typical tenant pool here? Any planned neighborhood developments (good or bad) we should know about?
- What's the average days-on-market for RENTAL listings here right now (not sales)? A rising rental-DOM trend means longer vacancies and softer asking-rent achievability than the comps imply.
- What's the recent tenant-quality profile in this submarket — average credit score on applications, eviction rate, late-payment / NSF rate, and stable-employment percentage? A property-management company in the area should have these aggregated.
- How much new for-sale + rental construction is in the pipeline within 1–3 miles? Heavy new supply typically softens prices + rents 12–24 months out; constrained supply supports both.
Investment metrics
- 1% rule
- 0.92% ✗
- Cap rate
- 6.18%
- Cash-on-cash
- -0.40%
- DSCR
- 0.98
- GRM
- 9.0
CMA / ARV
No comps found within radius.
Projected returns pro-forma
-3.0% appreciation · 3.15% rent growth · sell at horizon
- IRR
- -16.7%
- Equity multiple
- 0.41×
- Total profit
- $-49,816
- Equity at exit
- $44,716
- IRR
- -8.2%
- Equity multiple
- 0.48×
- Total profit
- $-43,410
- Equity at exit
- $25,930
Cash invested: $83,972 (down + closing). Projections, not guarantees.
Landlord ↔ Tenant lean methodology
- Overall (STATE)
- 46 Balanced
- State Minnesota
- 46 Balanced · D+2
- County
- — inherits STATE
- City
- — inherits STATE
ZIP-level market 55105
- Rents YoY
- 3.1%
- Active inventory
- 128
- Price-to-rent
- 9.0×
Monthly cashflow live
- Estimated rent
- $2,767 medium interval (Pro) →
- Mortgage (P&I)
- −$1,573
- Tax from tax record
- −$516 /mo · $6,190/yr
- Insurance
- −$125
- HOA
- −$0
- Vacancy / Maint / Mgmt
- −$581
- Net cashflow
- $-28
Break-even live
Sensitivity live
| Price | -10% $142 | -5% $57 | +0% $-28 | +5% $-113 | +10% $-197 |
|---|---|---|---|---|---|
| Rent | -10% $-246 | -5% $-137 | +0% $-28 | +5% $82 | +10% $191 |
| Rate | -1.0pp $123 | -0.5pp $49 | base $-28 | +0.5pp $-105 | +1.0pp $-184 |
UW: 25.0% down · 7.5% · 30yr · 1.5% tax · 5.0% vac · 8.0% maint · 8.0% mgmt
Financing live
Cash to close
- Down payment
- $74,975
- Closing costs
- $8,997
- Reserves months
- —
- Total cash needed
- —
Loan-product check · same deal, 3 products live
Conventional
25% down · 7.5% · 30yr
- Down + closing
- —
- Monthly P&I
- —
- Monthly cashflow
- —
- DSCR
- —
- Eligible?
- —
Personal DTI + credit; lowest rate.
DSCR
20% down · 8.5% · 30yr
- Down + closing
- —
- Monthly P&I
- —
- Monthly cashflow
- —
- DSCR
- —
- Eligible?
- —
No personal income docs; deal must DSCR.
Hard money
10% down · 12.0% · 12mo
- Down + closing
- —
- Monthly P&I
- —
- Monthly cashflow
- —
- DSCR
- —
- Eligible?
- —
Short-term bridge; refi at stabilization.
Rent comps 3 comps
| Address | Beds | Baths | Sqft | Rent | $/sqft | DOM | Units | Dist |
|---|---|---|---|---|---|---|---|---|
| 470 Lexington Pkwy S Saint Paul, MN | 2.0 | 1.0–2.0 | 1175 | $3,500 | $2.98 | 3d | 19 | 0.20mi |
| 740 Victoria St S Saint Paul, MN | 3.0 | 1.0–2.0 | 1076 | $2,785 | $2.59 | 0d | 38 | 0.98mi |
| 150 Snelling Ave N St Paul, MN | 2.0 | 1.0–2.0 | 741 | $2,598 | $3.51 | 3d | 8 | 1.49mi |
Listing history 6 events
-
2026-06-17status $299,900 Pending 5 DOM
-
2026-06-16days on market $299,900 Active 5 DOM
-
2026-06-15remarks 513-char remark
-
2026-06-15days on market $299,900 Active 4 DOM
-
2026-06-13remarks 452-char remark
-
2026-06-13$299,900 Active 2 DOM
ⓘ Source: listings_history table (triggers on properties + properties_extension) + one-shot
backfill from property_details.listing_events for pre-trigger history.
Tax reassessment forecast MN · Partial reset (capped growth)
- Current annual tax
- $6,190 · $516/mo
- Projected year-2 tax
- $6,190 · $516/mo
- Expected delta
- $0/yr ($0/mo · 0.0%)
ⓘ Screening estimate from a state-policy table — verify with the county assessor before closing.
Climate risk First Street
- Flood 1/10 Low FEMA zone X (unshaded) · 0% chance over 30 yrs
- Wildfire 1/10 Low
- Heat 2/10 Low 7 d/yr ≥99°F today · 14 d/yr by 30 yrs out
- Wind 2/10 Low
- Air quality 2/10 Low 1 unhealthy d/yr today · 1 by 30 yrs out
Nearby sold comps map
Loading sold comps map…
Walkable amenities ~0.75 mi
Loading nearby amenities…
Taxation est. · year 1
- Rental income
- $33,202
- − Mortgage interest
- −$16,799
- − Property taxes
- −$6,190
- − Insurance
- −$1,500
- − Repairs & maintenance
- −$2,656
- − Management
- −$2,656
- − Depreciation
- −$8,724
- Taxable loss
- −$5,324
- Est. tax savings @ 24.0%
- +$1,278
- After-tax cash flow
- $945/yr
For passive investors: Depreciation is non-cash, so a rental often shows a tax loss while cash-flowing — sheltering income. Rental losses are passive: they offset passive income freely, and up to $25,000/yr can offset ordinary (W-2) income if you actively participate and your MAGI is under $100k (phasing out to $0 by $150k); unused losses carry forward. On sale, claimed depreciation is recaptured at up to 25%, and gains may owe capital-gains tax (a 1031 exchange can defer both). Figures are a year-1 estimate at your 24.0% rate — not tax advice; consult a CPA.
Schools (NCES district)
- District
- St. Paul Public School District
- NCES district ID
- 2733840
- Math proficiency
- 21% ▼ -11.00%
- Reading proficiency
- 33% ▼ -7.00%
- Median HH income
- $48,316
- Composite
- 23.51/100
- National rank
- #7868
- State rank
- #270 of 301 in MN
Livability — St. Paul
No livability data for this city. (Only ~50 U.S. cities are tracked.)
Census & demographics
- Census place
- St. Paul, MN
- County
- Ramsey County · 542,837 people
- City population
- 280,599
- Metro
- Minneapolis-St. Paul-Bloomington, MN-WI
- Population (ZIP)
- 28,617
- Household income
- $107,248
- Rent vs Own
- Severe rent burden
- 909.0
Population outlook (Ramsey County) Hauer SSP2
- Today (2025)
- 603,431 people
- By 2030
- 636,459 · +5.5%
- By 2040
- 700,596 · +16.1%
- By 2050
- 765,819 · +26.9%
- By 2075
- 929,297 · +54.0%
- By 2100
- 1,053,924 · +74.7%
Race, ethnicity, and origin ACS 2023
- Neighborhood character
- Predominantly White (82%)
- Race & ethnicity
- White 82% Two or more races 7% Hispanic / Latino 5% Asian 4% Black 3%
- Hispanic origin (detail)
- Mexican 2%
- Common ancestry
- Portuguese 11% Romanian 4% Lithuanian 4%
- Foreign-born
- 4% · Canada, China, South Korea
- Languages at home
- 91% English-only · Spanish 4% German/W. Germanic 1% Other Asian/Pacific 1%
Political lean MEDSL · Ramsey
- 2024 margin
- Solid D (+43.3) · D 70.5% · R 27.2% · Other 2.3%
- 2008→2024 swing
- +9.4pp toward D · 2008: 33.9pp · 2024: 43.3pp
- All cycles
- 2024: D+43.3 2020: D+45.4 2016: D+39.4 2012: D+35.3 2008: D+33.9
Not yet ingested
- Civics
- —
Market trends
- HPI YoY
- ▼ -562.23%
- Current HPI
- 223.6008
- Rent YoY
- ▲ 3.15%
- Metro
- Minneapolis-St. Paul-Bloomington, MN-WI
- State GDP YoY
- ▲ 2.41%
- F500 in state
- 34
Industry mix (Fortune 500 HQ in MN)
| Industry | F500 HQs | Revenue |
|---|---|---|
| Healthcare | 2 | $407B |
|
||
| Retail | 2 | $150B |
|
||
| Consumer Goods | 2 | $32B |
|
||
| Industrial Machinery | 2 | $6B |
|
||
| Agriculture | 1 | $40B |
|
||
| Healthcare / Medical Devices | 1 | $32B |
|
||
Price history
1 event — show timeline
- 2026-06-11 Listed $299,900 NORTHSTARMLS as Distributed by MLS Grid
Property tax history
+4.2%/yrLatest (2025): $6,190 · +8.1% YoY. Source: county tax records.
Cash-flow waterfall
monthlySold comps — $/sqft
last 12 mo · ≤1 miLoading sold comps…