 Triplex
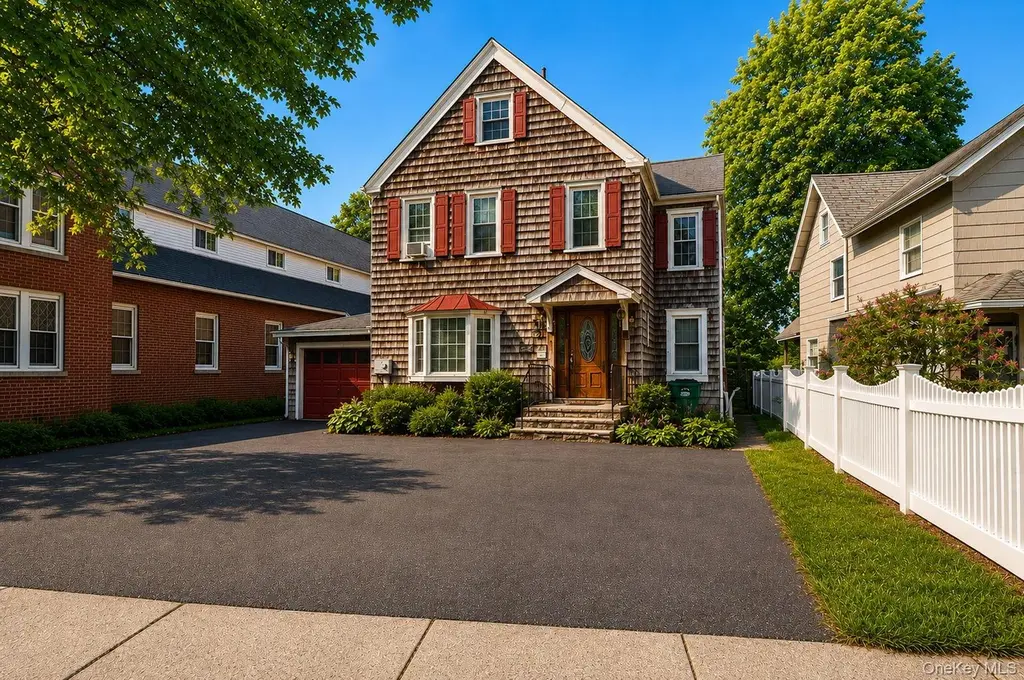
53 Main St · Highland, NY
Flood risk 1/10 · Minimal
- FEMA flood zone
- X (unshaded)
- Chance of flooding over 30 yrs
- 0.0%
- Est. flood insurance / yr
- $473 – $860
Fire risk 3/10 · Minor
- Est. fire insurance / yr
- $691 – $1,283
Heat risk 5/10 · Moderate
- Hot days now (above 98°F)
- 7 days/yr
- Hot days in 30 yrs
- 16 days/yr
Wind risk 4/10 · Minor
- Chance of severe wind over 30 yrs
- 11.0%
Air-quality risk 2/10 · Minimal
- Unhealthy air days now
- 1 days/yr
- Unhealthy air days in 30 yrs
- 2 days/yr
Risk factors via First Street. Map © Google.
Why this score? — see what drove the B grade
The composite is a weighted blend of 9 inputs, each scored 0–100. Each bar is that input's sub-score; the figure is the points it added to the 100-point composite (weight × sub-score).
- Cash flow +30.0/30.0
- 1% rule +10.0/10.0
- DSCR +10.0/10.0
- ARV discount +7.5/15.0
- Schools +5.2/10.0
- Livability +3.8/5.0
- Rent growth +2.5/5.0
- Condition / age +2.5/5.0
- Appreciation +0.0/10.0
$529,000
🖨 Deal sheet 📄 Offer letter ✓ Due diligence
Multi-family units
County records classify this as Multi-Family (2-4 Unit). Listing-text estimate: 3 units. confirmed
Listing remarks
Some properties ask you to be patient. This one puts money in your pocket from closing day. Fully occupied and cash flowing, this commercial-residential multi-family sits on Main Street in the heart of Highland, steps from the Walkway Over the Hudson, one of the most visited destinations in the entire Hudson Valley. Two tenanted units. Month-to-month leases. Current rents below market value. A new owner inherits immediate income with a clear and near-term path to increased returns, no waiting, no buildout, no guesswork. The lower unit offers 3 bedrooms, 2 full baths, a private primary suite with deck access overlooking a secluded backyard, wood-burning fireplace, custom kitchen with stainle
Key facts
- Custom kitchen
- Two tenanted units
- 5,227 sq ft lot
Tags
Property features AI
Exterior
- Parking: Driveway parking; Off-street parking; 2-car garage
- Utilities: Public sewer; Cable connected; Electricity connected
- Home design: Duplex
- Construction: Frame construction
- Exterior features: Back yard; Near public transit; Partially wooded lot; Shed(s)
Interior
- Kitchen: Eat-in kitchen; Pantry
- Bedrooms: Includes a main-level master bedroom
- Flooring: Other flooring types
- Bathrooms: Full bathroom on the first floor; Primary bathroom
- Heating & cooling: Hot water heating; Wall/window air conditioning units
- Interior features: First-floor bedroom; First-floor full bathroom; Ceiling fans; Eat-in kitchen; Entrance foyer; Formal dining room; High ceilings; Pantry; Primary bathroom; Master bedroom on main level; Storage
- Laundry & utility: Laundry located in the basement
Neighborhood map
What this means for you Summary
Snapshot
- This is a 3 × 2-bed/?-bath units multifamily listed at $529k.
Deal economics
- At list price, monthly cash flow is $2k ($30k/yr) — positive. Per door: $831/mo.
- The deal already cash-flows at list — no discount required.
- Meets the 1% rule at list price ($8k rent vs $529k).
- Cap rate 12.0% vs local median 2.6% in Highland — top-decile yield for the area; either an underpriced asset or a hidden risk that comps aren't pricing in. Stress-test before assuming the spread holds.
Location & tenants
- Location reads 75/100 on livability (#251 in NY, #3,941 nationally) — a middle-class / working-renter tenant base. Strengths: employment A+, housing A+, health & safety A+; Watch: amenities F, commute F, cost of living D-.
- Highland Central School District (suburban): math 50% / reading 69% proficiency, ranked #227 of 590 in NY (top 38%) — acceptable for families but not a draw, mixed tenant base, ~2y average lease.
- Zoned schools: Highland Elementary School (math 46% / reading 67%, grade C+, #899 of 2,108 statewide, top 43%, 638 students, 38% FRL); Highland Middle School (math 27% / reading 57%, grade D-, #379 of 729 statewide, top 54%, 376 students, 42% FRL); Highland High School (math 87% / reading 92%, grade A+, #265 of 1,100 statewide, top 26%, 512 students, 41% FRL).
- Market conditions: 107 active listings in the ZIP; 464 units permitted in Ulster County in 2024 (170 in 5+ unit buildings).
Forward outlook
- Local home prices are declining (-3.0%/yr); year-one equity from $4k of loan paydown is wiped out by about $16k of value loss. Plan a longer hold.
- Ulster County population projected at -14% by 2050 — secular population decline; favor cash flow + early exit over multi-decade hold.
- At projected returns (-3.0% appreciation + 3.0% rent growth), your $148k cash investment doubles in ~6 years — after that, you're playing with house money.
Negotiation context
- Only 12 days on market — expect competitive offers; lowballing is unlikely to land.
- 6 sale attempts since 9y ago with the ask held roughly flat each time — persistent listings suggest the price (not the market) is what's stuck; bring a comps-based counter.
- Current owner paid $200k; list at $529k implies a 164% gain — meaningful room to come down on a strong offer.
Risks & watch-outs
- Watch-outs: built in 1900 — expect roof / HVAC / electrical / plumbing capex.
- Climate carrying-cost: extreme-heat days projected 7→16/yr by 2055 (HVAC capex compounding) — expect insurance premiums to compound above CPI over the hold.
Questions for the listing agent
- Can we see the unit-by-unit rent roll, current vacancy, and any below-market leases? What's the average tenancy length?
- What capital expenditures (roof, boiler, parking lot, exteriors) have been made in the last 5 years, and what's planned in the next 2?
- Built in 1900 — when were the roof, HVAC, electrical panel, plumbing, and water heater last replaced?
- Is there a deadline driving the sale (1031 exchange, divorce, estate, relocation)? That informs how much negotiation room exists.
- What's the average days-on-market for RENTAL listings here right now (not sales)? A rising rental-DOM trend means longer vacancies and softer asking-rent achievability than the comps imply.
- What's the recent tenant-quality profile in this submarket — average credit score on applications, eviction rate, late-payment / NSF rate, and stable-employment percentage? A property-management company in the area should have these aggregated.
- How much new apartment / multifamily construction is in the pipeline within 1–3 miles? Heavy new supply (>2% of stock underway) typically softens rents 12–24 months out; light construction supports rent growth.
Investment metrics
- 1% rule
- 1.54% ✓
- Cap rate
- 11.95%
- Cash-on-cash
- 20.21%
- DSCR
- 1.90
- GRM
- 5.4
CMA / ARV
No comps found within radius.
Projected returns pro-forma
-3.0% appreciation · 3.0% rent growth · sell at horizon
- IRR
- 12.5%
- Equity multiple
- 1.50×
- Total profit
- $73,430
- Equity at exit
- $78,876
- IRR
- 21.4%
- Equity multiple
- 2.82×
- Total profit
- $269,679
- Equity at exit
- $45,738
Cash invested: $148,120 (down + closing). Projections, not guarantees.
Landlord ↔ Tenant lean methodology
- Overall (STATE)
- 15 Strongly Tenant-Friendly
- State New York
- 15 Strongly Tenant-Friendly · D+10
- County
- — inherits STATE
- City
- — inherits STATE
ZIP-level market 12528
- Home prices YoY
- -20.5%
- Active inventory
- 107
- Price-to-rent
- 16.3×
Monthly cashflow live
- Estimated rent
- $8,130 medium interval (Pro) →
- Mortgage (P&I)
- −$2,774
- Tax from tax record
- −$934 /mo · $11,207/yr
- Insurance
- −$220
- HOA
- −$0
- Vacancy / Maint / Mgmt
- −$1,707
- Net cashflow
- $2,494
Break-even live
3-unit breakdown (identical units grouped — click to expand)
| Units | Beds | Baths | Est. rent |
|---|---|---|---|
| 3× units | 2 | — | $8,130 |
| #1 | 2 | — | $2,710 |
| #2 | 2 | — | $2,710 |
| #3 | 2 | — | $2,710 |
| Total (3 units) | $8,130 | ||
UW: 25.0% down · 7.5% · 30yr · 1.5% tax · 5.0% vac · 8.0% maint · 8.0% mgmt
Financing live
Cash to close
- Down payment
- $132,250
- Closing costs
- $15,870
- Reserves months
- —
- Total cash needed
- —
Loan-product check · same deal, 3 products live
Conventional
25% down · 7.5% · 30yr
- Down + closing
- —
- Monthly P&I
- —
- Monthly cashflow
- —
- DSCR
- —
- Eligible?
- —
Personal DTI + credit; lowest rate.
DSCR
20% down · 8.5% · 30yr
- Down + closing
- —
- Monthly P&I
- —
- Monthly cashflow
- —
- DSCR
- —
- Eligible?
- —
No personal income docs; deal must DSCR.
Hard money
10% down · 12.0% · 12mo
- Down + closing
- —
- Monthly P&I
- —
- Monthly cashflow
- —
- DSCR
- —
- Eligible?
- —
Short-term bridge; refi at stabilization.
Listing history 10 events
-
2026-06-18days on market $529,000 Active 12 DOM
-
2026-06-17days on market $529,000 Active 11 DOM
-
2026-06-16days on market $529,000 Active 10 DOM
-
2026-06-15days on market $529,000 Active 9 DOM
-
2026-06-13days on market $529,000 Active 7 DOM
-
2026-06-12days on market $529,000 Active 6 DOM
-
2026-06-09days on market $529,000 Active 3 DOM
-
2026-06-08days on market $529,000 Active 2 DOM
-
2026-06-07remarks 699-char remark
-
2026-06-07$529,000 Active 1 DOM
ⓘ Source: listings_history table (triggers on properties + properties_extension) + one-shot
backfill from property_details.listing_events for pre-trigger history.
Tax reassessment forecast NY · Partial reset (capped growth)
- Current annual tax
- $11,207 · $934/mo
- Projected year-2 tax
- $11,207 · $934/mo
- Expected delta
- $0/yr ($0/mo · 0.0%)
ⓘ Screening estimate from a state-policy table — verify with the county assessor before closing.
Climate risk First Street
- Flood 1/10 Low FEMA zone X (unshaded) · 0% chance over 30 yrs
- Wildfire 3/10 Moderate
- Heat 5/10 Major 7 d/yr ≥98°F today · 16 d/yr by 30 yrs out
- Wind 4/10 Moderate 11% chance of damaging wind over 30 yrs
- Air quality 2/10 Low 1 unhealthy d/yr today · 2 by 30 yrs out
Nearby sold comps map
Loading sold comps map…
Walkable amenities ~0.75 mi
Loading nearby amenities…
Taxation est. · year 1
- Rental income
- $97,560
- − Mortgage interest
- −$29,632
- − Property taxes
- −$11,207
- − Insurance
- −$2,645
- − Repairs & maintenance
- −$7,805
- − Management
- −$7,805
- − Depreciation
- −$15,389
- Taxable income
- $23,077
- Est. tax owed @ 24.0%
- −$5,539
- After-tax cash flow
- $24,393/yr
For passive investors: Depreciation is non-cash, so a rental often shows a tax loss while cash-flowing — sheltering income. Rental losses are passive: they offset passive income freely, and up to $25,000/yr can offset ordinary (W-2) income if you actively participate and your MAGI is under $100k (phasing out to $0 by $150k); unused losses carry forward. On sale, claimed depreciation is recaptured at up to 25%, and gains may owe capital-gains tax (a 1031 exchange can defer both). Figures are a year-1 estimate at your 24.0% rate — not tax advice; consult a CPA.
Schools (NCES district)
- District
- Highland Central School District
- NCES district ID
- 3614400
- Math proficiency
- 50% ▼ -3.00%
- Reading proficiency
- 69% ▲ 14.00%
- Median HH income
- $63,600
- Composite
- 51.89/100
- National rank
- #1652
- State rank
- #227 of 590 in NY
Livability — Highland
- Score
- 75/100
- State rank
- #251
- US rank
- #3941
Category grades
Schools grade is shown separately in the Schools card above.
Census & demographics
- Census place
- Highland, NY
- Population (ZIP)
- 13,818
Population outlook (Ulster County) Hauer SSP2
- Today (2025)
- 175,887 people
- By 2030
- 171,876 · -2.3%
- By 2040
- 161,771 · -8.0%
- By 2050
- 151,470 · -13.9%
- By 2075
- 133,023 · -24.4%
- By 2100
- 113,504 · -35.5%
Race, ethnicity, and origin ACS 2023
- Neighborhood character
- Predominantly White (72%)
- Race & ethnicity
- White 72% Hispanic / Latino 10% Two or more races 9% Asian 7% Black 3%
- Hispanic origin (detail)
- Mexican 4% Puerto Rican 2% Cuban 1% Dominican 1%
- Common ancestry
- Romanian 4% Scotch-Irish 2% Slovak 2%
- Foreign-born
- 11% · Canada, Vietnam, China
- Languages at home
- 81% English-only · Spanish 9% Vietnamese 6% Other Indo-European 2%
Political lean MEDSL · Ulster
- 2024 margin
- D (+18.7) · D 59.3% · R 40.7%
- 2008→2024 swing
- -4.9pp toward R · 2008: 23.6pp · 2024: 18.7pp
- All cycles
- 2024: D+18.7 2020: D+20.9 2016: D+9.1 2012: D+21.9 2008: D+23.6
Not yet ingested
- Civics
- —
Market trends
- HPI YoY
- ▼ -84.26%
- Current HPI
- 327.3196
- Rent YoY
- —
- Metro
- —
- State GDP YoY
- ▲ 2.60%
- F500 in state
- 92
Industry mix (Fortune 500 HQ in NY)
| Industry | F500 HQs | Revenue |
|---|---|---|
| Financial Services | 10 | $950B |
|
||
| Consumer Goods | 9 | $162B |
|
||
| Insurance | 4 | $225B |
|
||
| Telecommunications | 2 | $144B |
|
||
| Pharmaceuticals | 2 | $112B |
|
||
| Media / Entertainment | 2 | $69B |
|
||
Price history
+487.8% since first listed12 events — show timeline
- 2026-06-05 Listed $529,000 OneKey® MLS as Distributed by MLS Grid
- 2024-02-03 Listing Removed — OneKey® MLS as Distributed by MLS Grid
- 2024-02-03 Listing Removed — OneKey® MLS as Distributed by MLS Grid
- 2021-06-12 Listing Removed — OneKey® MLS as Distributed by MLS Grid
- 2021-04-19 Listed $455,000 OneKey® MLS as Distributed by MLS Grid
- 2021-04-17 Listing Removed — OneKey® MLS as Distributed by MLS Grid
- 2020-07-17 Listed $455,000 OneKey® MLS as Distributed by MLS Grid
- 2020-07-17 Listed $475,000 OneKey® MLS as Distributed by MLS Grid
- 2017-08-08 Listed $325,000 OneKey® MLS as Distributed by MLS Grid
- 2017-08-08 Listed $325,000 HVCRMLS
- 2003-10-03 Sold (Public Records) $200,000 Public Records
- 1995-06-09 Sold (Public Records) $90,000 Public Records
Property tax history
+1.1%/yrLatest (2025): $11,207 · +3.6% YoY. Source: county tax records.
Cash-flow waterfall
monthlySold comps — $/sqft
last 12 mo · ≤1 miLoading sold comps…