17297 W Outer Dr · Dearborn Heights, MI
Flood risk No data
- FEMA flood zone
- —
- Chance of flooding over 30 yrs
- —
- Est. flood insurance / yr
- —
Fire risk No data
- Est. fire insurance / yr
- —
Heat risk No data
- Hot days now (above threshold)
- —
- Hot days in 30 yrs
- —
Wind risk No data
- Chance of severe wind over 30 yrs
- —
Air-quality risk No data
- Unhealthy air days now
- —
- Unhealthy air days in 30 yrs
- —
Risk factors via First Street. Map © Google.
Why this score? — see what drove the D grade
The composite is a weighted blend of 9 inputs, each scored 0–100. Each bar is that input's sub-score; the figure is the points it added to the 100-point composite (weight × sub-score).
- Cash flow +15.0/30.0
- ARV discount +7.5/15.0
- 1% rule +5.0/10.0
- DSCR +5.0/10.0
- Livability +4.0/5.0
- Schools +2.8/10.0
- Rent growth +2.6/5.0
- Condition / age +2.5/5.0
- Appreciation +0.0/10.0
$16,000
🖨 Deal sheet 📄 Offer letter ✓ Due diligence
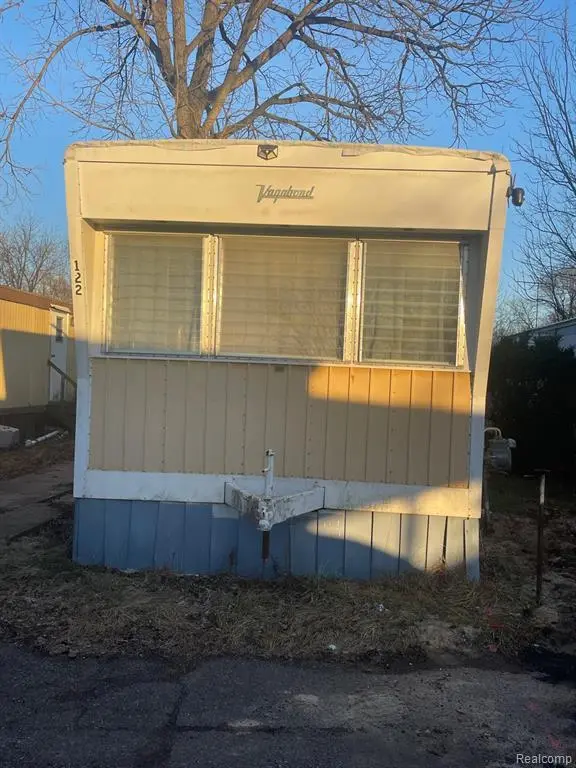
Listing remarks
MANUFACTURED HOME FOR SALE in Dearborn Heights - under $20,000. PLEASE NOTE: This is a MANUFACTURED/MOBILE HOME located in a manufactured home community. The SELLER DOES NOT OWN THE LAND. The home sits on a leased lot with LOT RENT of $480 per month, payable to the park. The park is for PRIMARY RESIDENCE ONLY - only owner-occupants/primary residents are permitted (no rentals/investors). Buyer must be approved by park management. 2 bedrooms - 1 bath. This affordable gem needs some work, but it's a blank canvas ready for your personal touch - bring your vision and make it your own! Buyer and buyer's agent to verify all information, lot rent, and park rules/approval requirements with park mana
Key facts
- 1,200 sq ft lot
- Built 1937
- Listed 4 days
Property features AI
Exterior
- Utilities: Public water
- Home design: Single-story manufactured home located in a MH park; Built in 1937; Located in the Supervisors Dearborn 2 community; Facing side: south (S)
- Construction: Aluminum construction; Piers foundation
- Exterior features: Aluminum exterior; Paved street frontage; Frontage approximately 20 feet
Interior
- Bedrooms: Two bedrooms, both on the entry level (each approx. 10 x 10)
- Bathrooms: One full bathroom on the entry level
- Heating & cooling: Forced air heating; Natural gas fuel
- Interior features: Total of 3 rooms
Neighborhood map
What this means for you Summary
Snapshot
- This is a 2-bed/1.0-bath manufactured listed at $16k.
Deal economics
- At list price, monthly cash flow is $891 ($11k/yr) — positive.
- The deal already cash-flows at list — no discount required.
- Meets the 1% rule at list price ($1k rent vs $16k).
- Cap rate 73.1% vs local median 5.5% in Dearborn Heights — top-decile yield for the area; either an underpriced asset or a hidden risk that comps aren't pricing in. Stress-test before assuming the spread holds.
Location & tenants
- Location reads 79/100 on livability (#82 in MI, #1,885 nationally) — a middle-class / working-renter tenant base. Strengths: commute A+, cost of living A+, housing A+; Watch: schools C-, crime D+, employment D+.
- Dearborn City School District (urban): math 26% / reading 39% proficiency, ranked #325 of 540 in MI (top 60%) — families likely to look elsewhere, expect single-tenant / working-renter base with shorter leases; 66% free/reduced lunch — lower-income household profile, screen leases tightly.
- Market conditions: Rents flat; 143 active listings in the ZIP; 3 comparable units currently listed for rent nearby; rentals at typical pace (median 18d on market — plan ~3-4 weeks tenant-placement turnaround); 2,639 units permitted in Wayne County in 2024 (1,216 in 5+ unit buildings).
Forward outlook
- Local home prices are declining (-3.0%/yr); year-one equity from $111 of loan paydown is wiped out by about $480 of value loss. Plan a longer hold.
- Wayne County population projected at -17% by 2050 — secular population decline; favor cash flow + early exit over multi-decade hold.
- At projected returns (-3.0% appreciation + 0.4% rent growth), your $4k cash investment doubles in ~1 year — after that, you're playing with house money.
Negotiation context
- Only 4 days on market — expect competitive offers; lowballing is unlikely to land.
Risks & watch-outs
- Watch-outs: built in 1937 — expect roof / HVAC / electrical / plumbing capex.
Questions for the listing agent
- Built in 1937 — when were the roof, HVAC, electrical panel, plumbing, and water heater last replaced?
- Is there a deadline driving the sale (1031 exchange, divorce, estate, relocation)? That informs how much negotiation room exists.
- Crime grade is D in this area — have there been break-ins, vandalism, or insurance claims at this property in the last 3 years? What carrier currently insures it and at what premium?
- The area grade is low — what's the realistic commute time and amenity access for the typical tenant pool here? Any planned neighborhood developments (good or bad) we should know about?
- What's the average days-on-market for RENTAL listings here right now (not sales)? A rising rental-DOM trend means longer vacancies and softer asking-rent achievability than the comps imply.
- What's the recent tenant-quality profile in this submarket — average credit score on applications, eviction rate, late-payment / NSF rate, and stable-employment percentage? A property-management company in the area should have these aggregated.
- How much new for-sale + rental construction is in the pipeline within 1–3 miles? Heavy new supply typically softens prices + rents 12–24 months out; constrained supply supports both.
Investment metrics
- 1% rule
- 7.92% ✓
- Cap rate
- 73.13%
- Cash-on-cash
- 238.69%
- DSCR
- 11.62
- GRM
- 1.1
CMA / ARV
No comps found within radius.
Projected returns pro-forma
-3.0% appreciation · 0.41% rent growth · sell at horizon
- IRR
- —
- Equity multiple
- 12.38×
- Total profit
- $50,961
- Equity at exit
- $2,386
- IRR
- —
- Equity multiple
- 24.43×
- Total profit
- $104,986
- Equity at exit
- $1,383
Cash invested: $4,480 (down + closing). Projections, not guarantees.
Landlord ↔ Tenant lean methodology
- Overall (STATE)
- 62 Landlord-Friendly
- State Michigan
- 62 Landlord-Friendly · EVEN
- County
- — inherits STATE
- City
- — inherits STATE
ZIP-level market 48127
- Rents YoY
- 0.4%
- Active inventory
- 143
- Price-to-rent
- 1.1×
Monthly cashflow live
- Estimated rent
- $1,268 medium interval (Pro) →
- Mortgage (P&I)
- −$84
- Tax est. 1.5%
- −$20 /mo · $240/yr
- Insurance
- −$7
- HOA
- −$0
- Vacancy / Maint / Mgmt
- −$266
- Net cashflow
- $891
Break-even live
UW: 25.0% down · 7.5% · 30yr · 1.5% tax · 5.0% vac · 8.0% maint · 8.0% mgmt
Financing live
Cash to close
- Down payment
- $4,000
- Closing costs
- $480
- Reserves months
- —
- Total cash needed
- —
Loan-product check · same deal, 3 products live
Conventional
25% down · 7.5% · 30yr
- Down + closing
- —
- Monthly P&I
- —
- Monthly cashflow
- —
- DSCR
- —
- Eligible?
- —
Personal DTI + credit; lowest rate.
DSCR
20% down · 8.5% · 30yr
- Down + closing
- —
- Monthly P&I
- —
- Monthly cashflow
- —
- DSCR
- —
- Eligible?
- —
No personal income docs; deal must DSCR.
Hard money
10% down · 12.0% · 12mo
- Down + closing
- —
- Monthly P&I
- —
- Monthly cashflow
- —
- DSCR
- —
- Eligible?
- —
Short-term bridge; refi at stabilization.
Rent comps 3 comps
| Address | Beds | Baths | Sqft | Rent | $/sqft | DOM | Units | Dist |
|---|---|---|---|---|---|---|---|---|
| 22330 W Warren Ave Redford Charter Twp, MI | 2.0 | 1.0 | 750 | $1,200 | $1.60 | 44d | 1 | 0.44mi |
| 7466 W Parkway St Redford, MI | 2.0 | 1.5 | 672 | $1,200 | $1.79 | 3d | 1 | 0.64mi |
| 6980 Town Ln Dearborn Heights, MI | 1.0 | 1.0 | 600 | $895 | $1.49 | 17d | 1 | 1.17mi |
Listing history 8 events
-
2026-06-18days on market $16,000 Active 4 DOM
-
2026-06-17remarks 699-char remark
-
2026-06-17days on market $16,000 Active 3 DOM
-
2026-06-16days on market $16,000 Active 2 DOM
-
2026-06-15days on market $16,000 Active 1 DOM
-
2026-06-15days on market $16,000 Active 3 DOM
-
2026-06-13remarks 343-char remark
-
2026-06-13$16,000 Active 1 DOM
ⓘ Source: listings_history table (triggers on properties + properties_extension) + one-shot
backfill from property_details.listing_events for pre-trigger history.
Nearby sold comps map
Loading sold comps map…
Walkable amenities ~0.75 mi
Loading nearby amenities…
Taxation est. · year 1
- Rental income
- $15,216
- − Mortgage interest
- −$896
- − Property taxes
- −$240
- − Insurance
- −$80
- − Repairs & maintenance
- −$1,217
- − Management
- −$1,217
- − Depreciation
- −$465
- Taxable income
- $11,099
- Est. tax owed @ 24.0%
- −$2,664
- After-tax cash flow
- $8,030/yr
For passive investors: Depreciation is non-cash, so a rental often shows a tax loss while cash-flowing — sheltering income. Rental losses are passive: they offset passive income freely, and up to $25,000/yr can offset ordinary (W-2) income if you actively participate and your MAGI is under $100k (phasing out to $0 by $150k); unused losses carry forward. On sale, claimed depreciation is recaptured at up to 25%, and gains may owe capital-gains tax (a 1031 exchange can defer both). Figures are a year-1 estimate at your 24.0% rate — not tax advice; consult a CPA.
Schools (NCES district)
- District
- Dearborn City School District
- NCES district ID
- 2611600
- Math proficiency
- 26% ▼ -14.00%
- Reading proficiency
- 39% ▼ -8.00%
- Median HH income
- $46,884
- Composite
- 27.93/100
- National rank
- #6864
- State rank
- #325 of 540 in MI
Livability — Dearborn Heights
- Score
- 79/100
- State rank
- #82
- US rank
- #1885
Category grades
Schools grade is shown separately in the Schools card above.
Census & demographics
- Census place
- Dearborn Heights, MI
- County
- Wayne County · 1,562,939 people
- City population
- 61,771
- Metro
- Detroit-Warren-Dearborn, MI
- Population (ZIP)
- 39,646
- Household income
- $60,742
- Rent vs Own
- Severe rent burden
- 1196.0
Population outlook (Wayne County) Hauer SSP2
- Today (2025)
- 1,675,273 people
- By 2030
- 1,620,300 · -3.3%
- By 2040
- 1,502,341 · -10.3%
- By 2050
- 1,384,039 · -17.4%
- By 2075
- 1,124,592 · -32.9%
- By 2100
- 881,193 · -47.4%
Race, ethnicity, and origin ACS 2023
- Neighborhood character
- Predominantly White (85%)
- Race & ethnicity
- White 85% Black 8% Two or more races 3% Hispanic / Latino 3% Asian 2%
- Common ancestry
- Arab 8% Romanian 7% Lithuanian 2%
- Foreign-born
- 31% · Canada
- Languages at home
- 46% English-only · Arabic 45% Russian/Polish/Slavic 2% Other Indo-European 2%
Political lean MEDSL · Wayne
- 2024 margin
- Strong D (+29.0) · D 62.7% · R 33.7% · Other 3.6%
- 2008→2024 swing
- -20.5pp toward R · 2008: 49.5pp · 2024: 29.0pp
- All cycles
- 2024: D+29.0 2020: D+38.1 2016: D+37.3 2012: D+46.9 2008: D+49.5
Not yet ingested
- Civics
- —
Market trends
- HPI YoY
- ▼ -319.04%
- Current HPI
- 225.9407
- Rent YoY
- ▲ 0.41%
- Metro
- Detroit-Warren-Dearborn, MI
- State GDP YoY
- ▲ 1.37%
- F500 in state
- 28
Industry mix (Fortune 500 HQ in MI)
| Industry | F500 HQs | Revenue |
|---|---|---|
| Automotive Parts | 3 | $48B |
|
||
| Automotive | 2 | $372B |
|
||
| Chemicals | 1 | $45B |
|
||
| Automotive Retail | 1 | $29B |
|
||
| Healthcare / Medical Devices | 1 | $23B |
|
||
| Automotive Technology | 1 | $20B |
|
||
Price history
1 event — show timeline
- 2026-06-12 Listed $16,000 MiRealSource-MiMLS
Cash-flow waterfall
monthlySold comps — $/sqft
last 12 mo · ≤1 miLoading sold comps…