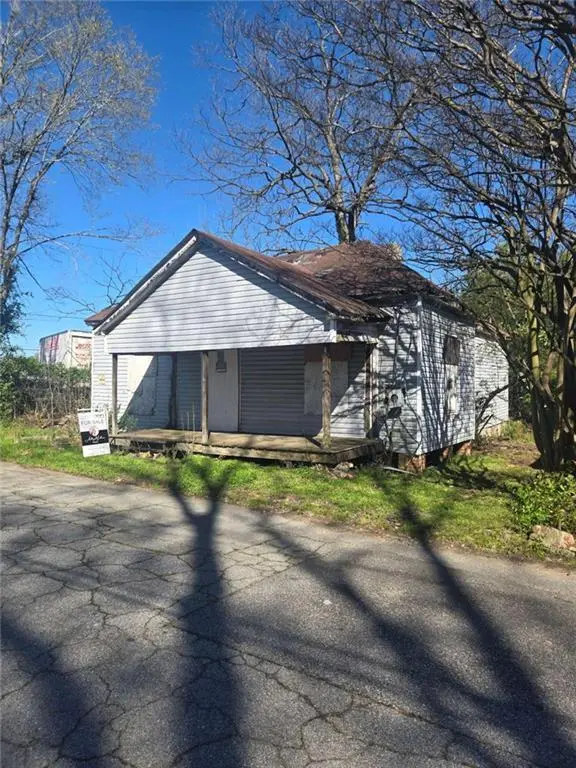
3200 Magnolia St · East Point, GA
Flood risk 1/10 · Minimal
- FEMA flood zone
- X (unshaded)
- Chance of flooding over 30 yrs
- 0.0%
- Est. flood insurance / yr
- $507 – $1,088
Fire risk 1/10 · Minimal
- Est. fire insurance / yr
- $963 – $1,789
Heat risk 6/10 · Moderate
- Hot days now (above 103°F)
- 7 days/yr
- Hot days in 30 yrs
- 18 days/yr
Wind risk 6/10 · Moderate
- Chance of severe wind over 30 yrs
- 27.0%
Air-quality risk 4/10 · Minor
- Unhealthy air days now
- 4 days/yr
- Unhealthy air days in 30 yrs
- 6 days/yr
Risk factors via First Street. Map © Google.
Why this score? — see what drove the B grade
The composite is a weighted blend of 9 inputs, each scored 0–100. Each bar is that input's sub-score; the figure is the points it added to the 100-point composite (weight × sub-score).
- Cash flow +30.0/30.0
- 1% rule +10.0/10.0
- DSCR +10.0/10.0
- ARV discount +7.5/15.0
- Schools +4.5/10.0
- Livability +3.6/5.0
- Rent growth +2.8/5.0
- Condition / age +2.5/5.0
- Appreciation +0.0/10.0
$70,000
🖨 Deal sheet 📄 Offer letter ✓ Due diligence
Listing remarks MLS
Great investment opportunity for a tear down or full remodel! Motivated seller, bring any and all reasonable offers. The house is in a prime spot, being walkable to Woodward Academy, John D Milner Sports Complex, and very convenient to downtown college park.
Key facts
- Full remodel
- 7,440 sq ft lot
- Built 1920
Tags
Property features AI
Exterior
- Parking: Other parking features
- Utilities: Other water source; Other electric service; Other sewer; Other utilities
- Home design: One-level home; Resale property; Slab foundation
- Construction: Constructed with other materials; Other roof type
- Exterior features: Other exterior features; Other outbuildings/structures
Interior
- Kitchen: Other kitchen features; Other listed appliances
- Bedrooms: Two main-level bedrooms; Primary bedroom on the main level
- Flooring: Other flooring
- Bathrooms: One full bathroom; Primary bathroom has a tub/shower combo
- Heating & cooling: Other heating; Other cooling
- Interior features: One fireplace located in the family room; No shared/common walls; Other interior features
- Laundry & utility: Other laundry features
Neighborhood map
What this means for you Summary
Snapshot
- This is a 2-bed/1.0-bath single-family listed at $70k.
Deal economics
- At list price, monthly cash flow is $661 ($8k/yr) — positive.
- The deal already cash-flows at list — no discount required.
- Meets the 1% rule at list price ($1k rent vs $70k).
- Cap rate 17.6% vs local median 5.1% in East Point — top-decile yield for the area; either an underpriced asset or a hidden risk that comps aren't pricing in. Stress-test before assuming the spread holds.
Location & tenants
- Location reads 72/100 on livability (#72 in GA) — a middle-class / working-renter tenant base. Strengths: commute A+, cost of living A+, housing A+; Watch: employment D+, crime F, amenities F.
- Fulton County (suburban): math 49% / reading 53% proficiency, ranked #12 of 174 in GA (top 7%) — acceptable for families but not a draw, mixed tenant base, ~2y average lease.
- Zoned schools: Parklane Elementary School (math 24% / reading 24%, grade F, #753 of 1,228 statewide, top 64%, 320 students, 100% FRL); Paul D. West Middle School (math 17% / reading 17%, grade F, #381 of 470 statewide, top 82%, 803 students, 100% FRL); Tri-Cities High School (math 5% / reading 30%, grade F, #264 of 424 statewide, top 63%, 1,483 students, 100% FRL) — zoned schools average 100% FRL vs 41% district-wide (59 pts higher); higher-poverty schools than district average — tighter screening recommended.
- Zoned-school proficiency averages 20% at this address vs 51% district-wide (-31 pts) — the specific schools serving this property underperform the Fulton County average; the district grade overstates school quality for this exact location.
- Market conditions: Rents rising (+1.4%/yr); 283 active listings in the ZIP; 40 comparable units currently listed for rent nearby; rentals at typical pace (median 24d on market — plan ~3-4 weeks tenant-placement turnaround); 42% of comp listings sitting > 30 days — soft ceiling on asking rent; 11,565 units permitted in Fulton County in 2024 (8,159 in 5+ unit buildings).
Forward outlook
- Local home prices are declining (-3.0%/yr); year-one equity from $484 of loan paydown is wiped out by about $2k of value loss. Plan a longer hold.
- Fulton County population projected at +38% by 2050 — long-run rental-demand tailwind backs the buy-and-hold thesis.
- At projected returns (-3.0% appreciation + 1.4% rent growth), your $20k cash investment doubles in ~3 years — after that, you're playing with house money.
Negotiation context
- Only 3 days on market — expect competitive offers; lowballing is unlikely to land.
- 14 sale attempts since 4y ago with the ask held roughly flat each time — persistent listings suggest the price (not the market) is what's stuck; bring a comps-based counter.
- Current owner paid $45k; list at $70k implies a 56% gain — meaningful room to come down on a strong offer.
Risks & watch-outs
- Watch-outs: built in 1920 — expect roof / HVAC / electrical / plumbing capex.
- Climate carrying-cost: major wind risk, 27% chance of damaging wind over 30y; extreme-heat days projected 7→18/yr by 2055 (HVAC capex compounding) — expect insurance premiums to compound above CPI over the hold.
Questions for the listing agent
- Built in 1920 — when were the roof, HVAC, electrical panel, plumbing, and water heater last replaced?
- Is there a deadline driving the sale (1031 exchange, divorce, estate, relocation)? That informs how much negotiation room exists.
- Schools are F-rated, which usually means shorter tenancies and higher turnover. Who's the typical renter profile here, and what's been the actual vacancy rate?
- Crime grade is F in this area — have there been break-ins, vandalism, or insurance claims at this property in the last 3 years? What carrier currently insures it and at what premium?
- What's the average days-on-market for RENTAL listings here right now (not sales)? A rising rental-DOM trend means longer vacancies and softer asking-rent achievability than the comps imply.
- What's the recent tenant-quality profile in this submarket — average credit score on applications, eviction rate, late-payment / NSF rate, and stable-employment percentage? A property-management company in the area should have these aggregated.
- How much new for-sale + rental construction is in the pipeline within 1–3 miles? Heavy new supply typically softens prices + rents 12–24 months out; constrained supply supports both.
Investment metrics
- 1% rule
- 2.00% ✓
- Cap rate
- 17.62%
- Cash-on-cash
- 40.45%
- DSCR
- 2.80
- GRM
- 4.2
CMA / ARV
- ARV (median comp)
- $292,425
- List price
- $70,000
- Delta
- -60.67%
- Verdict
- UNDERPRICED
- Comps
- 10 within 1.0 mi
Show comp detail 2 sales within ~0.75 mi
| Address | Dist | Beds/Ba | Sqft | Sold | Price | $/sf | Match |
|---|---|---|---|---|---|---|---|
| 3122 Semmes St | 0.70mi | 3/1.0 (+1) | 1,002 (+6%) | 17mo | $155,000 | $155 | 38 |
| 1244 Calhoun Ave | 0.46mi | 3/1.5 (+1) | 1,072 (+14%) | 24mo | $230,000 | $215 | 29 |
Match score weights: distance 35% · size 25% · config 20% · recency 20%. Top-matched comps best support the ARV.
Projected returns pro-forma
-3.0% appreciation · 1.35% rent growth · sell at horizon
- IRR
- 35.1%
- Equity multiple
- 2.45×
- Total profit
- $28,448
- Equity at exit
- $10,437
- IRR
- 41.0%
- Equity multiple
- 4.56×
- Total profit
- $69,872
- Equity at exit
- $6,052
Cash invested: $19,600 (down + closing). Projections, not guarantees.
Landlord ↔ Tenant lean methodology
- Overall (STATE)
- 90 Strongly Landlord-Friendly
- State Georgia
- 90 Strongly Landlord-Friendly · R+3
- County
- — inherits STATE
- City
- — inherits STATE
ZIP-level market 30344
- Home prices YoY
- -31.0%
- Rents YoY
- 1.4%
- Active inventory
- 283
- Price-to-rent
- 4.2×
Monthly cashflow live
- Estimated rent
- $1,399 high interval (Pro) →
- Mortgage (P&I)
- −$367
- Tax from tax record
- −$48 /mo · $580/yr
- Insurance
- −$29
- HOA
- −$0
- Vacancy / Maint / Mgmt
- −$294
- Net cashflow
- $661
Break-even live
UW: 25.0% down · 7.5% · 30yr · 1.5% tax · 5.0% vac · 8.0% maint · 8.0% mgmt
Financing live
Cash to close
- Down payment
- $17,500
- Closing costs
- $2,100
- Reserves months
- —
- Total cash needed
- —
Loan-product check · same deal, 3 products live
Conventional
25% down · 7.5% · 30yr
- Down + closing
- —
- Monthly P&I
- —
- Monthly cashflow
- —
- DSCR
- —
- Eligible?
- —
Personal DTI + credit; lowest rate.
DSCR
20% down · 8.5% · 30yr
- Down + closing
- —
- Monthly P&I
- —
- Monthly cashflow
- —
- DSCR
- —
- Eligible?
- —
No personal income docs; deal must DSCR.
Hard money
10% down · 12.0% · 12mo
- Down + closing
- —
- Monthly P&I
- —
- Monthly cashflow
- —
- DSCR
- —
- Eligible?
- —
Short-term bridge; refi at stabilization.
Rent comps 40 comps
| Address | Beds | Baths | Sqft | Rent | $/sqft | DOM | Units | Dist |
|---|---|---|---|---|---|---|---|---|
| 1332 Eubanks Ave Atlanta, GA | 2.0 | 1.0 | 714 | $1,025 | $1.44 | 43d | 1 | 0.32mi |
| 3041 North St Unit B East Point, GA | 2.0 | 1.0 | 650 | $895 | $1.38 | 43d | 1 | 0.38mi |
| 1329 Walker Ave Unit Walker B Atlanta, GA | 1.0 | 1.0 | 650 | $1,600 | $2.46 | 2d | 1 | 0.42mi |
| 1329 Walker Ave Unit Walker A Atlanta, GA | 1.0 | 1.0 | 650 | $2,000 | $3.08 | 2d | 1 | 0.42mi |
| 1244 Calhoun Ave Atlanta, GA | 3.0 | 1.5 | 1072 | $1,673 | $1.56 | 43d | 1 | 0.47mi |
| 3100 E Point St Atlanta, GA | 2.0 | 1.0 | 850 | $1,224 | $1.44 | 5d | 3 | 0.50mi |
| 1408 Lyle Ave Unit A Atlanta, GA | 2.0 | 1.0 | 842 | $1,350 | $1.60 | 24d | 1 | 0.53mi |
| 3193 E Point St Unit 4 Atlanta, GA | 2.0 | 1.0 | 800 | $1,350 | $1.69 | 10d | 1 | 0.59mi |
| 3193 E Point St Unit 4 Atlanta, GA | 2.0 | 1.0 | 800 | $1,350 | $1.69 | 20d | 1 | 0.59mi |
| 3203 E Point St Apt 4 Atlanta, GA | 2.0 | 1.0 | 800 | $1,350 | $1.69 | 24d | 1 | 0.60mi |
| 3203 E Point St Apt 4 Atlanta, GA | 2.0 | 1.0 | 800 | $1,350 | $1.69 | 10d | 1 | 0.60mi |
| 1100 Washington Cir Atlanta, GA | 1.0–4.0 | 1.0–1.5 | 1000 | $1,333 | $1.33 | 2d | 1 | 0.63mi |
| 1377 Pine Ave Atlanta, GA | 3.0 | 2.0 | 1100 | $1,675 | $1.52 | 21d | 1 | 0.68mi |
| 2997 Park St Unit 2 Atlanta, GA | 2.0 | 1.5 | 860 | $1,549 | $1.80 | 5d | 1 | 0.71mi |
| 2997 Park St Unit 3 Atlanta, GA | 2.0 | 1.5 | 860 | $1,499 | $1.74 | 43d | 1 | 0.71mi |
| 1804 Lyle Ave Unit 4 College Park, GA | 2.0 | 1.5 | 900 | $1,350 | $1.50 | 43d | 1 | 0.73mi |
| 3045 Semmes St Atlanta, GA | 2.0 | 1.5 | 1000 | $1,400 | $1.40 | 43d | 3 | 0.73mi |
| 1818 Vesta Ave Atlanta, GA | 1.0–2.0 | 1.0 | 811 | $1,450 | $1.79 | 43d | 5 | 0.75mi |
| 1836 Dunlap Ave Apt 90 Atlanta, GA | 2.0 | 1.5 | 1030 | $1,150 | $1.12 | 24d | 1 | 0.75mi |
| 1255 Pine Ave Unit 2 East Point, GA | 2.0 | 1.0 | 700 | $1,400 | $2.00 | 43d | 1 | 0.76mi |
| 1744 Cambridge Ave #2 Atlanta, GA | 2.0 | 1.5 | 1100 | $1,599 | $1.45 | 43d | 1 | 0.78mi |
| 1744 Cambridge Ave College Park, GA | 2.0 | 1.5 | 1100 | $1,600 | $1.45 | 5d | 2 | 0.78mi |
| 2874 Cheney St Atlanta, GA | 2.0 | 1.0 | 900 | $1,300 | $1.44 | 43d | 1 | 0.79mi |
| 3567 Adams St Unit A College Park, GA | 2.0 | 1.0 | 850 | $1,300 | $1.53 | 43d | 1 | 0.87mi |
| 3300 College St Unit 5 College Park, GA | 2.0 | 1.0 | 760 | $975 | $1.28 | 2d | 1 | 0.88mi |
| 3633 Howard Dr Atlanta, GA | 2.0 | 1.0–2.0 | 906 | $1,250 | $1.38 | 43d | 1 | 0.89mi |
| 2982 Pearl St Unit LEFT SIDE East Point, GA | 2.0 | 1.0 | 676 | $1,125 | $1.66 | 43d | 1 | 0.89mi |
| 1910 Center Ave Atlanta, GA | 2.0 | 1.0 | 800 | $1,300 | $1.62 | 43d | 1 | 0.89mi |
| 1907 Lyle Ave Atlanta, GA | 2.0 | 1.0 | 736 | $1,300 | $1.77 | 43d | 1 | 0.91mi |
| 3586 Jackson St Atlanta, GA | 2.0 | 2.0 | 1015 | $1,399 | $1.38 | 3d | 1 | 0.91mi |
| 2977 Pearl St Unit 2 Atlanta, GA | 2.0 | 1.0 | 800 | $1,390 | $1.74 | 1d | 1 | 0.92mi |
| 1940 Dunlap Ave Atlanta, GA | 1.0 | 1.0 | 950 | $750 | $0.79 | 43d | 1 | 0.95mi |
| 1761 John Calvin Ave Unit 1 Atlanta, GA | 2.0 | 1.0 | 950 | $1,300 | $1.37 | 21d | 1 | 0.96mi |
| 1915 Walker Ave College Park, GA | 1.0 | 1.0 | 900 | $1,450 | $1.61 | 43d | 1 | 0.97mi |
| 3548 E Main St Unit 6 College Park, GA | 1.0 | 1.0 | 709 | $1,300 | $1.83 | 5d | 1 | 0.97mi |
| 3548 E Main St Unit 6 College Park, GA | 1.0 | 1.0 | 709 | $1,300 | $1.83 | 3d | 1 | 0.97mi |
| 2956 8th St Atlanta, GA | 1.0 | 1.0 | 1000 | $750 | $0.75 | 15d | 1 | 0.99mi |
| 2952 Palm Dr Atlanta, GA | 3.0 | 2.0 | 1120 | $1,875 | $1.67 | 5d | 1 | 1.01mi |
| 1354 Winburn Dr Atlanta, GA | 3.0 | 1.0 | 1000 | $1,850 | $1.85 | 5d | 1 | 1.02mi |
| 1354 Winburn Dr Atlanta, GA | 2.0 | 1.0 | 1089 | $1,750 | $1.61 | 24d | 1 | 1.02mi |
Listing history 34 events
-
2026-06-18days on market $70,000 Active 3 DOM
-
2026-06-17days on market $70,000 Active 2 DOM
-
2026-06-15remarks 258-char remark
Show marketing remark (258 chars)
Great investment opportunity for a tear down or full remodel! Motivated seller, bring any and all reasonable offers. The house is in a prime spot, being walkable to Woodward Academy, John D Milner Sports Complex, and very convenient to downtown College Park.
-
2026-06-15pricedays on market $70,000 Active 1 DOM
Show marketing remark (258 chars)
Great investment opportunity for a tear down or full remodel! Motivated seller, bring any and all reasonable offers. The house is in a prime spot, being walkable to Woodward Academy, John D Milner Sports Complex, and very convenient to downtown College Park.
-
2026-05-19historical
-
2026-05-12status Active 142-char remark
-
2026-05-12status Back On Market
-
2026-05-05status Under Contract
-
2026-05-05status Pending 142-char remark
-
2026-03-30$115,000 New
-
2026-03-30$115,000 Active 142-char remark
-
2025-09-25soldstatus $45,000 Sold
-
2025-09-25soldstatus $45,000
-
2025-09-10status Under Contract
-
2025-07-23price $54,900
-
2024-12-31historical
-
2024-12-31historical
-
2024-12-24status Back On Market
-
2024-12-18status Under Contract
-
2024-12-04price $60,000
-
2024-12-04price $60,000
-
2024-10-02$60,000 New
-
2024-10-02$70,000 New
-
2024-10-02$70,000 Active
-
2024-08-14historical
-
2024-08-14historical
-
2024-06-14$85,000 Active
-
2024-06-14$85,000 New
-
2023-03-17historical
-
2022-04-29price $79,999
-
2022-04-22$95,000 Back On Market
-
2022-04-21historical
-
2022-04-19status Under Contract
-
2022-03-23$95,000 New
ⓘ Source: listings_history table (triggers on properties + properties_extension) + one-shot
backfill from property_details.listing_events for pre-trigger history.
Tax reassessment forecast GA · Resets to sale price
- Current annual tax
- $580 · $48/mo
- Projected year-2 tax
- $644 · $54/mo
- Expected delta
- +$64/yr (+$5/mo · 11.0%)
ⓘ Screening estimate from a state-policy table — verify with the county assessor before closing.
Climate risk First Street
- Flood 1/10 Low FEMA zone X (unshaded) · 0% chance over 30 yrs
- Wildfire 1/10 Low
- Heat 6/10 Major 7 d/yr ≥103°F today · 18 d/yr by 30 yrs out
- Wind 6/10 Major 27% chance of damaging wind over 30 yrs
- Air quality 4/10 Moderate 4 unhealthy d/yr today · 6 by 30 yrs out
Nearby sold comps map
Loading sold comps map…
Walkable amenities ~0.75 mi
Loading nearby amenities…
Taxation est. · year 1
- Rental income
- $16,789
- − Mortgage interest
- −$3,921
- − Property taxes
- −$580
- − Insurance
- −$350
- − Repairs & maintenance
- −$1,343
- − Management
- −$1,343
- − Depreciation
- −$2,036
- Taxable income
- $7,215
- Est. tax owed @ 24.0%
- −$1,732
- After-tax cash flow
- $6,197/yr
For passive investors: Depreciation is non-cash, so a rental often shows a tax loss while cash-flowing — sheltering income. Rental losses are passive: they offset passive income freely, and up to $25,000/yr can offset ordinary (W-2) income if you actively participate and your MAGI is under $100k (phasing out to $0 by $150k); unused losses carry forward. On sale, claimed depreciation is recaptured at up to 25%, and gains may owe capital-gains tax (a 1031 exchange can defer both). Figures are a year-1 estimate at your 24.0% rate — not tax advice; consult a CPA.
Schools (NCES district)
- District
- Fulton County
- NCES district ID
- 1302280
- Math proficiency
- 49% ▼ -2.00%
- Reading proficiency
- 53% ▬ 0.00%
- Median HH income
- $68,035
- Composite
- 45.33/100
- National rank
- #2640
- State rank
- #12 of 174 in GA
Livability — East Point
- Score
- 72/100
- State rank
- #72
- US rank
- #6314
Category grades
Schools grade is shown separately in the Schools card above.
Census & demographics
- Census place
- East Point, GA
- County
- Fulton County · 1,094,430 people
- City population
- 35,456
- Metro
- Atlanta-Sandy Springs-Alpharetta, GA
- Population (ZIP)
- 35,456
- Household income
- $68,380
- Rent vs Own
- Severe rent burden
- 2226.0
Population outlook (Fulton County) Hauer SSP2
- Today (2025)
- 1,203,707 people
- By 2030
- 1,299,706 · +8.0%
- By 2040
- 1,488,256 · +23.6%
- By 2050
- 1,664,580 · +38.3%
- By 2075
- 2,036,072 · +69.2%
- By 2100
- 2,222,402 · +84.6%
Race, ethnicity, and origin ACS 2023
- Neighborhood character
- Predominantly Black (74%)
- Race & ethnicity
- Black 74% White 11% Hispanic / Latino 11% Two or more races 6%
- Hispanic origin (detail)
- Mexican 7% Puerto Rican 1%
- Common ancestry
- Italian 1% Swiss 1% Russian 1%
- Foreign-born
- 6% · Canada, Jamaica
- Languages at home
- 87% English-only · Spanish 9% Other Indo-European 1% German/W. Germanic 1%
Political lean MEDSL · Fulton
- 2024 margin
- Solid D (+44.9) · D 71.9% · R 27.0% · Other 1.1%
- 2008→2024 swing
- +9.8pp toward D · 2008: 35.0pp · 2024: 44.9pp
- All cycles
- 2024: D+44.9 2020: D+46.4 2016: D+42.1 2012: D+29.6 2008: D+35.0
Not yet ingested
- Civics
- —
Market trends
- HPI YoY
- ▼ -113.15%
- Current HPI
- 251.7916
- Rent YoY
- ▲ 1.35%
- Metro
- Atlanta-Sandy Springs-Alpharetta, GA
- State GDP YoY
- ▲ 2.66%
- F500 in state
- 28
Industry mix (Fortune 500 HQ in GA)
| Industry | F500 HQs | Revenue |
|---|---|---|
| Paper / Packaging | 2 | $29B |
|
||
| Retail | 1 | $160B |
|
||
| Transportation / Logistics | 1 | $91B |
|
||
| Airlines | 1 | $62B |
|
||
| Consumer Goods | 1 | $47B |
|
||
| Utilities | 1 | $25B |
|
||
Price history
-26.3% since first listed31 events — show timeline
- 2026-06-15 Listed $70,000 FMLS
- 2026-06-15 Listed $70,000 GAMLS
- 2026-06-15 Listed $70,000 GAMLS
- 2026-06-15 Listed $70,000 FMLS
- 2026-05-19 Listing Removed — GAMLS
- 2026-05-12 Relisted — GAMLS
- 2026-05-05 Pending — GAMLS
- 2026-03-30 Listed $115,000 GAMLS
- 2025-09-25 Sold (Public Records) $45,000 Public Records
- 2025-09-25 Sold (MLS) $45,000 GAMLS
- 2025-09-10 Pending — GAMLS
- 2025-07-23 Price Changed $54,900 GAMLS
- 2024-12-31 Listing Removed — GAMLS
- 2024-12-31 Listing Removed — FMLS
- 2024-12-24 Relisted — GAMLS
- 2024-12-18 Pending — GAMLS
- 2024-12-04 Price Changed $60,000 GAMLS
- 2024-12-04 Price Changed $60,000 FMLS
- 2024-10-02 Listed $70,000 GAMLS
- 2024-10-02 Listed $70,000 FMLS
- 2024-10-02 Listed $60,000 GAMLS
- 2024-08-14 Listing Removed — GAMLS
- 2024-08-14 Listing Removed — FMLS
- 2024-06-14 Listed $85,000 GAMLS
- 2024-06-14 Listed $85,000 FMLS
- 2023-03-17 Listing Removed — GAMLS
- 2022-04-29 Price Changed $79,999 GAMLS
- 2022-04-22 Listed $95,000 GAMLS
- 2022-04-21 Listing Removed — GAMLS
- 2022-04-19 Pending — GAMLS
- 2022-03-23 Listed $95,000 GAMLS
Property tax history
-6.2%/yrLatest (2021): $580 · -6.2% YoY. Source: county tax records.
Cash-flow waterfall
monthlySold comps — $/sqft
last 12 mo · ≤1 miLoading sold comps…