 🌊 Lakefront
118 Autumn Ln · Falcon Mesa, TX
Flood risk 1/10 · Minimal
- FEMA flood zone
- X (unshaded)
- Chance of flooding over 30 yrs
- 0.0%
- Est. flood insurance / yr
- $507 – $1,088
Fire risk 6/10 · Moderate
- Est. fire insurance / yr
- $1,222 – $2,270
Heat risk 9/10 · Severe
- Hot days now (above 112°F)
- 7 days/yr
- Hot days in 30 yrs
- 21 days/yr
Wind risk 6/10 · Moderate
- Chance of severe wind over 30 yrs
- 56.0%
Air-quality risk 1/10 · Minimal
- Unhealthy air days now
- 0 days/yr
- Unhealthy air days in 30 yrs
- 0 days/yr
Risk factors via First Street. Map © Google.
Why this score? — see what drove the B grade
The composite is a weighted blend of 9 inputs, each scored 0–100. Each bar is that input's sub-score; the figure is the points it added to the 100-point composite (weight × sub-score).
- Cash flow +30.0/30.0
- 1% rule +10.0/10.0
- DSCR +10.0/10.0
- ARV discount +7.5/15.0
- Appreciation +6.3/10.0
- Rent growth +2.5/5.0
- Condition / age +2.5/5.0
- Schools +1.8/10.0
- Livability +1.8/5.0
$60,000
🖨 Deal sheet 📄 Offer letter ✓ Due diligence
Listing remarks
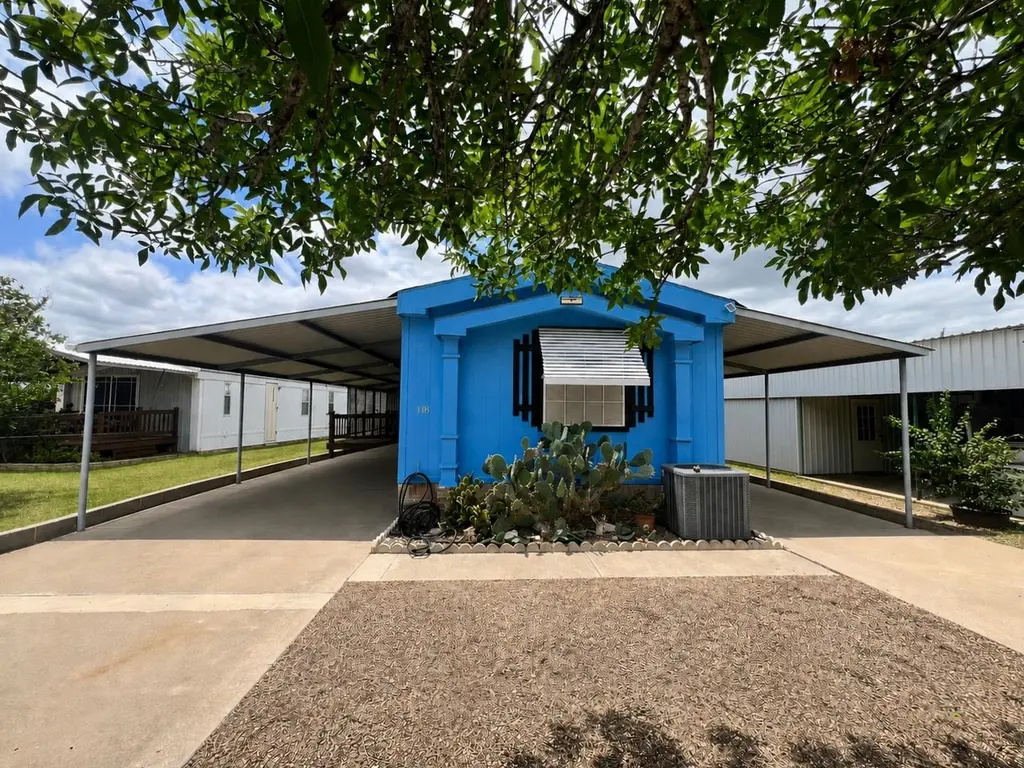
Well-kept 2BR/2BA manufactured home located in a gated 55+ retirement community. This home offers inviting curb appeal and a comfortable layout ideal for full-time living or a seasonal retreat. Enjoy outdoor living with two decks, one in the front and one in the back, along with a covered porch and covered carport for added convenience. Detached workshop provides extra space for hobbies, tools, or storage. This property is a great opportunity to enjoy low-maintenance living in a peaceful setting.
Key facts
- Covered porch
- Covered carport
- Detached workshop
Tags
Property features AI
Finance
- HOA & community: Gated community
Exterior
- Parking: Concrete parking
- Security: Gated community
- Utilities: Public water; Underground utilities
- Home design: Single-story; Mobile home; Residential property
- Construction: Frame construction
- Exterior features: Deck; Level lot; Workshop
Interior
- Kitchen: Range; Refrigerator
- Flooring: Carpet; Vinyl; Wood
- Bathrooms: 2 full bathrooms
- Heating & cooling: Central heating; Electric heating; Central air conditioning; Ceiling fans
- Interior features: Range; Refrigerator; Electric water heater
- Laundry & utility: Electric water heater
Neighborhood map
What this means for you Summary
Snapshot
- This is a 2-bed/2.0-bath manufactured listed at $60k.
Deal economics
- At list price, monthly cash flow is $396 ($5k/yr) — positive.
- The deal already cash-flows at list — no discount required.
- Meets the 1% rule at list price ($1k rent vs $60k).
- Recommended offer: $59k (1.5% below list) — sets the bar for market timing.
Location & tenants
- Location reads 36/100 on livability (#1,652 in TX) — a limited-amenity area; tenant pool skews transient or value-seeking. Strengths: cost of living A+, crime A; Watch: schools F, amenities F, commute F.
- Zapata County ISD (town): math 21% / reading 24% proficiency, ranked #767 of 826 in TX (top 93%) — low school quality limits family demand, transient renter base, plan for 1-2y turnover; 70% free/reduced lunch — lower-income household profile, screen leases tightly.
- Market conditions: 92 active listings in the ZIP.
Forward outlook
- In year one you build about $2k of equity ($415 loan paydown + $2k appreciation (2.6% local appreciation)).
- Zapata County population projected to shrink 3% by 2050 — rents likely to lag national; underwrite the cash flow, not the appreciation.
- At projected returns (2.6% appreciation + 3.0% rent growth), your $17k cash investment doubles in ~3 years — after that, you're playing with house money.
Negotiation context
- It's been on market 28 days — a 2% lower offer ($59k) is reasonable based on typical stale-listing flexibility.
Risks & watch-outs
- Climate carrying-cost: major wind risk, 56% chance of damaging wind over 30y; major wildfire risk; extreme-heat days projected 7→21/yr by 2055 (HVAC capex compounding) — expect insurance premiums to compound above CPI over the hold.
Questions for the listing agent
- Is there a deadline driving the sale (1031 exchange, divorce, estate, relocation)? That informs how much negotiation room exists.
- Schools are F-rated, which usually means shorter tenancies and higher turnover. Who's the typical renter profile here, and what's been the actual vacancy rate?
- This sits on a lake — are riparian / water-frontage rights deeded with the parcel? Any dock permits, shoreline easements, or HOA water-use restrictions?
- What's the documented flood / surge / shoreline-erosion history here (FEMA AND non-FEMA — e.g., storm surge, creek backup, septic-field saturation)?
- Any water-quality or seasonal algae-bloom issues that affect tenant satisfaction or short-term-rental demand?
- What's the average days-on-market for RENTAL listings here right now (not sales)? A rising rental-DOM trend means longer vacancies and softer asking-rent achievability than the comps imply.
- What's the recent tenant-quality profile in this submarket — average credit score on applications, eviction rate, late-payment / NSF rate, and stable-employment percentage? A property-management company in the area should have these aggregated.
- How much new for-sale + rental construction is in the pipeline within 1–3 miles? Heavy new supply typically softens prices + rents 12–24 months out; constrained supply supports both.
Investment metrics
- 1% rule
- 1.71% ✓
- Cap rate
- 14.22%
- Cash-on-cash
- 28.31%
- DSCR
- 2.26
- GRM
- 4.9
CMA / ARV
No comps found within radius.
Projected returns pro-forma
2.61% appreciation · 3.0% rent growth · sell at horizon
- IRR
- 33.6%
- Equity multiple
- 2.86×
- Total profit
- $31,253
- Equity at exit
- $25,665
- IRR
- 34.2%
- Equity multiple
- 5.61×
- Total profit
- $77,470
- Equity at exit
- $38,561
Cash invested: $16,800 (down + closing). Projections, not guarantees.
Landlord ↔ Tenant lean methodology
- Overall (STATE)
- 87 Strongly Landlord-Friendly
- State Texas
- 87 Strongly Landlord-Friendly · R+5
- County
- — inherits STATE
- City
- — inherits STATE
ZIP-level market 78076
- Home prices YoY
- 2.3%
- Active inventory
- 92
- Price-to-rent
- 4.9×
Monthly cashflow live
- Estimated rent
- $1,027 medium interval (Pro) →
- Mortgage (P&I)
- −$315
- Tax from tax record
- −$75 /mo · $904/yr
- Insurance
- −$25
- HOA
- −$0
- Vacancy / Maint / Mgmt
- −$216
- Net cashflow
- $396
Break-even live
UW: 25.0% down · 7.5% · 30yr · 1.5% tax · 5.0% vac · 8.0% maint · 8.0% mgmt
Financing live
Cash to close
- Down payment
- $15,000
- Closing costs
- $1,800
- Reserves months
- —
- Total cash needed
- —
Loan-product check · same deal, 3 products live
Conventional
25% down · 7.5% · 30yr
- Down + closing
- —
- Monthly P&I
- —
- Monthly cashflow
- —
- DSCR
- —
- Eligible?
- —
Personal DTI + credit; lowest rate.
DSCR
20% down · 8.5% · 30yr
- Down + closing
- —
- Monthly P&I
- —
- Monthly cashflow
- —
- DSCR
- —
- Eligible?
- —
No personal income docs; deal must DSCR.
Hard money
10% down · 12.0% · 12mo
- Down + closing
- —
- Monthly P&I
- —
- Monthly cashflow
- —
- DSCR
- —
- Eligible?
- —
Short-term bridge; refi at stabilization.
Listing history 17 events
-
2026-06-18days on market $60,000 Active 28 DOM
-
2026-06-17days on market $60,000 Active 27 DOM
-
2026-06-16days on market $60,000 Active 26 DOM
-
2026-06-15days on market $60,000 Active 25 DOM
-
2026-06-15days on market $60,000 Active 24 DOM
-
2026-06-13days on market $60,000 Active 23 DOM
-
2026-06-12days on market $60,000 Active 22 DOM
-
2026-06-09days on market $60,000 Active 19 DOM
-
2026-06-08days on market $60,000 Active 18 DOM
-
2026-06-08days on market $60,000 Active 17 DOM
-
2026-06-07days on market $60,000 Active 16 DOM
-
2026-06-03days on market $60,000 Active 13 DOM
-
2026-06-02days on market $60,000 Active 12 DOM
-
2026-06-01days on market $60,000 Active 11 DOM
-
2026-05-31days on market $60,000 Active 10 DOM
-
2026-05-19$60,000 Active
-
2014-03-07soldstatus
ⓘ Source: listings_history table (triggers on properties + properties_extension) + one-shot
backfill from property_details.listing_events for pre-trigger history.
Tax reassessment forecast TX · Resets to sale price
- Current annual tax
- $904 · $75/mo
- Projected year-2 tax
- $1,098 · $92/mo
- Expected delta
- +$194/yr (+$16/mo · 21.5%)
ⓘ Screening estimate from a state-policy table — verify with the county assessor before closing.
Climate risk First Street
- Flood 1/10 Low FEMA zone X (unshaded) · 0% chance over 30 yrs
- Wildfire 6/10 Major
- Heat 9/10 Extreme 7 d/yr ≥112°F today · 21 d/yr by 30 yrs out
- Wind 6/10 Major 56% chance of damaging wind over 30 yrs
- Air quality 1/10 Low 0 unhealthy d/yr today · 0 by 30 yrs out
Nearby sold comps map
Loading sold comps map…
Walkable amenities ~0.75 mi
Loading nearby amenities…
Taxation est. · year 1
- Rental income
- $12,324
- − Mortgage interest
- −$3,361
- − Property taxes
- −$904
- − Insurance
- −$300
- − Repairs & maintenance
- −$986
- − Management
- −$986
- − Depreciation
- −$1,745
- Taxable income
- $4,042
- Est. tax owed @ 24.0%
- −$970
- After-tax cash flow
- $3,786/yr
For passive investors: Depreciation is non-cash, so a rental often shows a tax loss while cash-flowing — sheltering income. Rental losses are passive: they offset passive income freely, and up to $25,000/yr can offset ordinary (W-2) income if you actively participate and your MAGI is under $100k (phasing out to $0 by $150k); unused losses carry forward. On sale, claimed depreciation is recaptured at up to 25%, and gains may owe capital-gains tax (a 1031 exchange can defer both). Figures are a year-1 estimate at your 24.0% rate — not tax advice; consult a CPA.
Schools (NCES district)
- District
- Zapata County ISD
- NCES district ID
- 4846710
- Math proficiency
- 21% ▼ -23.00%
- Reading proficiency
- 24% ▼ -11.00%
- Median HH income
- $30,189
- Composite
- 18.09/100
- National rank
- #8974
- State rank
- #767 of 826 in TX
Livability — Falcon Mesa
- Score
- 36/100
- State rank
- #1652
- US rank
- #27633
Category grades
Schools grade is shown separately in the Schools card above.
Census & demographics
- Census place
- Falcon Mesa, TX
- Population (ZIP)
- 13,085
Population outlook (Zapata County) Hauer SSP2
- Today (2025)
- 14,795 people
- By 2030
- 14,837 · +0.3%
- By 2040
- 14,759 · -0.2%
- By 2050
- 14,316 · -3.2%
- By 2075
- 11,647 · -21.3%
- By 2100
- 7,265 · -50.9%
Race, ethnicity, and origin ACS 2023
- Neighborhood character
- Predominantly Hispanic (94%)
- Race & ethnicity
- Hispanic / Latino 94% Two or more races 52% White 5%
- Hispanic origin (detail)
- Mexican 89%
- Foreign-born
- 23% · Canada, Vietnam
- Languages at home
- 16% English-only · Spanish 84% Vietnamese 1%
Political lean MEDSL · Zapata
- 2024 margin
- Strong R (+22.4) · D 38.5% · R 61.0%
- 2008→2024 swing
- -58.0pp toward R · 2008: 35.6pp · 2024: -22.4pp
- All cycles
- 2024: R+22.4 2020: R+5.3 2016: D+32.8 2012: D+43.2 2008: D+35.6
Not yet ingested
- Civics
- —
Market trends
- HPI YoY
- ▲ 2.61%
- Current HPI
- 117.0315
- Rent YoY
- —
- Metro
- —
- State GDP YoY
- ▲ 3.95%
- F500 in state
- 110
Industry mix (Fortune 500 HQ in TX)
| Industry | F500 HQs | Revenue |
|---|---|---|
| Energy | 16 | $1,198B |
|
||
| Technology | 5 | $198B |
|
||
| Engineering / Construction | 4 | $72B |
|
||
| Energy Services | 3 | $60B |
|
||
| Utilities | 3 | $41B |
|
||
| Healthcare | 2 | $330B |
|
||
Price history
2 events — show timeline
- 2026-05-19 Listed $60,000 LAOR
- 2014-03-07 Sold (Public Records) — Public Records
Property tax history
-0.0%/yrLatest (2025): $904 · -2.2% YoY. Source: county tax records.
Cash-flow waterfall
monthlySold comps — $/sqft
last 12 mo · ≤1 miLoading sold comps…