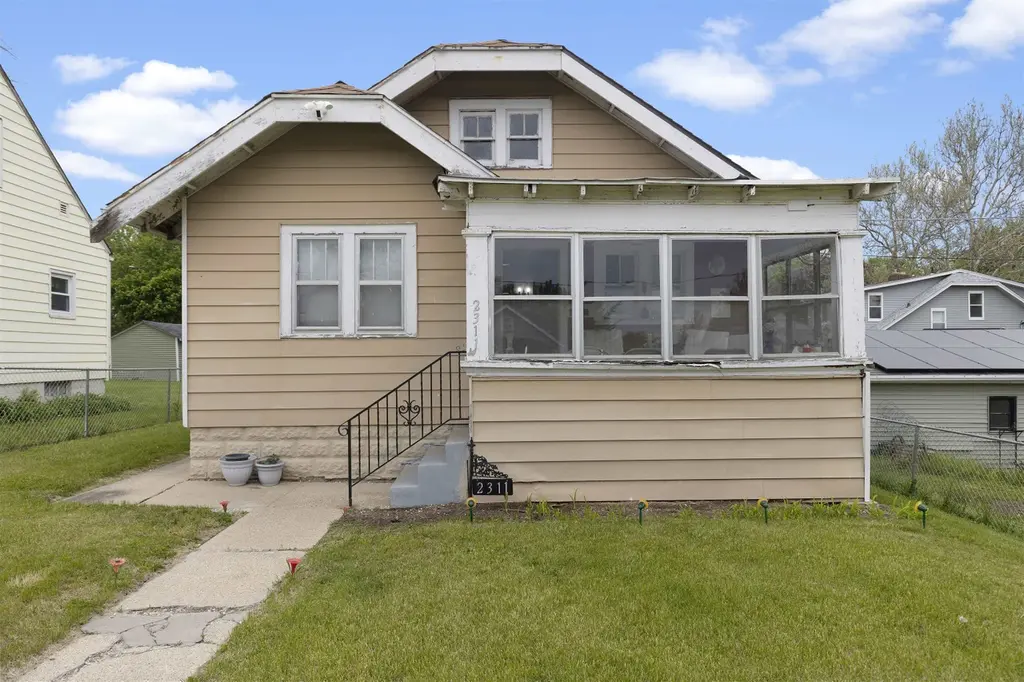
2311 Green St · Rockford, IL
Flood risk 1/10 · Minimal
- FEMA flood zone
- X (unshaded)
- Chance of flooding over 30 yrs
- 0.0%
- Est. flood insurance / yr
- $473 – $860
Fire risk 1/10 · Minimal
- Est. fire insurance / yr
- $804 – $1,492
Heat risk 2/10 · Minimal
- Hot days now (above 101°F)
- 7 days/yr
- Hot days in 30 yrs
- 15 days/yr
Wind risk 2/10 · Minimal
- Chance of severe wind over 30 yrs
- —
Air-quality risk 2/10 · Minimal
- Unhealthy air days now
- 1 days/yr
- Unhealthy air days in 30 yrs
- 2 days/yr
Risk factors via First Street. Map © Google.
Why this score? — see what drove the B grade
The composite is a weighted blend of 9 inputs, each scored 0–100. Each bar is that input's sub-score; the figure is the points it added to the 100-point composite (weight × sub-score).
- Cash flow +30.0/30.0
- ARV discount +10.7/15.0
- 1% rule +10.0/10.0
- DSCR +10.0/10.0
- Livability +3.1/5.0
- Rent growth +2.5/5.0
- Condition / age +2.5/5.0
- Schools +1.2/10.0
- Appreciation +0.0/10.0
$82,000
🖨 Deal sheet 📄 Offer letter ✓ Due diligence
Listing remarks MLS
Charming one-owner 2 bedroom, 1 bath home featuring a beautifully remodeled bathroom, enclosed porch perfect for relaxing year-round, and a spacious yard with plenty of room to enjoy the outdoors. Major updates include a newer roof within the last 5 years, offering added peace of mind. The unfinished attic space offers great potential for additional living space, a home office, or extra storage. This well-maintained home is full of character and ready for its next owner!
Key facts
- Spacious yard
- Remodeled bathroom
- Newer roof
Tags
Property features AI
Finance
- Financial info: Annual taxes approximately $1,100
Exterior
- Parking: Concrete parking
- Utilities: Public water; Public sewer
- Home design: Residential single-family house; Lot about 0.1 acre
- Exterior features: Rubber roof
Interior
- Kitchen: Gas cooktop; Refrigerator
- Bathrooms: 1 full bathroom (main level)
- Heating & cooling: Natural gas heating
- Interior features: Gas cooktop; Refrigerator; Gas water heater; Full basement
Neighborhood map
What this means for you Summary
Snapshot
- This is a 2-bed/1.0-bath single-family listed at $82k.
Deal economics
- At list price, monthly cash flow is $631 ($8k/yr) — positive.
- The deal already cash-flows at list — no discount required.
- Meets the 1% rule at list price ($2k rent vs $82k).
- Recommended offer: $81k (1.5% below list) — sets the bar for market timing.
- Cap rate 15.5% vs local median 6.1% in Rockford — top-decile yield for the area; either an underpriced asset or a hidden risk that comps aren't pricing in. Stress-test before assuming the spread holds.
Location & tenants
- Location reads 62/100 on livability (#876 in IL) — a middle-class / working-renter tenant base. Strengths: cost of living A+, housing A+, health & safety A+; Watch: schools F, crime F, amenities F.
- Rockford SD 205 (urban): math 12% / reading 16% proficiency, ranked #533 of 620 in IL (top 86%) — low school quality limits family demand, transient renter base, plan for 1-2y turnover; 73% free/reduced lunch — lower-income household profile, screen leases tightly.
- Market conditions: 69 active listings in the ZIP; 10 comparable units currently listed for rent nearby; rentals lingering (median 44d on market — plan ~5-8 weeks vacancy on turnover, expect pricing pressure); 60% of comp listings sitting > 30 days — soft ceiling on asking rent; 285 units permitted in Winnebago County in 2024 (0 in 5+ unit buildings).
Forward outlook
- Local home prices are declining (-3.0%/yr); year-one equity from $567 of loan paydown is wiped out by about $2k of value loss. Plan a longer hold.
- Winnebago County population projected at -20% by 2050 — secular population decline; favor cash flow + early exit over multi-decade hold.
- At projected returns (-3.0% appreciation + 3.0% rent growth), your $23k cash investment doubles in ~4 years — after that, you're playing with house money.
Negotiation context
- It's been on market 16 days — a 2% lower offer ($81k) is reasonable based on typical stale-listing flexibility.
- 4 sale attempts; this cycle's ask has dropped $5k (6%) from the opening price — seller is motivated, your offer sets the floor, not the list.
Risks & watch-outs
- Watch-outs: built in 1930 — expect roof / HVAC / electrical / plumbing capex.
Questions for the listing agent
- Built in 1930 — when were the roof, HVAC, electrical panel, plumbing, and water heater last replaced?
- Is there a deadline driving the sale (1031 exchange, divorce, estate, relocation)? That informs how much negotiation room exists.
- Schools are F-rated, which usually means shorter tenancies and higher turnover. Who's the typical renter profile here, and what's been the actual vacancy rate?
- Crime grade is F in this area — have there been break-ins, vandalism, or insurance claims at this property in the last 3 years? What carrier currently insures it and at what premium?
- What's the average days-on-market for RENTAL listings here right now (not sales)? A rising rental-DOM trend means longer vacancies and softer asking-rent achievability than the comps imply.
- What's the recent tenant-quality profile in this submarket — average credit score on applications, eviction rate, late-payment / NSF rate, and stable-employment percentage? A property-management company in the area should have these aggregated.
- How much new for-sale + rental construction is in the pipeline within 1–3 miles? Heavy new supply typically softens prices + rents 12–24 months out; constrained supply supports both.
Investment metrics
- 1% rule
- 1.85% ✓
- Cap rate
- 15.52%
- Cash-on-cash
- 32.96%
- DSCR
- 2.47
- GRM
- 4.5
CMA / ARV
- ARV (median comp)
- $88,310
- List price
- $82,000
- Delta
- -7.15%
- Verdict
- FAIR
- Comps
- 20 within 1.0 mi
Show comp detail 12 sales within ~0.75 mi
| Address | Dist | Beds/Ba | Sqft | Sold | Price | $/sf | Match |
|---|---|---|---|---|---|---|---|
| 2118 Elm St | 0.18mi | 3/2.0 (+1) | 1,352 (-12%) | 2mo | $150,000 | $111 | 61 |
| 2916 School St | 0.60mi | 3/2.0 (+1) | 1,578 (+3%) | 4mo | $200,000 | $127 | 55 |
| 511 Royal Ave | 0.58mi | 3/2.0 (+1) | 1,562 (+2%) | 9mo | $111,000 | $71 | 53 |
| 410 Oakley Ave | 0.64mi | 3/1.0 (+1) | 1,440 (-6%) | 5mo | $105,000 | $73 | 51 |
| 1421 Elm St | 0.66mi | 3/2.0 (+1) | 1,520 (-1%) | 9mo | $83,500 | $55 | 51 |
| 1419 Chestnut St | 0.65mi | 3/1.5 (+1) | 1,568 (+2%) | 10mo | $50,000 | $32 | 50 |
| 402 N Horace Ave | 0.50mi | 3/1.0 (+1) | 1,710 (+12%) | 3mo | $100,000 | $58 | 49 |
| 136 Lexington Ave | 0.64mi | 2/1.0 | 1,728 (+13%) | 1mo | $50,000 | $29 | 48 |
| 2120 Andrews | 0.44mi | 3/1.5 (+1) | 1,352 (-12%) | 8mo | $160,000 | $118 | 46 |
| 234 N Central Ave | 0.53mi | 3/1.0 (+1) | 1,395 (-9%) | 14mo | $160,000 | $115 | 44 |
| 317 N Central Ave | 0.58mi | 3/1.5 (+1) | 1,364 (-11%) | 6mo | $112,000 | $82 | 43 |
| 435 Waveland Ave | 0.54mi | 3/2.0 (+1) | 1,310 (-14%) | 2mo | $142,000 | $108 | 40 |
Match score weights: distance 35% · size 25% · config 20% · recency 20%. Top-matched comps best support the ARV.
Projected returns pro-forma
-3.0% appreciation · 3.0% rent growth · sell at horizon
- IRR
- 28.1%
- Equity multiple
- 2.17×
- Total profit
- $26,902
- Equity at exit
- $12,226
- IRR
- 35.6%
- Equity multiple
- 4.28×
- Total profit
- $75,240
- Equity at exit
- $7,090
Cash invested: $22,960 (down + closing). Projections, not guarantees.
Landlord ↔ Tenant lean methodology
- Overall (STATE)
- 43 Moderately Tenant-Leaning
- State Illinois
- 43 Moderately Tenant-Leaning · D+7
- County
- — inherits STATE
- City
- — inherits STATE
ZIP-level market 61102
- Home prices YoY
- -33.1%
- Active inventory
- 69
- Price-to-rent
- 4.5×
Monthly cashflow live
- Estimated rent
- $1,516 high interval (Pro) →
- Mortgage (P&I)
- −$430
- Tax est. 1.5%
- −$102 /mo · $1,230/yr
- Insurance
- −$34
- HOA
- −$0
- Vacancy / Maint / Mgmt
- −$318
- Net cashflow
- $631
Break-even live
UW: 25.0% down · 7.5% · 30yr · 1.5% tax · 5.0% vac · 8.0% maint · 8.0% mgmt
Financing live
Cash to close
- Down payment
- $20,500
- Closing costs
- $2,460
- Reserves months
- —
- Total cash needed
- —
Loan-product check · same deal, 3 products live
Conventional
25% down · 7.5% · 30yr
- Down + closing
- —
- Monthly P&I
- —
- Monthly cashflow
- —
- DSCR
- —
- Eligible?
- —
Personal DTI + credit; lowest rate.
DSCR
20% down · 8.5% · 30yr
- Down + closing
- —
- Monthly P&I
- —
- Monthly cashflow
- —
- DSCR
- —
- Eligible?
- —
No personal income docs; deal must DSCR.
Hard money
10% down · 12.0% · 12mo
- Down + closing
- —
- Monthly P&I
- —
- Monthly cashflow
- —
- DSCR
- —
- Eligible?
- —
Short-term bridge; refi at stabilization.
Rent comps 10 comps
| Address | Beds | Baths | Sqft | Rent | $/sqft | DOM | Units | Dist |
|---|---|---|---|---|---|---|---|---|
| 2315 Green St Rockford, IL | 3.0 | 1.0 | 1290 | $1,600 | $1.24 | 44d | 1 | 0.02mi |
| 2403 Elm St Rockford, IL | 2.0 | 1.0 | 1373 | $1,400 | $1.02 | 13d | 1 | 0.13mi |
| 2403 Elm St Rockford, IL | 2.0 | 1.0 | 1373 | $1,400 | $1.02 | 44d | 1 | 0.13mi |
| 2916 School St Rockford, IL | 3.0 | 1.5 | 1578 | $2,400 | $1.52 | 44d | 1 | 0.57mi |
| 1510 School St Unit 1 Rockford, IL | 3.0 | 1.5 | 1400 | $1,200 | $0.86 | 44d | 1 | 0.73mi |
| 418 Orchard Park Rockford, IL | 3.0 | 1.0 | 1232 | $1,500 | $1.22 | 13d | 1 | 0.76mi |
| 901 N Horace Ave Rockford, IL | 3.0 | 2.0 | 1400 | $1,700 | $1.21 | 13d | 1 | 0.84mi |
| 1248 Ferguson St #2 Rockford, IL | 2.0 | 1.0 | 1200 | $1,200 | $1.00 | 13d | 1 | 1.31mi |
| 1617 Vermont St Rockford, IL | 2.0 | 1.0 | 1375 | $1,325 | $0.96 | 44d | 1 | 1.38mi |
| 1221 S Court St Rockford, IL | 2.0 | 1.0 | 1170 | $1,350 | $1.15 | 44d | 1 | 1.43mi |
Listing history 8 events
-
2026-06-07statusdays on market $82,000 Pending 16 DOM
Show marketing remark (475 chars)
Charming one-owner 2 bedroom, 1 bath home featuring a beautifully remodeled bathroom, enclosed porch perfect for relaxing year-round, and a spacious yard with plenty of room to enjoy the outdoors. Major updates include a newer roof within the last 5 years, offering added peace of mind. The unfinished attic space offers great potential for additional living space, a home office, or extra storage. This well-maintained home is full of character and ready for its next owner!
-
2026-06-03days on market $82,000 Active 13 DOM
-
2026-06-02days on market $82,000 Active 12 DOM
-
2026-06-01days on market $82,000 Active 11 DOM
-
2026-05-31days on market $82,000 Active 10 DOM
-
2026-05-30pricestatusdays on market $82,000 Active 9 DOM
Show marketing remark (475 chars)
Charming one-owner 2 bedroom, 1 bath home featuring a beautifully remodeled bathroom, enclosed porch perfect for relaxing year-round, and a spacious yard with plenty of room to enjoy the outdoors. Major updates include a newer roof within the last 5 years, offering added peace of mind. The unfinished attic space offers great potential for additional living space, a home office, or extra storage. This well-maintained home is full of character and ready for its next owner!
-
2026-05-14$87,000 Active 475-char remark
-
2026-05-13$87,000 Active 475-char remark
Show marketing remark (475 chars)
Charming one-owner 2 bedroom, 1 bath home featuring a beautifully remodeled bathroom, enclosed porch perfect for relaxing year-round, and a spacious yard with plenty of room to enjoy the outdoors. Major updates include a newer roof within the last 5 years, offering added peace of mind. The unfinished attic space offers great potential for additional living space, a home office, or extra storage. This well-maintained home is full of character and ready for its next owner!
ⓘ Source: listings_history table (triggers on properties + properties_extension) + one-shot
backfill from property_details.listing_events for pre-trigger history.
Climate risk First Street
- Flood 1/10 Low FEMA zone X (unshaded) · 0% chance over 30 yrs
- Wildfire 1/10 Low
- Heat 2/10 Low 7 d/yr ≥101°F today · 15 d/yr by 30 yrs out
- Wind 2/10 Low
- Air quality 2/10 Low 1 unhealthy d/yr today · 2 by 30 yrs out
Nearby sold comps map
Loading sold comps map…
Walkable amenities ~0.75 mi
Loading nearby amenities…
Taxation est. · year 1
- Rental income
- $18,187
- − Mortgage interest
- −$4,593
- − Property taxes
- −$1,230
- − Insurance
- −$410
- − Repairs & maintenance
- −$1,455
- − Management
- −$1,455
- − Depreciation
- −$2,385
- Taxable income
- $6,659
- Est. tax owed @ 24.0%
- −$1,598
- After-tax cash flow
- $5,970/yr
For passive investors: Depreciation is non-cash, so a rental often shows a tax loss while cash-flowing — sheltering income. Rental losses are passive: they offset passive income freely, and up to $25,000/yr can offset ordinary (W-2) income if you actively participate and your MAGI is under $100k (phasing out to $0 by $150k); unused losses carry forward. On sale, claimed depreciation is recaptured at up to 25%, and gains may owe capital-gains tax (a 1031 exchange can defer both). Figures are a year-1 estimate at your 24.0% rate — not tax advice; consult a CPA.
Schools (NCES district)
- District
- Rockford SD 205
- NCES district ID
- 1734510
- Math proficiency
- 12% ▼ -2.00%
- Reading proficiency
- 16% ▼ -3.00%
- Median HH income
- $42,533
- Composite
- 12.21/100
- National rank
- #9649
- State rank
- #533 of 620 in IL
Livability — Rockford
- Score
- 62/100
- State rank
- #876
- US rank
- #17035
Category grades
Schools grade is shown separately in the Schools card above.
Census & demographics
- Census place
- Rockford, IL
- City population
- 147,297
- Population (ZIP)
- 16,620
Population outlook (Winnebago County) Hauer SSP2
- Today (2025)
- 271,080 people
- By 2030
- 260,684 · -3.8%
- By 2040
- 238,405 · -12.1%
- By 2050
- 216,129 · -20.3%
- By 2075
- 172,882 · -36.2%
- By 2100
- 135,336 · -50.1%
Race, ethnicity, and origin ACS 2023
- Neighborhood character
- Highly diverse neighborhood (Simpson 0.70)
- Race & ethnicity
- White 36% Black 33% Hispanic / Latino 25% Two or more races 15%
- Hispanic origin (detail)
- Mexican 23%
- Common ancestry
- Portuguese 2% Iranian 1% Romanian 1%
- Foreign-born
- 9% · Canada
- Languages at home
- 81% English-only · Spanish 18%
Political lean MEDSL · Winnebago
- 2024 margin
- Toss-up / Even · D 49.5% · R 49.0% · Other 1.5%
- 2008→2024 swing
- -12.2pp toward R · 2008: 12.8pp · 2024: 0.6pp
- All cycles
- 2024: D+0.6 2020: D+2.5 2016: R+1.2 2012: D+5.7 2008: D+12.8
Not yet ingested
- Civics
- —
Market trends
- HPI YoY
- ▼ -93.81%
- Current HPI
- 189.9634
- Rent YoY
- —
- Metro
- —
- State GDP YoY
- ▲ 1.59%
- F500 in state
- 60
Industry mix (Fortune 500 HQ in IL)
| Industry | F500 HQs | Revenue |
|---|---|---|
| Insurance | 4 | $201B |
|
||
| Consumer Goods | 4 | $87B |
|
||
| Industrial Machinery | 3 | $64B |
|
||
| Healthcare | 2 | $55B |
|
||
| Retail / Pharmacy | 1 | $148B |
|
||
| Agriculture / Food | 1 | $86B |
|
||
Price history
-5.7% since first listed10 events — show timeline
- 2026-06-07 Pending — NWIAR
- 2026-06-07 Contingent — MRED as Distributed by MLS Grid
- 2026-05-30 Relisted — NWIAR
- 2026-05-30 Price Changed $82,000 NWIAR
- 2026-05-30 Relisted — MRED as Distributed by MLS Grid
- 2026-05-30 Price Changed $82,000 MRED as Distributed by MLS Grid
- 2026-05-23 Pending — NWIAR
- 2026-05-23 Pending — MRED as Distributed by MLS Grid
- 2026-05-14 Listed $87,000 NWIAR
- 2026-05-13 Listed $87,000 MRED as Distributed by MLS Grid
Property tax history
-99.5%/yrLatest (2008): $4 · -99.5% YoY. Source: county tax records.
Cash-flow waterfall
monthlySold comps — $/sqft
last 12 mo · ≤1 miLoading sold comps…