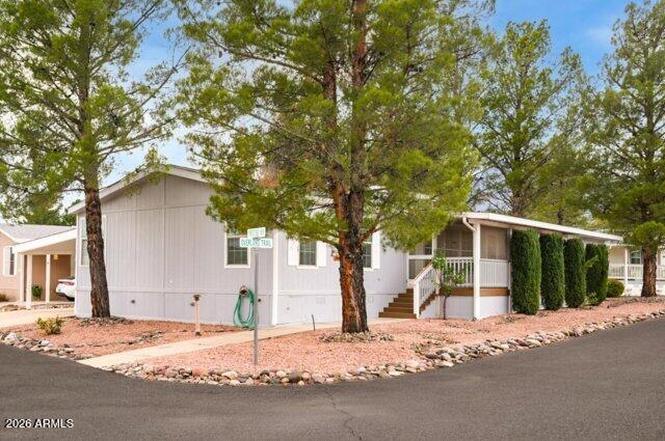
2050 W State Route 89a -- #294 · Cottonwood, AZ
Flood risk 1/10 · Minimal
- FEMA flood zone
- X (unshaded)
- Chance of flooding over 30 yrs
- 0.0%
- Est. flood insurance / yr
- $507 – $1,088
Fire risk 5/10 · Moderate
- Est. fire insurance / yr
- $610 – $1,132
Heat risk 6/10 · Moderate
- Hot days now (above 103°F)
- 8 days/yr
- Hot days in 30 yrs
- 20 days/yr
Wind risk 1/10 · Minimal
- Chance of severe wind over 30 yrs
- —
Air-quality risk 1/10 · Minimal
- Unhealthy air days now
- 0 days/yr
- Unhealthy air days in 30 yrs
- 0 days/yr
Risk factors via First Street. Map © Google.
Why this score? — see what drove the B- grade
The composite is a weighted blend of 9 inputs, each scored 0–100. Each bar is that input's sub-score; the figure is the points it added to the 100-point composite (weight × sub-score).
- Cash flow +30.0/30.0
- 1% rule +10.0/10.0
- DSCR +10.0/10.0
- ARV discount +7.5/15.0
- Livability +4.0/5.0
- Condition / age +2.5/5.0
- Rent growth +2.4/5.0
- Schools +1.9/10.0
- Appreciation +0.0/10.0
$139,000
🖨 Deal sheet 📄 Offer letter ✓ Due diligence
Listing remarks
Newly Updated, Newer Interior & Exterior paint, Oversized kitchen pantry, electric oven with glass top, lots of nice windows & skylights, primary bedroom has a his/hers walk-in closet, new carpet in the primary bedroom, split floor plan, reverse Osmosis & Water Softener, screened in front porch, ceiling fans were replaced, storage shed has electricity, parking is 3 spaces, 2 covered garage spaces, mature landscaping, Cypress trees.
Key facts
- Water softener
- Reverse osmosis
- 5 parking spots
Tags
Property features AI
Finance
- Financial info: Monthly land lease amount $850
- HOA & community: Land lease with monthly fee; Association covers sewer and trash; No visible truck/trailer/RV/boat allowed; Community amenities include pool, community spa (heated), pickleball courts, tennis courts, fitness center, community media room, and biking/walking paths
Exterior
- Parking: 3 open parking spaces; 2 covered spaces; 2 carport spaces
- Security: Gated community
- Utilities: City water; Public sewer; 220V in kitchen / 220V electric available
- Home design: Manufactured/mobile home; Leasehold ownership
- Construction: Wood siding and wood frame construction; Composition roof; Building area reported by owner
- Exterior features: Heated spa; Shed(s); Sprinklers in front; Corner lot; Desert landscaping in back; Gravel/stone front and back; Automatic front watering timer; Private maintained road; Asphalt road surface; Mountain view
Interior
- Kitchen: Built-in microwave; Dishwasher; Electric wall oven; Reverse osmosis; Walk-in pantry; 220V outlet in kitchen
- Bedrooms: Up to 3 bedrooms
- Flooring: Carpet; Laminate; Vinyl
- Bathrooms: 2 full bathrooms
- Heating & cooling: Heat pump heating; Central air; Ceiling fans
- Interior features: Double vanity; Vaulted ceilings; Full bath in master bedroom; Separate shower and tub; Tub with jets; Skylights; Dual-pane windows; Laminate counters
- Laundry & utility: Washer/dryer hook-ups only
Neighborhood map
What this means for you Summary
Snapshot
- This is a 3-bed/2.0-bath single-family listed at $139k.
Deal economics
- At list price, monthly cash flow is $869 ($10k/yr) — positive.
- The deal already cash-flows at list — no discount required.
- Meets the 1% rule at list price ($2k rent vs $139k).
- Recommended offer: $122k (12.0% below list) — sets the bar for market timing.
- Cap rate 13.8% vs local median 3.8% in Cottonwood — top-decile yield for the area; either an underpriced asset or a hidden risk that comps aren't pricing in. Stress-test before assuming the spread holds.
Location & tenants
- Location reads 79/100 on livability (#7 in AZ, #2,176 nationally) — a middle-class / working-renter tenant base. Strengths: health & safety A+, commute A, cost of living A; Watch: employment D, amenities F.
- Cottonwood-Oak Creek Elementary District (4487) (town): math 17% / reading 28% proficiency, ranked #174 of 249 in AZ (top 70%) — low school quality limits family demand, transient renter base, plan for 1-2y turnover.
- Zoned schools: Cottonwood Community School (math 8% / reading 13%, grade F, #993 of 1,109 statewide, top 91%, 500 students, 75% FRL) — zoned schools average 75% FRL vs 52% district-wide (23 pts higher); higher-poverty schools than district average — tighter screening recommended.
- Zoned-school proficiency averages 10% at this address vs 22% district-wide (-12 pts) — the specific schools serving this property underperform the Cottonwood-Oak Creek Elementary District (4487) average; the district grade overstates school quality for this exact location.
- Market conditions: Rents soft (-0.2%/yr); 266 active listings in the ZIP; 4 comparable units currently listed for rent nearby; rentals at typical pace (median 21d on market — plan ~3-4 weeks tenant-placement turnaround); 2,062 units permitted in Yavapai County in 2024 (98 in 5+ unit buildings).
- At $2,316/mo this rent would consume 48% of the median local household income ($57k/yr) (locally 894% of renters already pay >50% of income on rent) — very limited rent-growth headroom before tenants either downsize or default.
Forward outlook
- Local home prices are declining (-3.0%/yr); year-one equity from $961 of loan paydown is wiped out by about $4k of value loss. Plan a longer hold.
- Yavapai County population projected at +10% by 2050 — modest demand growth; plan on rents tracking national, not racing it.
- At projected returns (-3.0% appreciation + 0.0% rent growth), your $39k cash investment doubles in ~6 years — after that, you're playing with house money.
Negotiation context
- It's been on market 143 days — a 12% lower offer ($122k) is reasonable based on typical stale-listing flexibility.
Risks & watch-outs
- Climate carrying-cost: moderate wildfire risk; extreme-heat days projected 8→20/yr by 2055 (HVAC capex compounding) — expect insurance premiums to compound above CPI over the hold.
Questions for the listing agent
- It's been on market 143 days. Have you received any prior offers? Is the seller open to a 12% concession, seller financing, or rate buy-down credit?
- Why hasn't it sold? Are there any deal-killer items the seller is aware of (foundation, flood, title, zoning, code violations)?
- Is there a deadline driving the sale (1031 exchange, divorce, estate, relocation)? That informs how much negotiation room exists.
- What's the average days-on-market for RENTAL listings here right now (not sales)? A rising rental-DOM trend means longer vacancies and softer asking-rent achievability than the comps imply.
- What's the recent tenant-quality profile in this submarket — average credit score on applications, eviction rate, late-payment / NSF rate, and stable-employment percentage? A property-management company in the area should have these aggregated.
- How much new for-sale + rental construction is in the pipeline within 1–3 miles? Heavy new supply typically softens prices + rents 12–24 months out; constrained supply supports both.
Investment metrics
- 1% rule
- 1.67% ✓
- Cap rate
- 13.80%
- Cash-on-cash
- 26.80%
- DSCR
- 2.19
- GRM
- 5.0
CMA / ARV
- ARV (on-the-fly)
- $620,000
- Comps found
- 12
Show comp detail 12 sales within ~0.75 mi
| Address | Dist | Beds/Ba | Sqft | Sold | Price | $/sf | Match |
|---|---|---|---|---|---|---|---|
| 301 Quail Run Ct | 0.53mi | 3/2.5 | 2,059 (+3%) | 6mo | $650,000 | $316 | 63 |
| 1545 Chateau Dr | 0.34mi | 3/2.0 | 1,773 (-11%) | 5mo | $480,000 | $271 | 61 |
| 998 Sterling Ln | 0.45mi | 3/2.0 | 1,845 (-8%) | 11mo | $620,930 | $337 | 57 |
| 1462 Sangria Dr | 0.57mi | 3/2.0 | 1,856 (-7%) | 8mo | $620,300 | $334 | 55 |
| 1900 Old Jerome Hwy | 0.52mi | 3/2.0 | 1,846 (-8%) | 9mo | $575,000 | $311 | 55 |
| 1472 Sanria Dr | 0.52mi | 3/3.0 | 1,941 (-3%) | 17mo | $585,630 | $302 | 53 |
| 2001 Crossroads Blvd | 0.58mi | 3/2.0 | 1,892 (-5%) | 15mo | $550,000 | $291 | 52 |
| 1500 Black Bear Dr | 0.72mi | 3/2.0 | 1,819 (-9%) | 3mo | $535,000 | $294 | 49 |
| 1840 Old Jerome Hwy | 0.47mi | 3/2.0 | 1,750 (-12%) | 16mo | $542,500 | $310 | 44 |
| 1581 Buena Vista Dr | 0.60mi | 2/2.0 (-1) | 1,740 (-13%) | 4mo | $530,000 | $305 | 42 |
| 450 Casner Dr | 0.61mi | 3/2.0 | 1,750 (-12%) | 16mo | $530,000 | $303 | 37 |
| 1749 Silver Spur Cir | 0.58mi | 2/2.0 (-1) | 1,715 (-14%) | 15mo | $550,000 | $321 | 31 |
Match score weights: distance 35% · size 25% · config 20% · recency 20%. Top-matched comps best support the ARV.
Projected returns pro-forma
-3.0% appreciation · 0.0% rent growth · sell at horizon
- IRR
- 17.2%
- Equity multiple
- 1.67×
- Total profit
- $26,078
- Equity at exit
- $20,725
- IRR
- 23.5%
- Equity multiple
- 2.74×
- Total profit
- $67,897
- Equity at exit
- $12,018
Cash invested: $38,920 (down + closing). Projections, not guarantees.
Landlord ↔ Tenant lean methodology
- Overall (STATE)
- 87 Strongly Landlord-Friendly
- State Arizona
- 87 Strongly Landlord-Friendly · R+3
- County
- — inherits STATE
- City
- — inherits STATE
ZIP-level market 86326
- Home prices YoY
- -32.2%
- Rents YoY
- -0.2%
- Active inventory
- 266
- Price-to-rent
- 5.0×
Monthly cashflow live
- Estimated rent
- $2,316 medium interval (Pro) →
- Mortgage (P&I)
- −$729
- Tax est. 1.5%
- −$174 /mo · $2,085/yr
- Insurance
- −$58
- HOA
- −$0
- Vacancy / Maint / Mgmt
- −$486
- Net cashflow
- $869
Break-even live
UW: 25.0% down · 7.5% · 30yr · 1.5% tax · 5.0% vac · 8.0% maint · 8.0% mgmt
Financing live
Cash to close
- Down payment
- $34,750
- Closing costs
- $4,170
- Reserves months
- —
- Total cash needed
- —
Loan-product check · same deal, 3 products live
Conventional
25% down · 7.5% · 30yr
- Down + closing
- —
- Monthly P&I
- —
- Monthly cashflow
- —
- DSCR
- —
- Eligible?
- —
Personal DTI + credit; lowest rate.
DSCR
20% down · 8.5% · 30yr
- Down + closing
- —
- Monthly P&I
- —
- Monthly cashflow
- —
- DSCR
- —
- Eligible?
- —
No personal income docs; deal must DSCR.
Hard money
10% down · 12.0% · 12mo
- Down + closing
- —
- Monthly P&I
- —
- Monthly cashflow
- —
- DSCR
- —
- Eligible?
- —
Short-term bridge; refi at stabilization.
Rent comps 4 comps
| Address | Beds | Baths | Sqft | Rent | $/sqft | DOM | Units | Dist |
|---|---|---|---|---|---|---|---|---|
| 992 Sterling Ln Cottonwood, AZ | 3.0 | 2.0 | 1652 | $2,395 | $1.45 | 21d | 1 | 0.44mi |
| 1121 Old Jerome Hwy Clarkdale, AZ | 2.0 | 2.0 | 1981 | $2,185 | $1.10 | 21d | 1 | 1.07mi |
| 255 S Cottonwood Ranch Rd Cottonwood, AZ | 3.0 | 2.0 | 1695 | $2,195 | $1.29 | 13d | 1 | 1.12mi |
| 832 Eugene Rd Clarkdale, AZ | 3.0 | 2.0 | 1709 | $2,700 | $1.58 | 13d | 1 | 1.30mi |
Listing history 19 events
-
2026-06-18days on market $139,000 Active 143 DOM
-
2026-06-17days on market $139,000 Active 142 DOM
-
2026-06-16days on market $139,000 Active 141 DOM
-
2026-06-15days on market $139,000 Active 140 DOM
-
2026-06-14days on market $139,000 Active 138 DOM
-
2026-06-13days on market $139,000 Active 137 DOM
-
2026-06-10days on market $139,000 Active 135 DOM
-
2026-06-09days on market $139,000 Active 134 DOM
-
2026-06-08days on market $139,000 Active 133 DOM
-
2026-06-07days on market $139,000 Active 132 DOM
-
2026-06-05days on market $139,000 Active 129 DOM
-
2026-06-03days on market $139,000 Active 128 DOM
-
2026-06-02days on market $139,000 Active 127 DOM
-
2026-06-01days on market $139,000 Active 126 DOM
-
2026-05-31days on market $139,000 Active 125 DOM
-
2026-05-30days on market $139,000 Active 124 DOM
-
2026-05-11price $139,000
-
2026-03-01price $159,000
-
2026-01-26$169,900 Active
ⓘ Source: listings_history table (triggers on properties + properties_extension) + one-shot
backfill from property_details.listing_events for pre-trigger history.
Climate risk First Street
- Flood 1/10 Low FEMA zone X (unshaded) · 0% chance over 30 yrs
- Wildfire 5/10 Major
- Heat 6/10 Major 8 d/yr ≥103°F today · 20 d/yr by 30 yrs out
- Wind 1/10 Low
- Air quality 1/10 Low 0 unhealthy d/yr today · 0 by 30 yrs out
Nearby sold comps map
Loading sold comps map…
Walkable amenities ~0.75 mi
Loading nearby amenities…
Taxation est. · year 1
- Rental income
- $27,793
- − Mortgage interest
- −$7,786
- − Property taxes
- −$2,085
- − Insurance
- −$695
- − Repairs & maintenance
- −$2,223
- − Management
- −$2,223
- − Depreciation
- −$4,044
- Taxable income
- $8,736
- Est. tax owed @ 24.0%
- −$2,097
- After-tax cash flow
- $8,333/yr
For passive investors: Depreciation is non-cash, so a rental often shows a tax loss while cash-flowing — sheltering income. Rental losses are passive: they offset passive income freely, and up to $25,000/yr can offset ordinary (W-2) income if you actively participate and your MAGI is under $100k (phasing out to $0 by $150k); unused losses carry forward. On sale, claimed depreciation is recaptured at up to 25%, and gains may owe capital-gains tax (a 1031 exchange can defer both). Figures are a year-1 estimate at your 24.0% rate — not tax advice; consult a CPA.
Schools (NCES district)
- District
- Cottonwood-Oak Creek Elementary District (4487)
- NCES district ID
- 0402370
- Math proficiency
- 17% ▼ -10.00%
- Reading proficiency
- 28% ▼ -7.00%
- Median HH income
- $41,740
- Composite
- 19.16/100
- National rank
- #8822
- State rank
- #174 of 249 in AZ
Livability — Cottonwood
- Score
- 79/100
- State rank
- #7
- US rank
- #2176
Category grades
Schools grade is shown separately in the Schools card above.
Census & demographics
- Census place
- Cottonwood, AZ
- County
- Yavapai County · 190,406 people
- City population
- 24,852
- Metro
- Prescott Valley-Prescott, AZ
- Population (ZIP)
- 24,852
- Household income
- $57,378
- Rent vs Own
- Severe rent burden
- 894.0
Population outlook (Yavapai County) Hauer SSP2
- Today (2025)
- 241,389 people
- By 2030
- 249,523 · +3.4%
- By 2040
- 259,966 · +7.7%
- By 2050
- 264,736 · +9.7%
- By 2075
- 269,334 · +11.6%
- By 2100
- 256,505 · +6.3%
Race, ethnicity, and origin ACS 2023
- Neighborhood character
- Predominantly White (73%)
- Race & ethnicity
- White 73% Hispanic / Latino 20% Two or more races 14% Native American 1%
- Hispanic origin (detail)
- Mexican 17%
- Common ancestry
- Italian 3% Romanian 3% Lithuanian 2%
- Foreign-born
- 12% · Canada
- Languages at home
- 84% English-only · Spanish 14% German/W. Germanic 1%
Political lean MEDSL · Yavapai
- 2024 margin
- Solid R (+33.9) · D 32.6% · R 66.5%
- 2008→2024 swing
- -9.5pp toward R · 2008: -24.4pp · 2024: -33.9pp
- All cycles
- 2024: R+33.9 2020: R+29.3 2016: R+31.4 2012: R+30.7 2008: R+24.4
Not yet ingested
- Civics
- —
Market trends
- HPI YoY
- ▼ -165.27%
- Current HPI
- 347.5058
- Rent YoY
- ▼ -0.22%
- Metro
- Prescott Valley-Prescott, AZ
- State GDP YoY
- ▲ 4.54%
- F500 in state
- 20
Industry mix (Fortune 500 HQ in AZ)
| Industry | F500 HQs | Revenue |
|---|---|---|
| Technology | 2 | $13B |
|
||
| Mining / Metals | 1 | $23B |
|
||
| Environmental Services | 1 | $16B |
|
||
| Metals / Steel | 1 | $14B |
|
||
| Technology Distribution | 1 | $9B |
|
||
| Homebuilding | 1 | $8B |
|
||
Price history
-18.2% since first listed3 events — show timeline
- 2026-05-11 Price Changed $139,000 ARMLS
- 2026-03-01 Price Changed $159,000 ARMLS
- 2026-01-26 Listed $169,900 ARMLS
Cash-flow waterfall
monthlySold comps — $/sqft
last 12 mo · ≤1 miLoading sold comps…