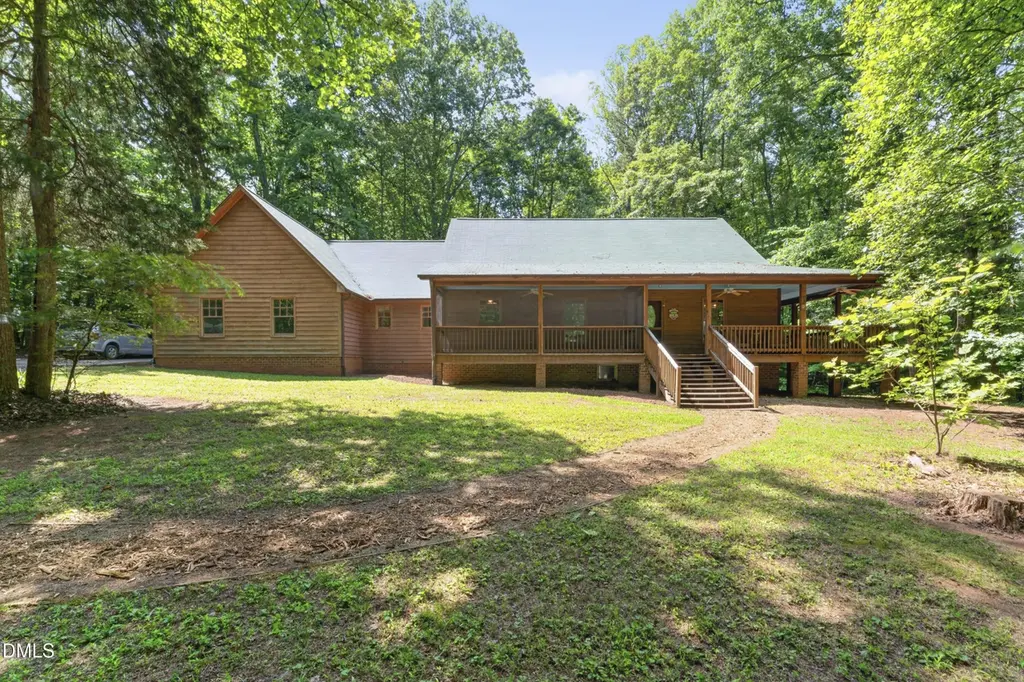
263 Pointe Mayo Dr · Roxboro, NC
Flood risk 1/10 · Minimal
- FEMA flood zone
- X (unshaded)
- Chance of flooding over 30 yrs
- 0.0%
- Est. flood insurance / yr
- $473 – $860
Fire risk 3/10 · Minor
- Est. fire insurance / yr
- $906 – $1,684
Heat risk 6/10 · Moderate
- Hot days now (above 104°F)
- 7 days/yr
- Hot days in 30 yrs
- 17 days/yr
Wind risk 5/10 · Moderate
- Chance of severe wind over 30 yrs
- 22.0%
Air-quality risk 1/10 · Minimal
- Unhealthy air days now
- 0 days/yr
- Unhealthy air days in 30 yrs
- 0 days/yr
Risk factors via First Street. Map © Google.
Why this score? — see what drove the D+ grade
The composite is a weighted blend of 9 inputs, each scored 0–100. Each bar is that input's sub-score; the figure is the points it added to the 100-point composite (weight × sub-score).
- ARV discount +15.0/15.0
- Appreciation +10.0/10.0
- Cash flow +7.7/30.0
- Schools +3.4/10.0
- Livability +2.8/5.0
- Rent growth +2.5/5.0
- Condition / age +2.5/5.0
- DSCR +1.8/10.0
- 1% rule +1.4/10.0
$424,900
🖨 Deal sheet 📄 Offer letter ✓ Due diligence
Listing remarks
Escape to your own private sanctuary near Mayo Lake! Nestled on a beautifully wooded lot in the highly desirable Pointe Mayo neighborhood, this exceptional single-family residence perfectly blends the ease of one-level living with a spectacular, nature-filled backdrop. Step inside to experience an effortlessly flowing open floor plan with ample natural light. Designed for modern living, the main level keeps everything you need within easy reach while maintaining an airy, spacious feel. The interior transitions seamlessly to the outdoors, where you will find the crown jewel of the home's layout: a gorgeous wrap-around porch that connects to a peaceful screened porch. It's the ultimate setup
Key facts
- 4.29 acre lot
- 2 garage spots
- Built 1998
Neighborhood map
What this means for you Summary
Snapshot
- This is a 3-bed/2.5-bath single-family listed at $425k.
Deal economics
- At list price, monthly cash flow is $-483 ($-6k/yr) — negative.
- To cash-flow at today's rent, offer at most $340k (20.1% below list).
- To meet the 1% rule (rent ≥ 1% of price), the offer needs to be $274k (35.6% below list).
- Recommended offer: $274k (35.6% below list) — sets the bar for 1% rule.
Location & tenants
- Location reads 55/100 on livability (#649 in NC) — a working-class tenant base; expect higher turnover. Strengths: cost of living A+; Watch: schools D-, crime F, amenities F.
- Person County Schools (rural): math 39% / reading 42% proficiency, ranked #110 of 178 in NC (top 62%) — families likely to look elsewhere, expect single-tenant / working-renter base with shorter leases.
- Market conditions: 128 active listings in the ZIP; 113 units permitted in Person County in 2024 (0 in 5+ unit buildings).
Forward outlook
- In year one you build about $45k of equity ($3k loan paydown + $42k appreciation (10.0% local appreciation)).
- Person County population projected at -15% by 2050 — secular population decline; favor cash flow + early exit over multi-decade hold.
- By year 2, paydown + projected appreciation supports a ~$73k cash-out refi (75% LTV) — recoverable capital for the next deal without selling this one.
Negotiation context
- Only 13 days on market — expect competitive offers; lowballing is unlikely to land.
- Current owner paid $12k; list at $425k implies a 3441% gain — meaningful room to come down on a strong offer.
Risks & watch-outs
- Climate carrying-cost: moderate wind risk, 22% chance of damaging wind over 30y; extreme-heat days projected 7→17/yr by 2055 (HVAC capex compounding) — expect insurance premiums to compound above CPI over the hold.
Questions for the listing agent
- What do current leases actually rent for vs. the listed asking? Can we see a recent rent roll and the last 12 months of T-12 income?
- What does the HOA fee cover, when was the last increase, and are there any pending special assessments or reserve-fund shortfalls?
- Is there a deadline driving the sale (1031 exchange, divorce, estate, relocation)? That informs how much negotiation room exists.
- Schools are D-rated, which usually means shorter tenancies and higher turnover. Who's the typical renter profile here, and what's been the actual vacancy rate?
- Crime grade is F in this area — have there been break-ins, vandalism, or insurance claims at this property in the last 3 years? What carrier currently insures it and at what premium?
- The area grade is low — what's the realistic commute time and amenity access for the typical tenant pool here? Any planned neighborhood developments (good or bad) we should know about?
- What's the average days-on-market for RENTAL listings here right now (not sales)? A rising rental-DOM trend means longer vacancies and softer asking-rent achievability than the comps imply.
- What's the recent tenant-quality profile in this submarket — average credit score on applications, eviction rate, late-payment / NSF rate, and stable-employment percentage? A property-management company in the area should have these aggregated.
- How much new for-sale + rental construction is in the pipeline within 1–3 miles? Heavy new supply typically softens prices + rents 12–24 months out; constrained supply supports both.
Investment metrics
- 1% rule
- 0.64% ✗
- Cap rate
- 4.93%
- Cash-on-cash
- -4.87%
- DSCR
- 0.78
- GRM
- 12.9
CMA / ARV
- ARV (on-the-fly)
- $532,082
- Comps found
- 1
Show comp detail 1 sale within ~0.75 mi
| Address | Dist | Beds/Ba | Sqft | Sold | Price | $/sf | Match |
|---|---|---|---|---|---|---|---|
| 199 Oakwood Ln | 0.33mi | 3/2.5 | 1,880 (-5%) | 4mo | $505,000 | $269 | 73 |
Match score weights: distance 35% · size 25% · config 20% · recency 20%. Top-matched comps best support the ARV.
Projected returns pro-forma
10.0% appreciation · 3.0% rent growth · sell at horizon
- IRR
- 20.8%
- Equity multiple
- 2.69×
- Total profit
- $200,540
- Equity at exit
- $382,784
- IRR
- 18.9%
- Equity multiple
- 6.16×
- Total profit
- $614,451
- Equity at exit
- $825,487
Cash invested: $118,972 (down + closing). Projections, not guarantees.
Landlord ↔ Tenant lean methodology
- Overall (STATE)
- 85 Strongly Landlord-Friendly
- State North Carolina
- 85 Strongly Landlord-Friendly · R+3
- County
- — inherits STATE
- City
- — inherits STATE
ZIP-level market 27574
- Home prices YoY
- 8.5%
- Active inventory
- 128
- Price-to-rent
- 12.9×
Monthly cashflow live
- Estimated rent
- $2,736 medium interval (Pro) →
- Mortgage (P&I)
- −$2,228
- Tax from tax record
- −$214 /mo · $2,569/yr
- Insurance
- −$177
- HOA
- −$25
- Vacancy / Maint / Mgmt
- −$575
- Net cashflow
- $-483
Break-even live
UW: 25.0% down · 7.5% · 30yr · 1.5% tax · 5.0% vac · 8.0% maint · 8.0% mgmt
Financing live
Cash to close
- Down payment
- $106,225
- Closing costs
- $12,747
- Reserves months
- —
- Total cash needed
- —
Loan-product check · same deal, 3 products live
Conventional
25% down · 7.5% · 30yr
- Down + closing
- —
- Monthly P&I
- —
- Monthly cashflow
- —
- DSCR
- —
- Eligible?
- —
Personal DTI + credit; lowest rate.
DSCR
20% down · 8.5% · 30yr
- Down + closing
- —
- Monthly P&I
- —
- Monthly cashflow
- —
- DSCR
- —
- Eligible?
- —
No personal income docs; deal must DSCR.
Hard money
10% down · 12.0% · 12mo
- Down + closing
- —
- Monthly P&I
- —
- Monthly cashflow
- —
- DSCR
- —
- Eligible?
- —
Short-term bridge; refi at stabilization.
HOA detail
- Monthly dues
- $25 · $300/yr
Listing history 11 events
-
2026-06-18days on market $424,900 Active 13 DOM
-
2026-06-17days on market $424,900 Active 12 DOM
-
2026-06-16days on market $424,900 Active 11 DOM
-
2026-06-15days on market $424,900 Active 10 DOM
-
2026-06-13days on market $424,900 Active 8 DOM
-
2026-06-12days on market $424,900 Active 7 DOM
-
2026-06-09days on market $424,900 Active 4 DOM
-
2026-06-08days on market $424,900 Active 3 DOM
-
2026-06-07days on market $424,900 Active 2 DOM
-
2026-06-05remarks 699-char remark
-
2026-06-05$424,900 Active 1 DOM
ⓘ Source: listings_history table (triggers on properties + properties_extension) + one-shot
backfill from property_details.listing_events for pre-trigger history.
Tax reassessment forecast NC · Resets to sale price
- Current annual tax
- $2,569 · $214/mo
- Projected year-2 tax
- $3,484 · $290/mo
- Expected delta
- +$915/yr (+$76/mo · 35.6%)
ⓘ Screening estimate from a state-policy table — verify with the county assessor before closing.
Climate risk First Street
- Flood 1/10 Low FEMA zone X (unshaded) · 0% chance over 30 yrs
- Wildfire 3/10 Moderate
- Heat 6/10 Major 7 d/yr ≥104°F today · 17 d/yr by 30 yrs out
- Wind 5/10 Major 22% chance of damaging wind over 30 yrs
- Air quality 1/10 Low 0 unhealthy d/yr today · 0 by 30 yrs out
Nearby sold comps map
Loading sold comps map…
Walkable amenities ~0.75 mi
Loading nearby amenities…
Taxation est. · year 1
- Rental income
- $32,837
- − Mortgage interest
- −$23,801
- − Property taxes
- −$2,569
- − Insurance
- −$2,124
- − Repairs & maintenance
- −$2,627
- − Management
- −$2,627
- − HOA
- −$300
- − Depreciation
- −$12,361
- Taxable loss
- −$13,572
- Est. tax savings @ 24.0%
- +$3,257
- After-tax cash flow
- $-2,533/yr
For passive investors: Depreciation is non-cash, so a rental often shows a tax loss while cash-flowing — sheltering income. Rental losses are passive: they offset passive income freely, and up to $25,000/yr can offset ordinary (W-2) income if you actively participate and your MAGI is under $100k (phasing out to $0 by $150k); unused losses carry forward. On sale, claimed depreciation is recaptured at up to 25%, and gains may owe capital-gains tax (a 1031 exchange can defer both). Figures are a year-1 estimate at your 24.0% rate — not tax advice; consult a CPA.
Schools (NCES district)
- District
- Person County Schools
- NCES district ID
- 3703630
- Math proficiency
- 39% ▬ 0.00%
- Reading proficiency
- 42% ▲ 2.00%
- Median HH income
- $43,729
- Composite
- 34.3/100
- National rank
- #5242
- State rank
- #110 of 178 in NC
Livability — Roxboro
- Score
- 55/100
- State rank
- #649
- US rank
- #23536
Category grades
Schools grade is shown separately in the Schools card above.
Census & demographics
- City population
- 11,954
- Population (ZIP)
- 14,163
Population outlook (Person County) Hauer SSP2
- Today (2025)
- 38,577 people
- By 2030
- 37,847 · -1.9%
- By 2040
- 35,740 · -7.4%
- By 2050
- 32,683 · -15.3%
- By 2075
- 24,979 · -35.2%
- By 2100
- 15,779 · -59.1%
Race, ethnicity, and origin ACS 2023
- Neighborhood character
- Predominantly White (68%)
- Race & ethnicity
- White 68% Black 28% Two or more races 3% Hispanic / Latino 2%
- Common ancestry
- Italian 2% Slovak 1% Serbian 1%
- Foreign-born
- 1% · Canada
- Languages at home
- 98% English-only · Spanish 2%
Political lean MEDSL · Person
- 2024 margin
- Strong R (+23.7) · D 37.7% · R 61.4%
- 2008→2024 swing
- -15.2pp toward R · 2008: -8.5pp · 2024: -23.7pp
- All cycles
- 2024: R+23.7 2020: R+21.6 2016: R+17.3 2012: R+11.0 2008: R+8.5
Not yet ingested
- Civics
- —
Market trends
- HPI YoY
- ▲ 21.68%
- Current HPI
- 276.8767
- Rent YoY
- —
- Metro
- —
- State GDP YoY
- ▲ 3.28%
- F500 in state
- 26
Industry mix (Fortune 500 HQ in NC)
| Industry | F500 HQs | Revenue |
|---|---|---|
| Financial Services | 2 | $213B |
|
||
| Retail | 2 | $95B |
|
||
| Industrial Conglomerate | 1 | $38B |
|
||
| Metals / Steel | 1 | $35B |
|
||
| Utilities | 1 | $30B |
|
||
| Industrial Machinery | 1 | $19B |
|
||
Price history
+3440.8% since first listed3 events — show timeline
- 2026-06-05 Listed $424,900 TMLS
- 2026-06-05 Coming Soon $424,900 TMLS
- 1995-04-05 Sold (Public Records) $12,000 Public Records
Property tax history
+3.2%/yrLatest (2025): $2,569 · +13.8% YoY. Source: county tax records.
Cash-flow waterfall
monthlySold comps — $/sqft
last 12 mo · ≤1 miLoading sold comps…